> ## Documentation Index
> Fetch the complete documentation index at: https://moengage.com/docs/llms.txt
> Use this file to discover all available pages before exploring further.
# OTT コンテンツのパフォーマンスを分析する方法
# はじめに
メディアやエンターテインメントのブランドにとって、さまざまなコンテンツの時系列データを比較することで、マーケターは視聴数、エンゲージメント、リテンションの観点からどの番組、映画、エピソードのパフォーマンスが高いかを特定できます。視聴傾向を時系列で分析することで、人気のジャンル、テーマ、フォーマットが明らかになり、コンテンツの調達や制作に関する意思決定に役立ちます。
この記事では、アプリやサイト上のさまざまなコンテンツの視聴状況を、エンゲージメントとリテンションの観点から分析する方法について説明します。
# 期待される結果
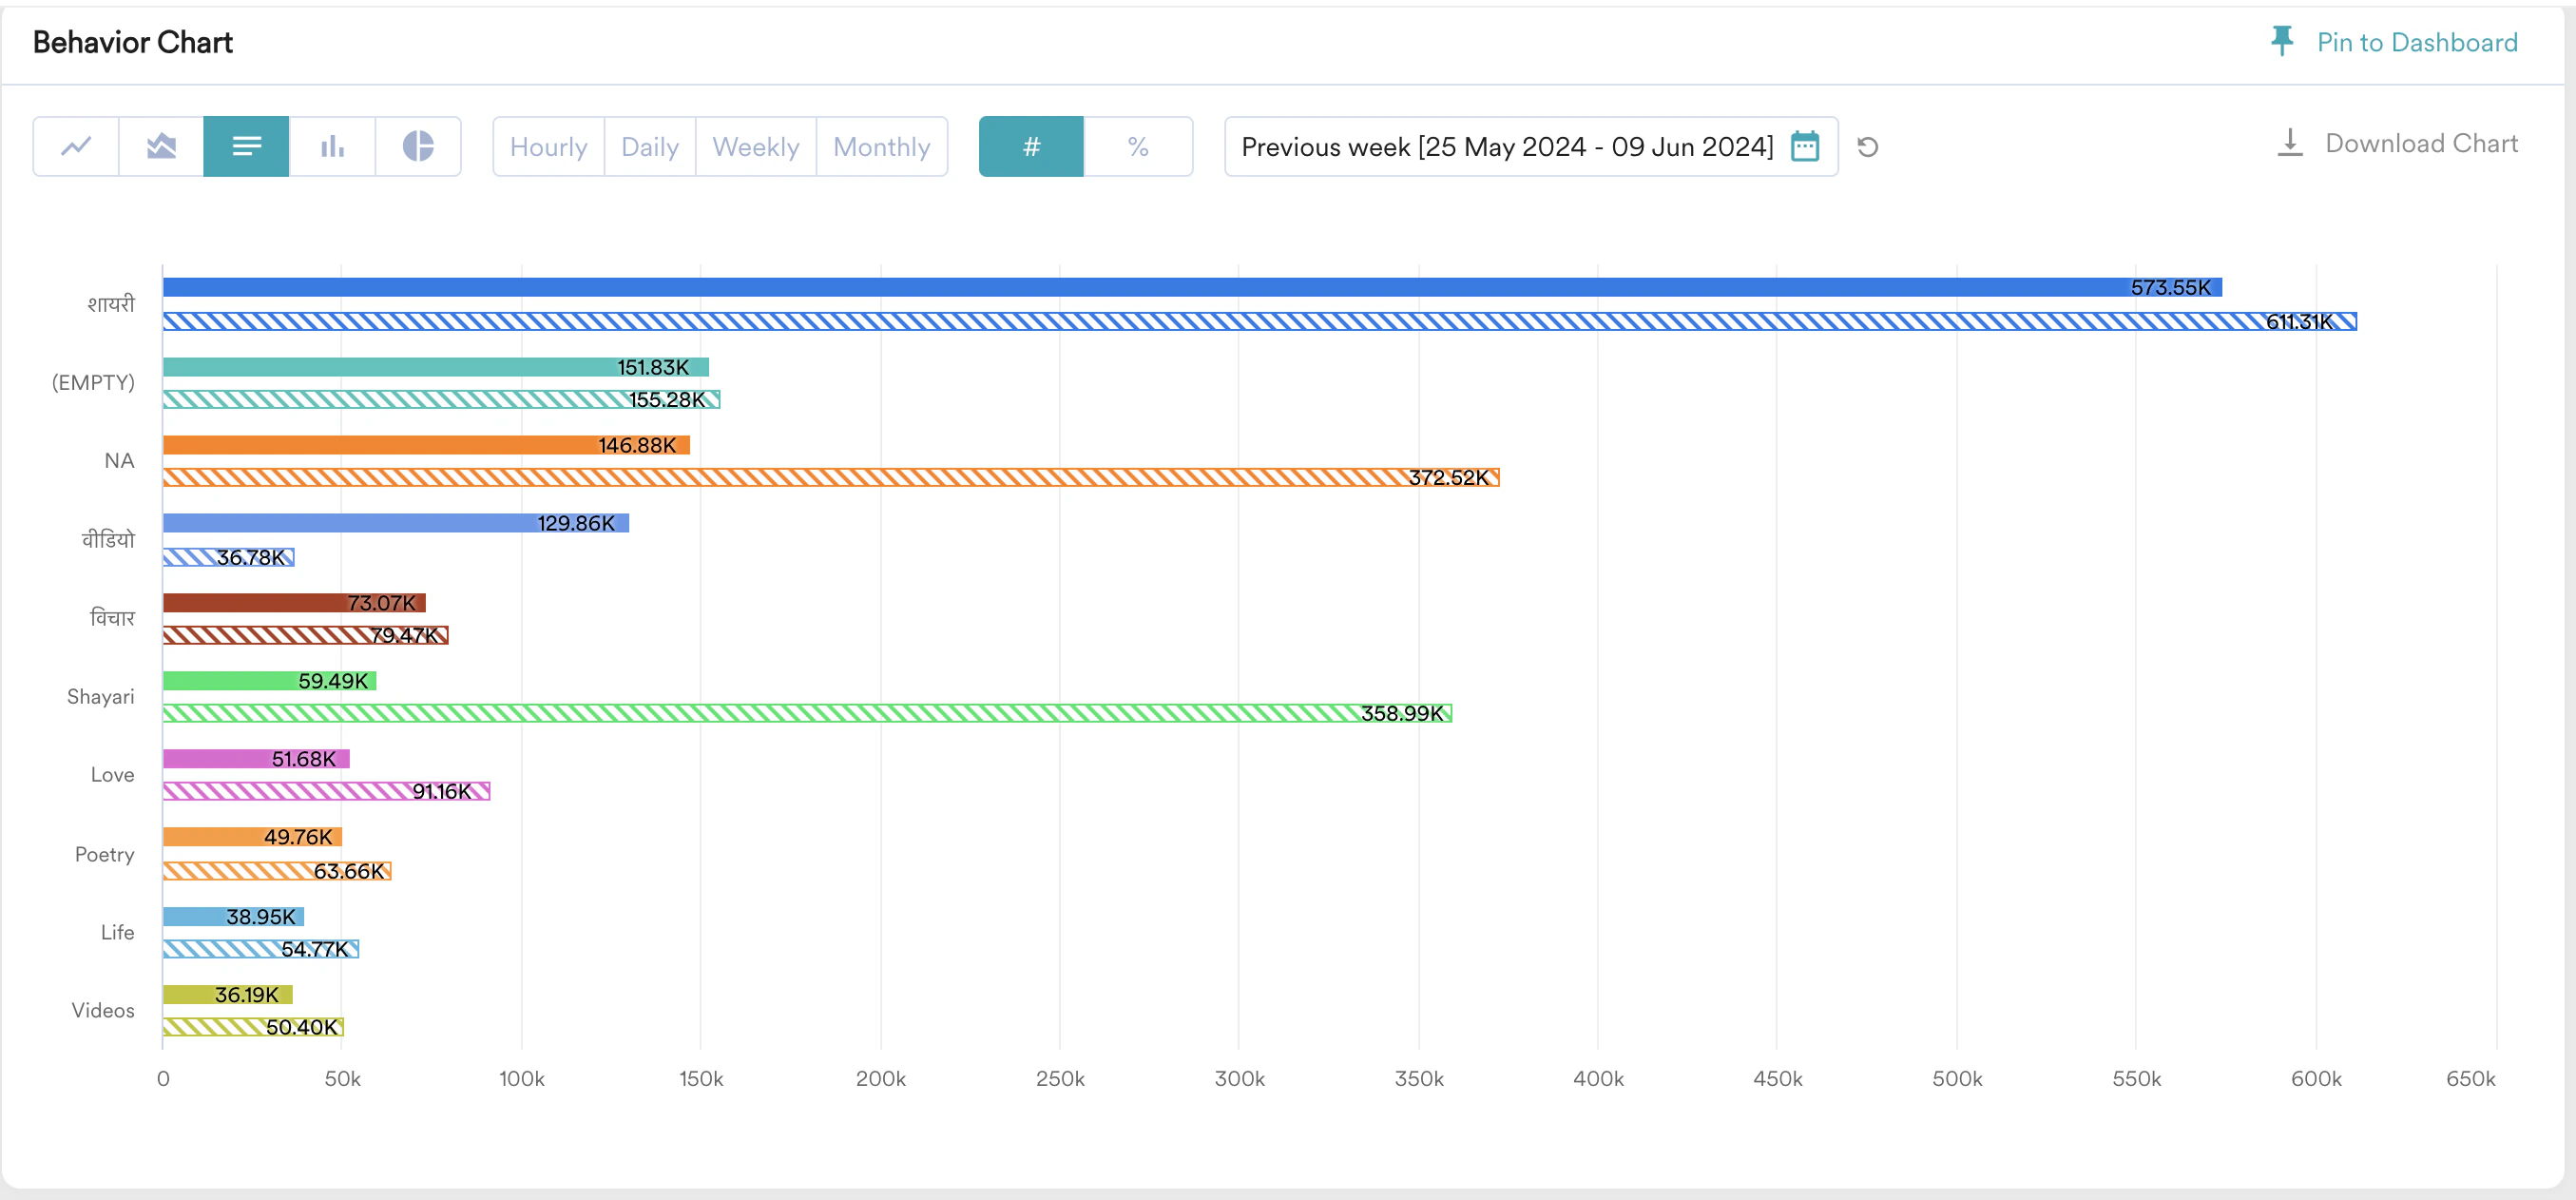
マーケターは、アプリやサイト上の動画視聴数の時系列比較を確認できるようになります。
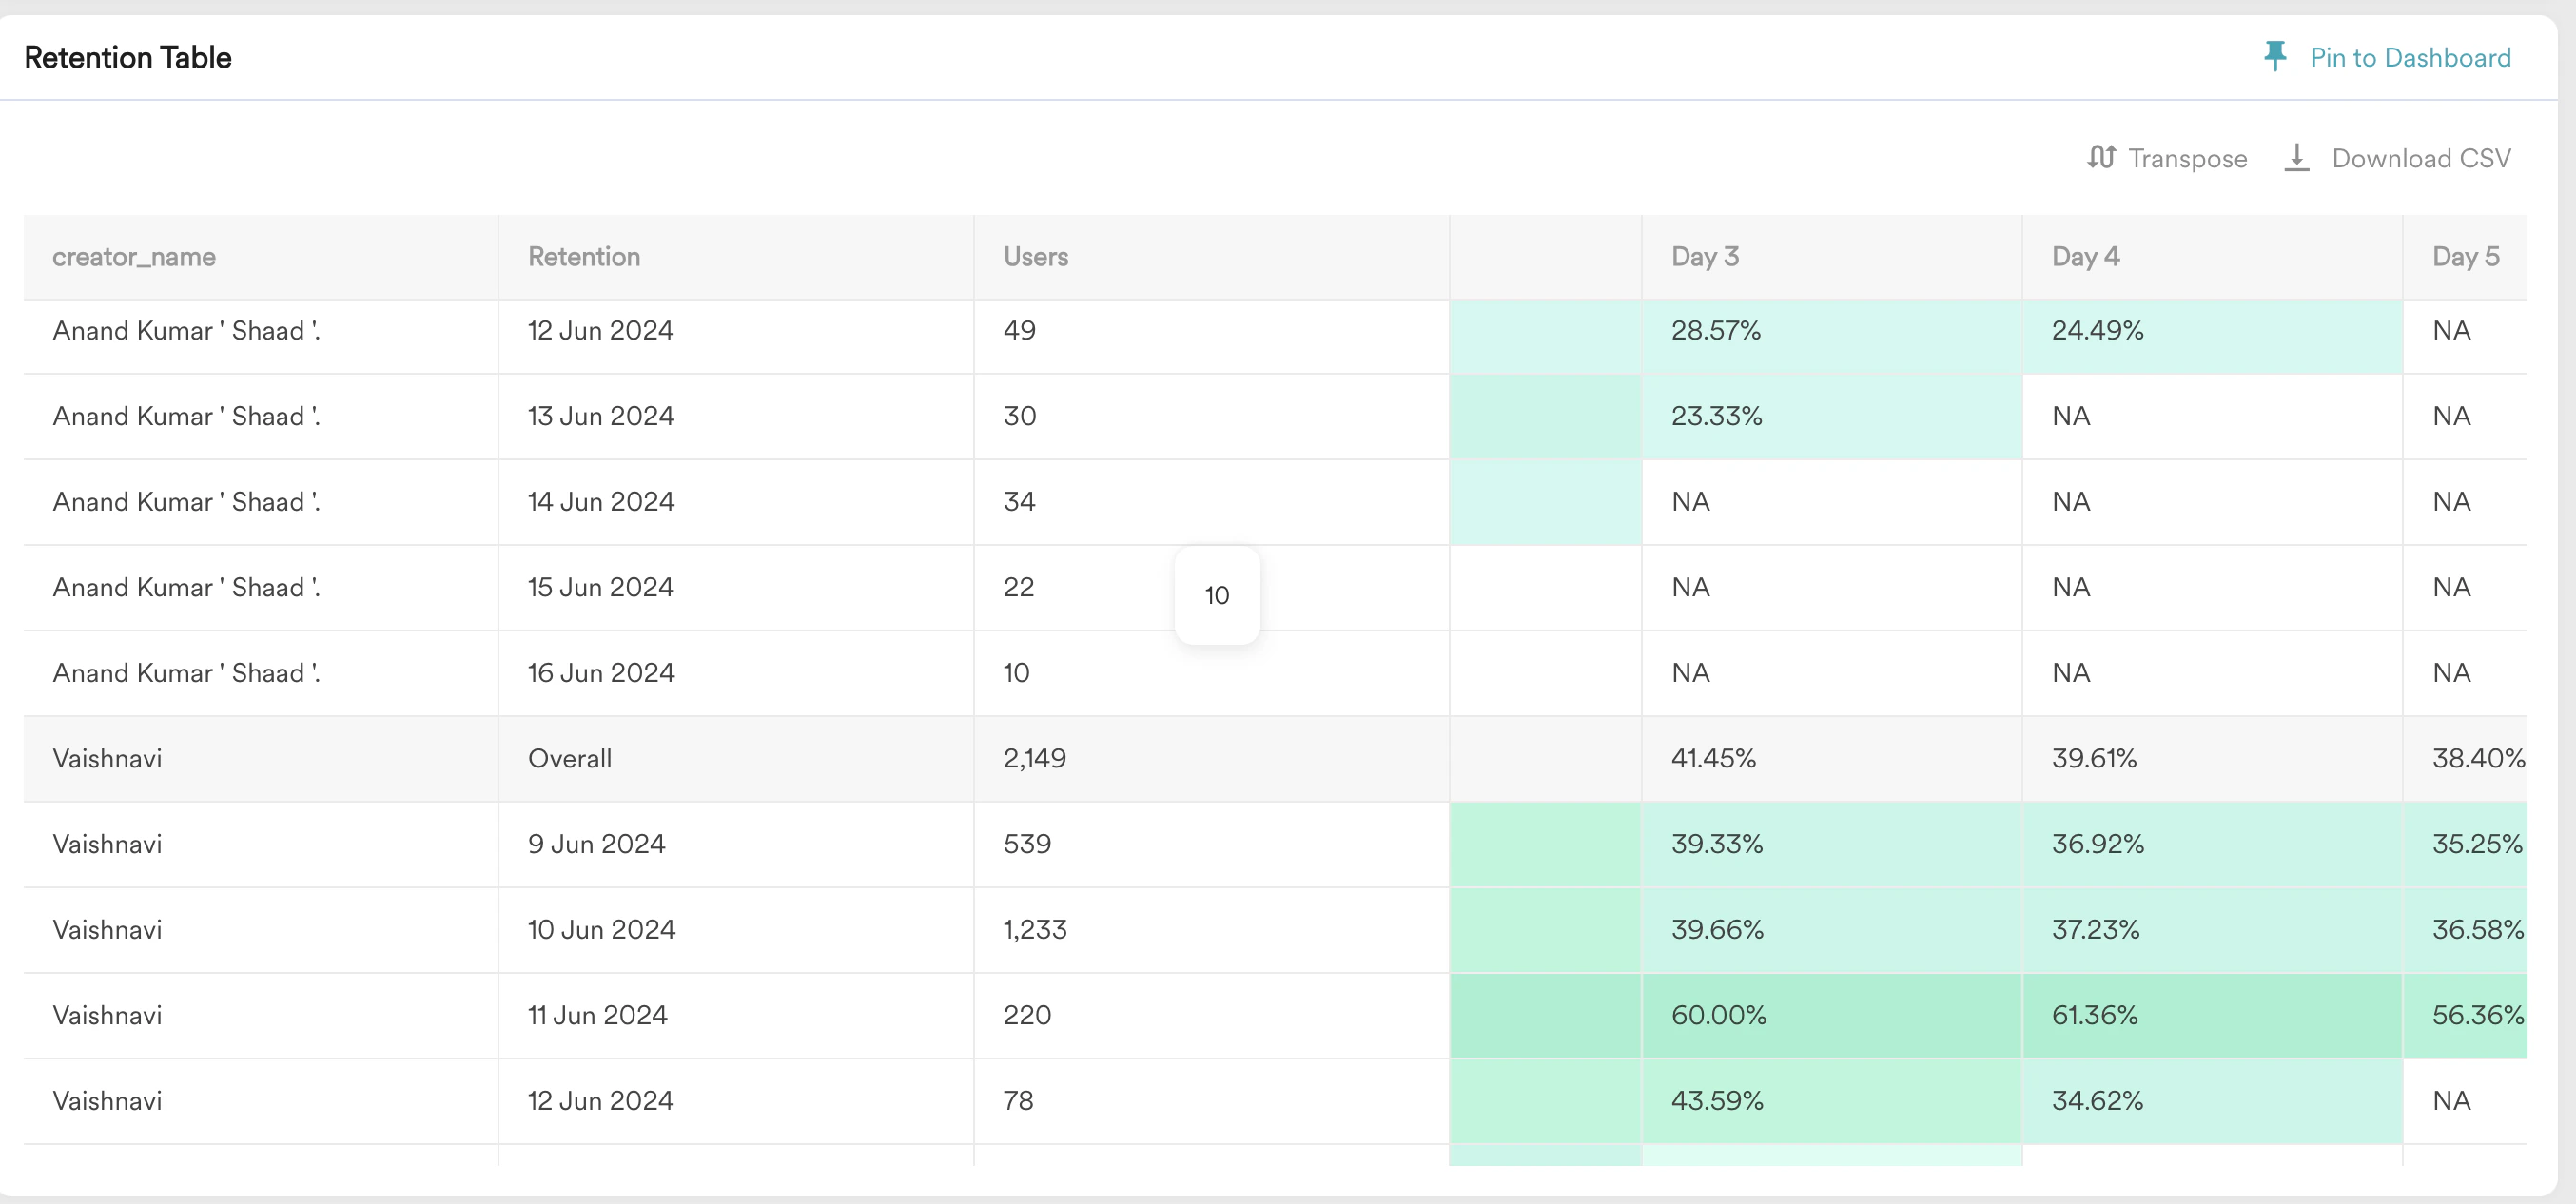
 マーケターは、コンテンツクリエイターごとに動画のリテンション率を特定できるようになります。
 * Analyze プロダクトが有効になっている必要があります。
* video\_categories 属性を持つ video\_watched などのイベントが存在している必要があります。
# コンテンツのパフォーマンスを分析する
このセクションでは、コンテンツのパフォーマンスを分析します。
## エンゲージメント、人気度、視聴数に基づいて比較する
1. MoEngage ダッシュボードで **Analyze** > **Behaviour** に移動します。
* Analyze プロダクトが有効になっている必要があります。
* video\_categories 属性を持つ video\_watched などのイベントが存在している必要があります。
# コンテンツのパフォーマンスを分析する
このセクションでは、コンテンツのパフォーマンスを分析します。
## エンゲージメント、人気度、視聴数に基づいて比較する
1. MoEngage ダッシュボードで **Analyze** > **Behaviour** に移動します。
 2. コンテンツ視聴イベントを追加します。
3. **Split by** ドロップダウンリストから、カテゴリのイベント属性に基づいて分割します。
2. コンテンツ視聴イベントを追加します。
3. **Split by** ドロップダウンリストから、カテゴリのイベント属性に基づいて分割します。
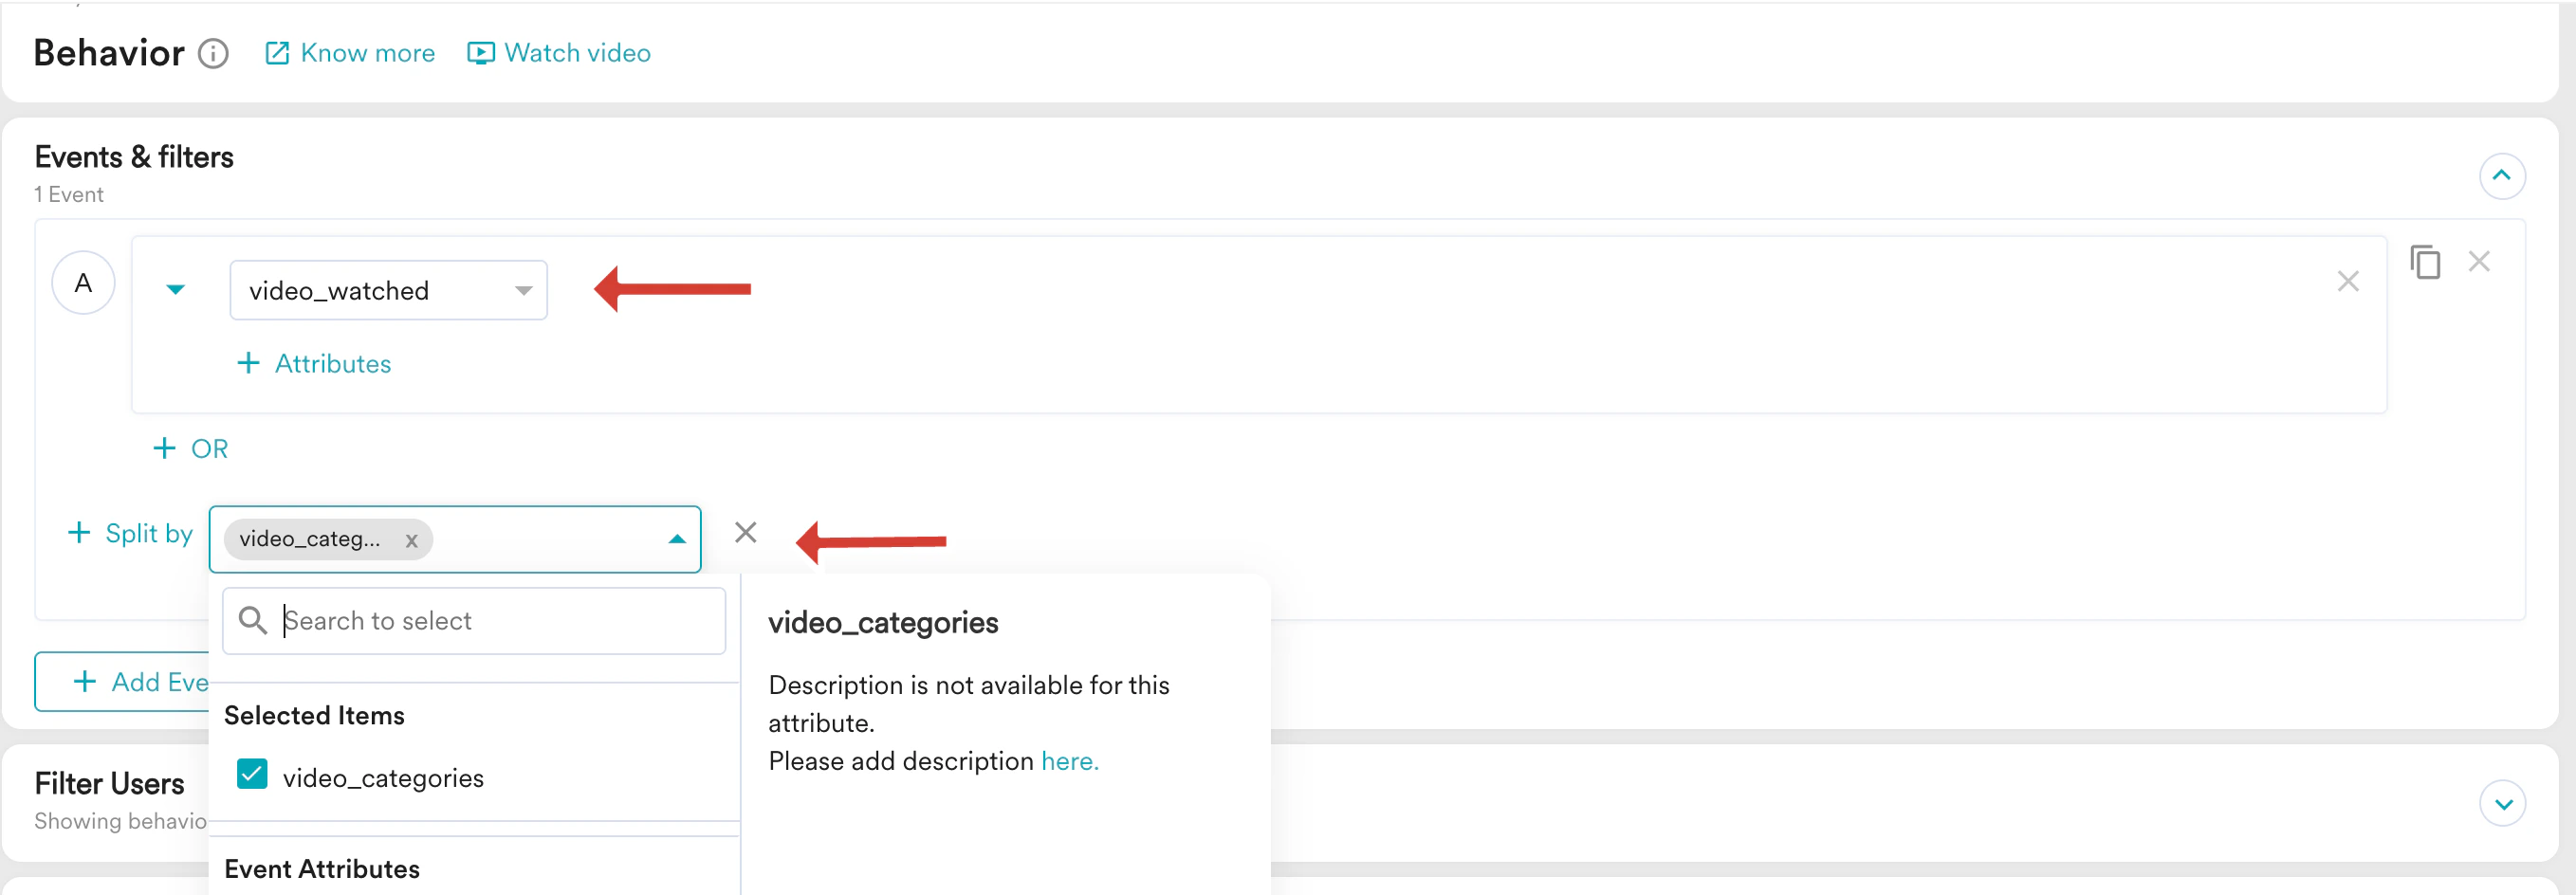 4. **Analysis type** ドロップダウンと **Duration** フィールドから必要なオプションを選択します。
 5. **Apply** をクリックします。
6. 比較期間を選択します。
5. **Apply** をクリックします。
6. 比較期間を選択します。
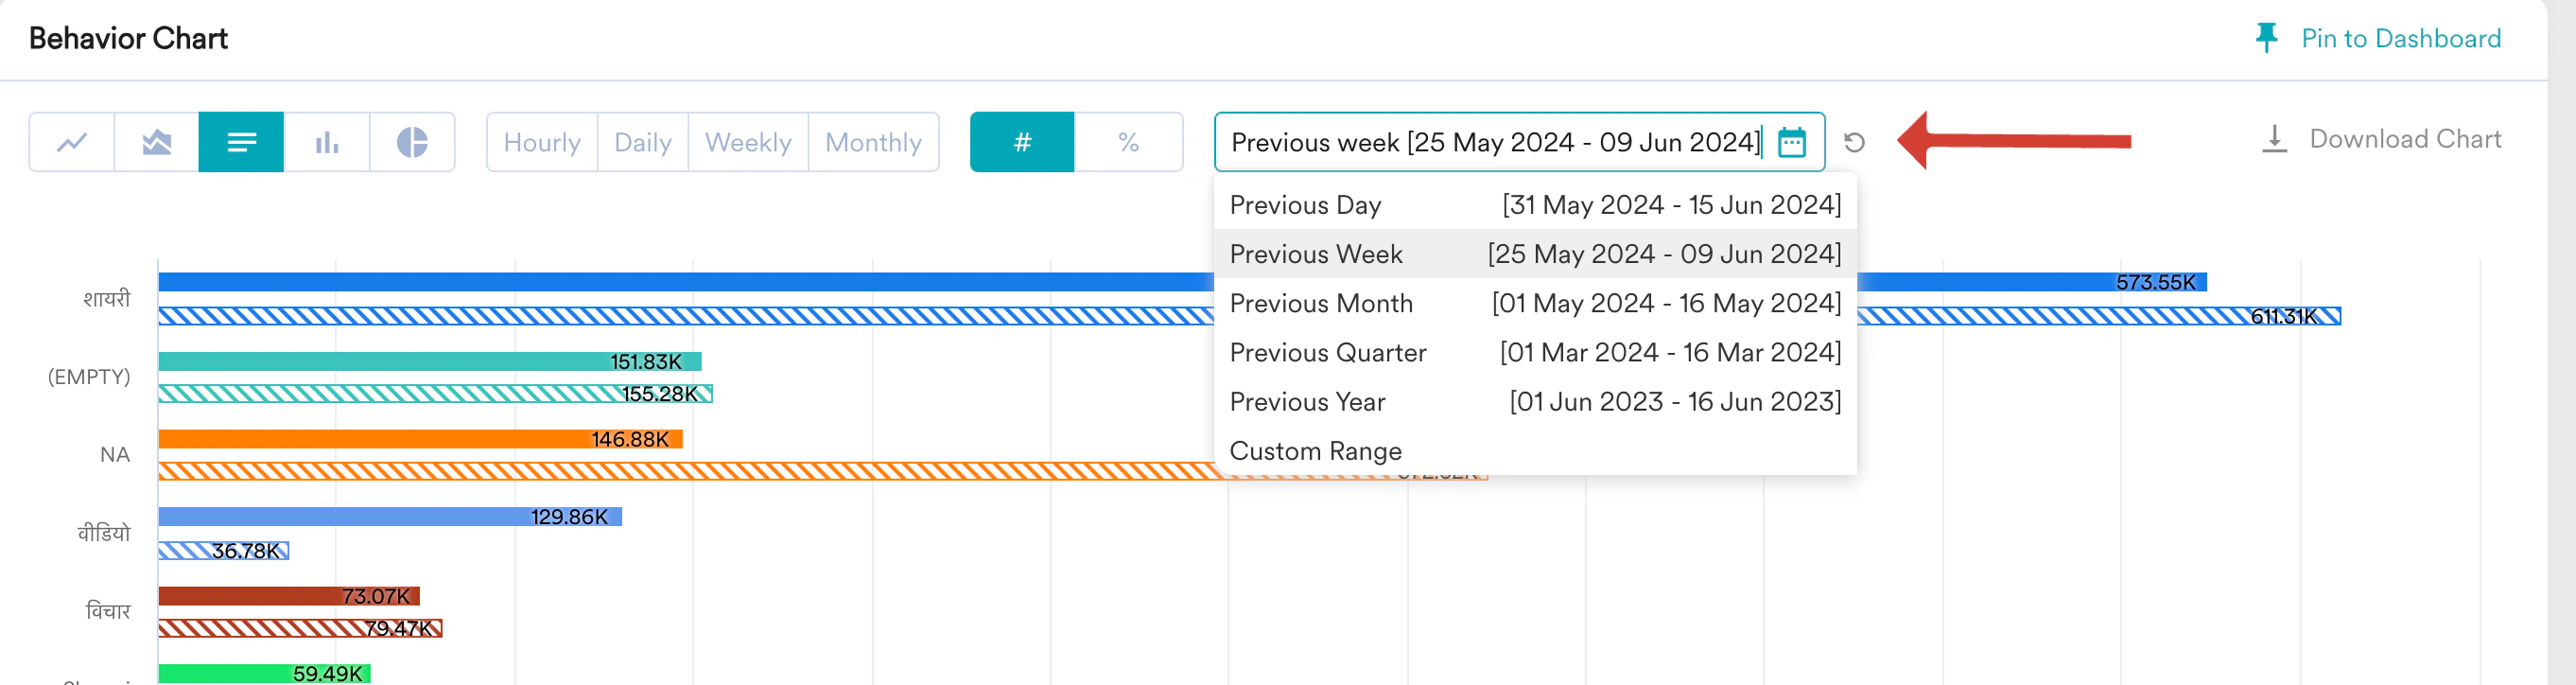 **結果**: アプリやサイト上に存在するさまざまなカテゴリの動画の時系列比較が表示されます。
## リテンションに基づいて比較する
このセクションでは、リテンションに基づいて比較します。
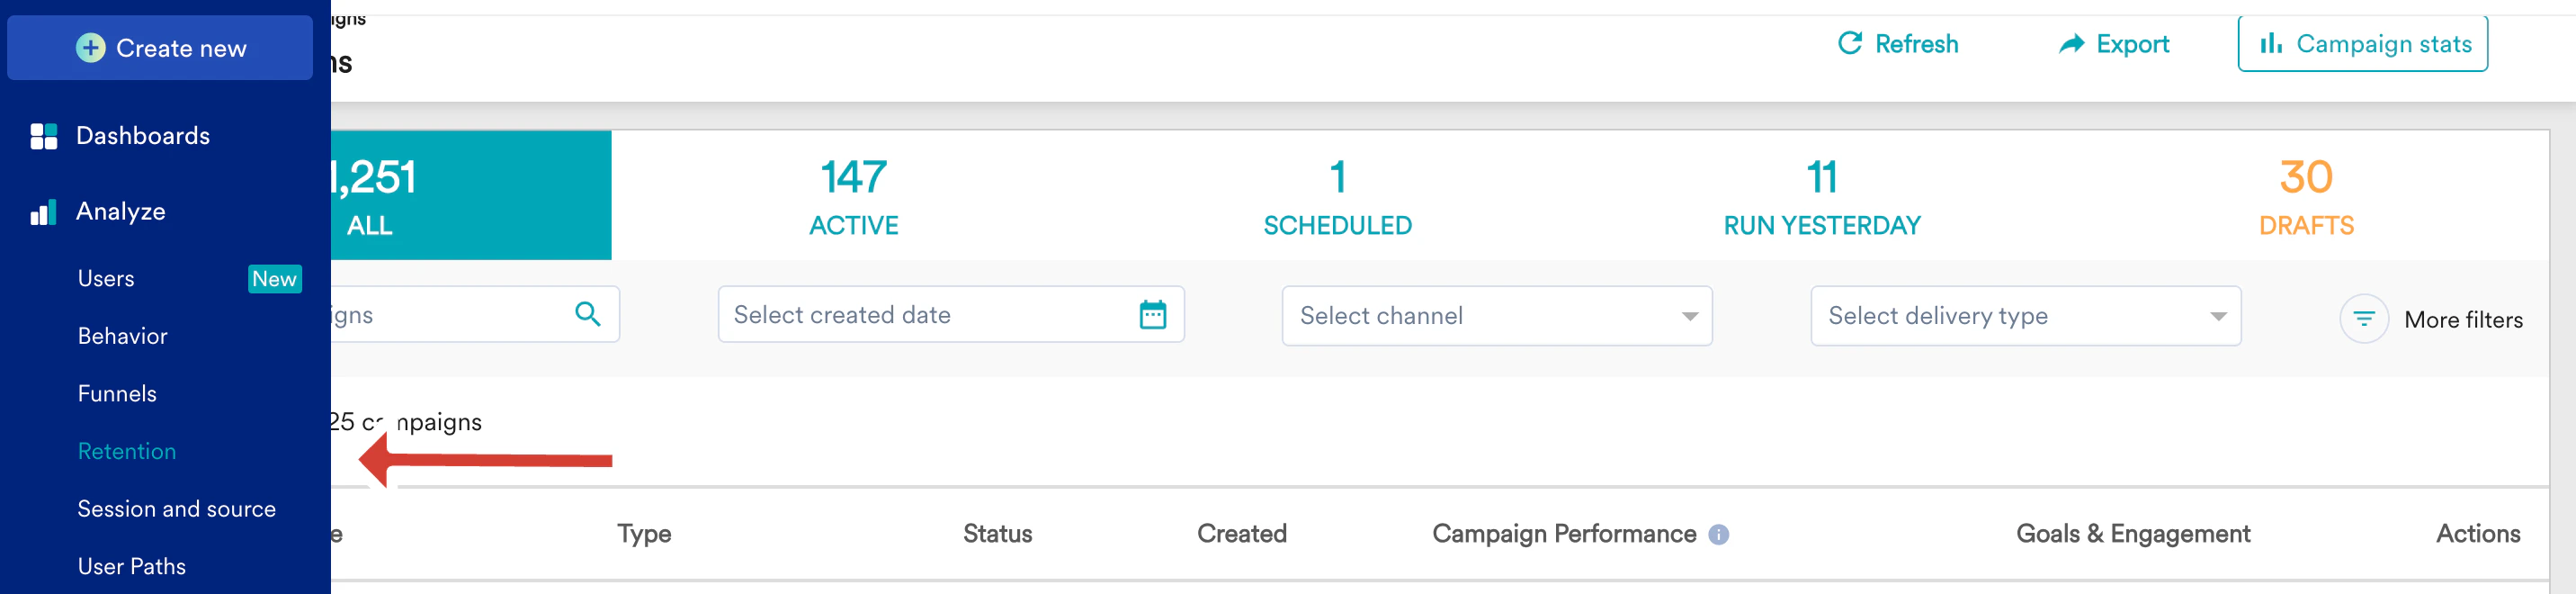
1. MoEngage ダッシュボードで **Analyze** > **Retention** に移動します。
**結果**: アプリやサイト上に存在するさまざまなカテゴリの動画の時系列比較が表示されます。
## リテンションに基づいて比較する
このセクションでは、リテンションに基づいて比較します。
1. MoEngage ダッシュボードで **Analyze** > **Retention** に移動します。
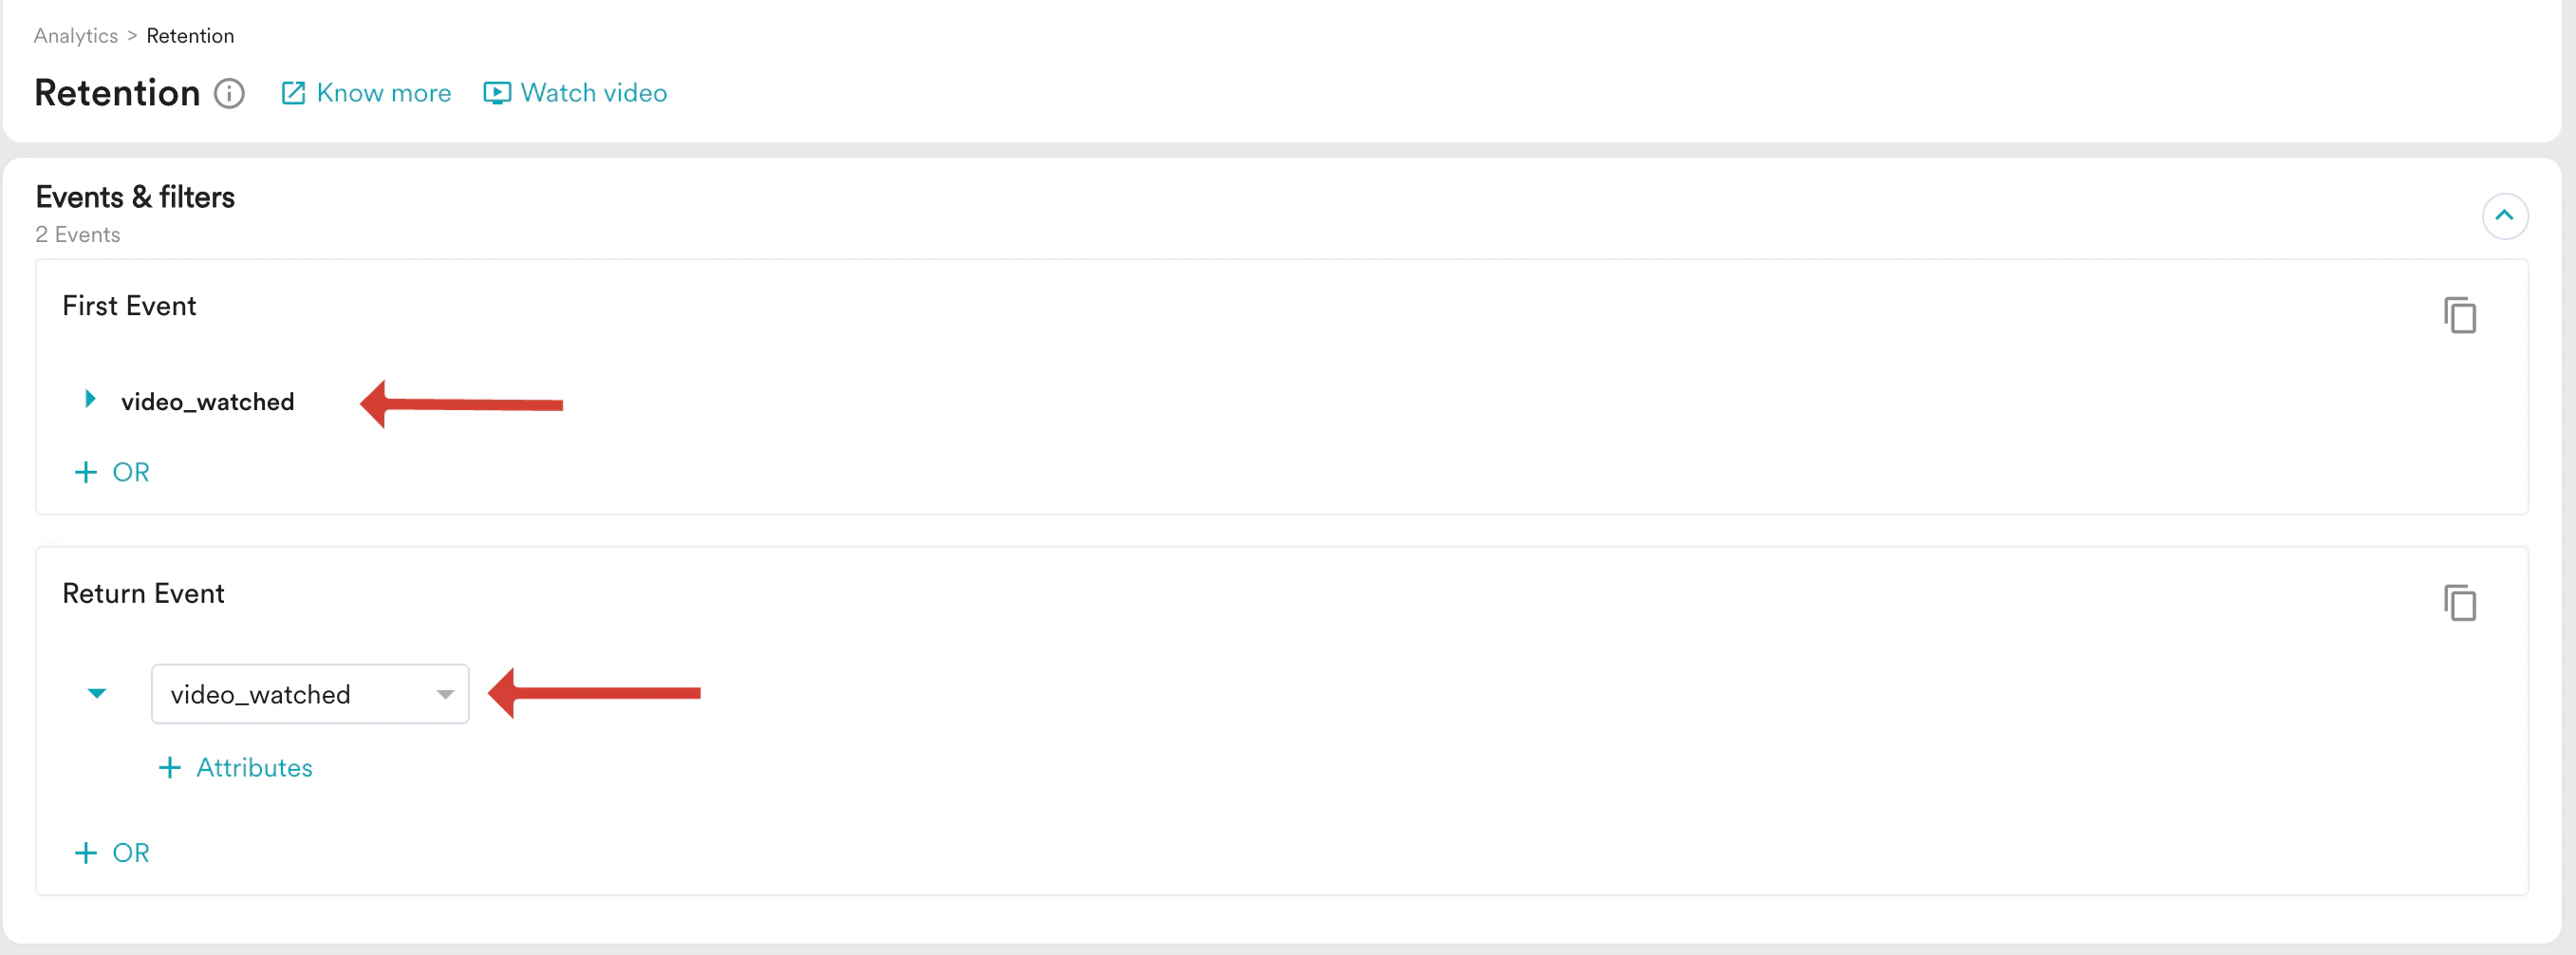
 2. 最初のイベントと再訪イベントを選択します。
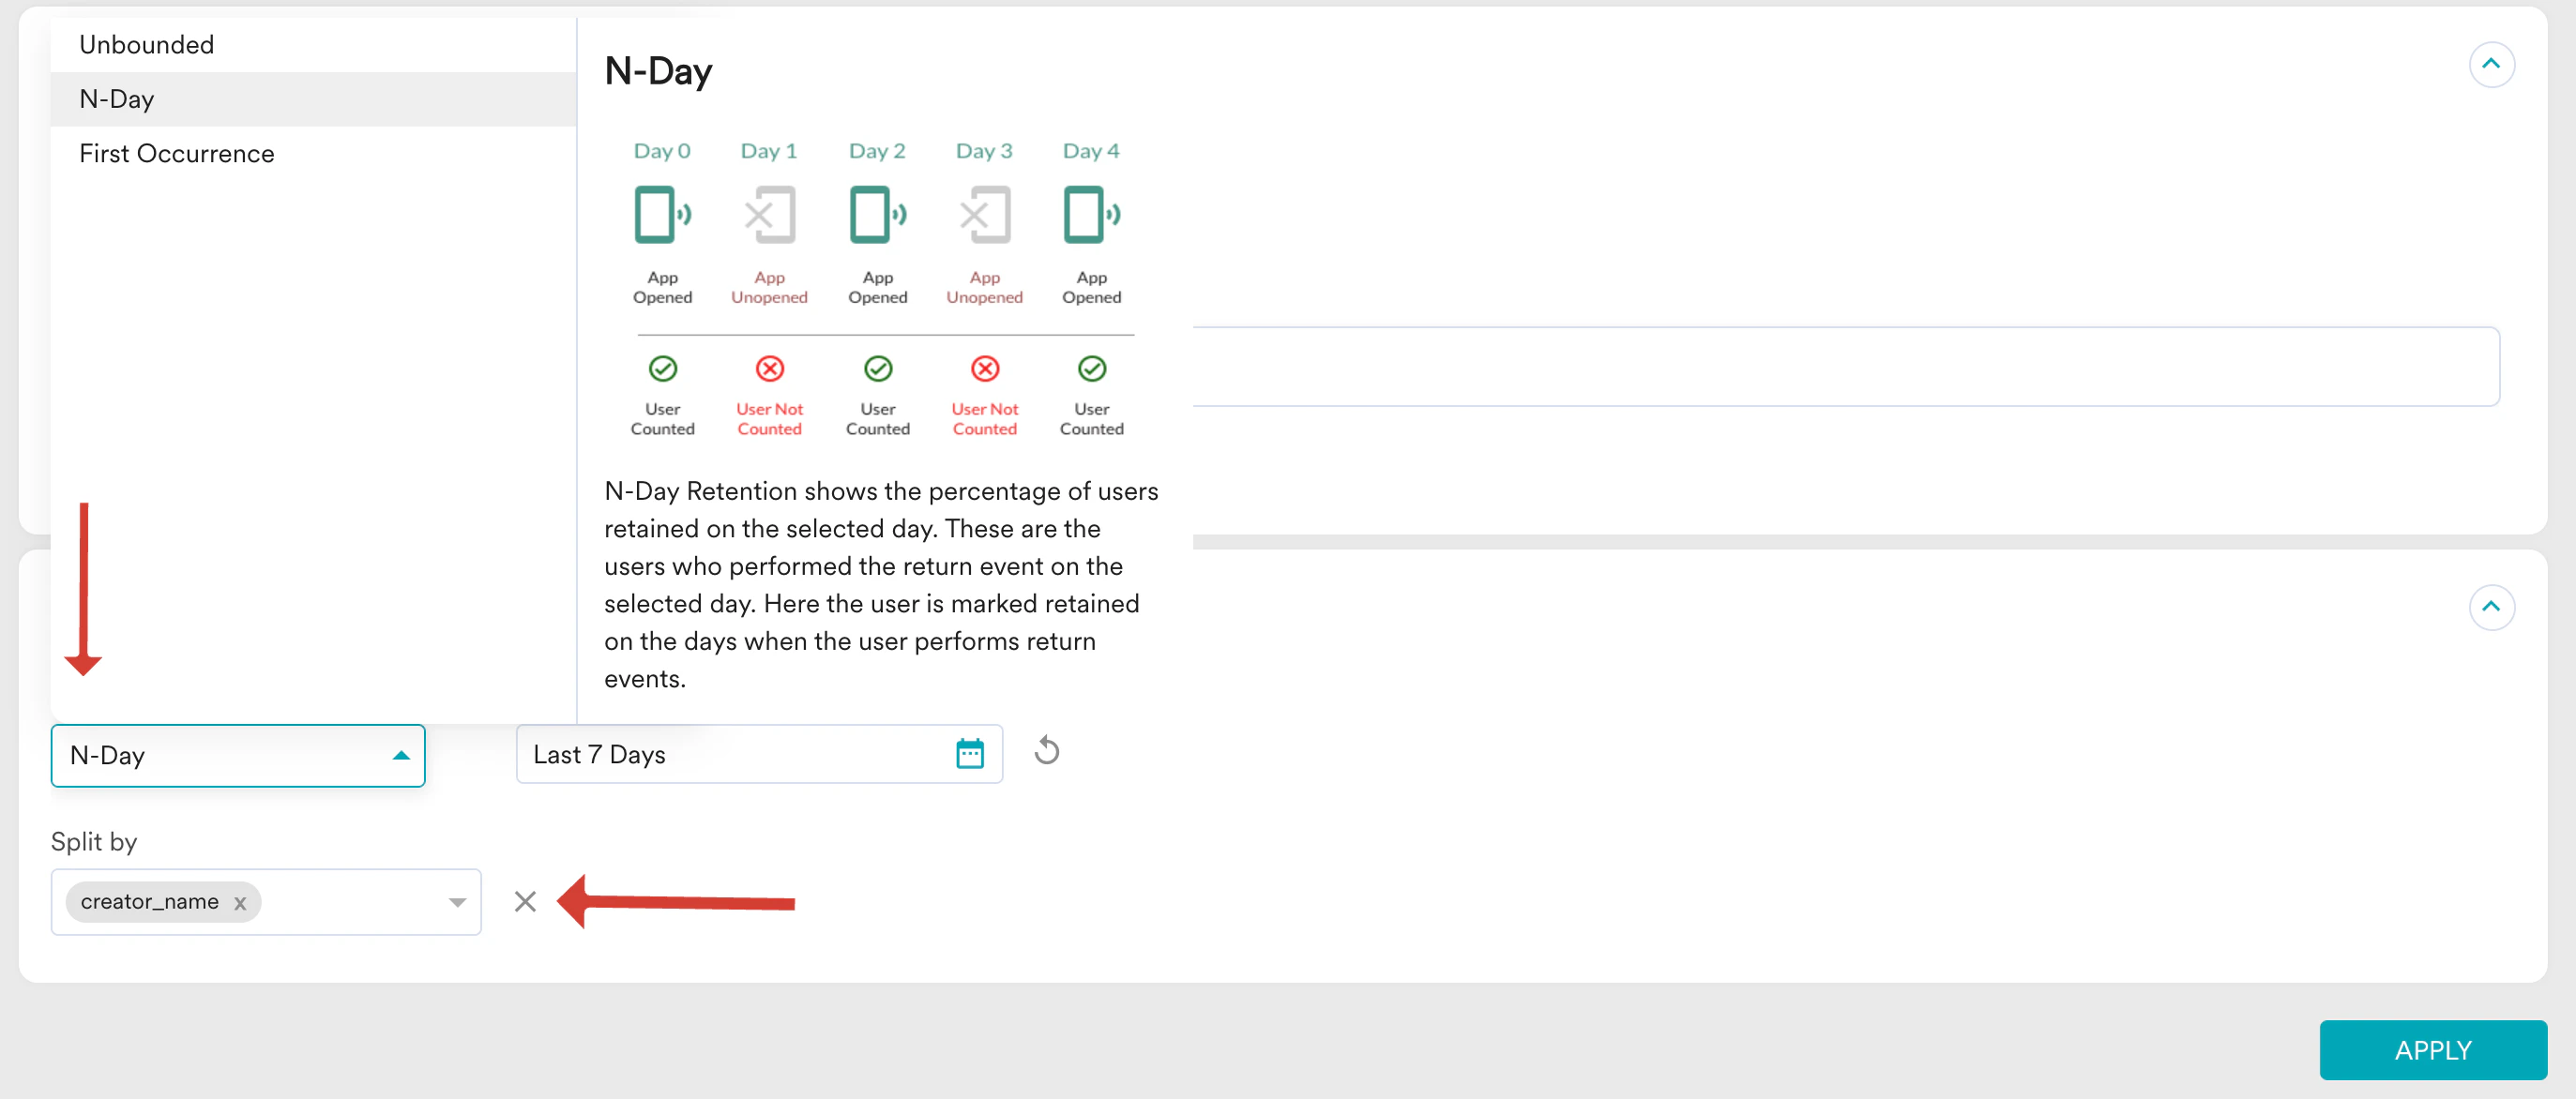
 3. **Retention Options** セクションの **Retention type** ドロップダウンから、リテンションタイプを選択します。
4. **Split by** ドロップダウンリストから、動画クリエイター名で分割します。
5. **Apply** をクリックします。
3. **Retention Options** セクションの **Retention type** ドロップダウンから、リテンションタイプを選択します。
4. **Split by** ドロップダウンリストから、動画クリエイター名で分割します。
5. **Apply** をクリックします。
 **結果**: アプリやサイト上にコンテンツが存在するさまざまな動画クリエイターの動画視聴に関する日次リテンションチャートが表示されます。
# まとめ
このユースケースでは、アプリやサイト上のさまざまなコンテンツの視聴状況を、エンゲージメントとリテンションの観点から分析する方法について説明しました。
このようにして、MoEngage でコンテンツのパフォーマンスをカテゴリ、名前、クリエイターの観点から分析できます。これにより、どのような種類のコンテンツが視聴数を伸ばし、ユーザーリテンションを向上させているかについての意思決定が容易になります。
**結果**: アプリやサイト上にコンテンツが存在するさまざまな動画クリエイターの動画視聴に関する日次リテンションチャートが表示されます。
# まとめ
このユースケースでは、アプリやサイト上のさまざまなコンテンツの視聴状況を、エンゲージメントとリテンションの観点から分析する方法について説明しました。
このようにして、MoEngage でコンテンツのパフォーマンスをカテゴリ、名前、クリエイターの観点から分析できます。これにより、どのような種類のコンテンツが視聴数を伸ばし、ユーザーリテンションを向上させているかについての意思決定が容易になります。