Introduction
Tableau is a powerful data visualization tool renowned for its interactive data visualization capabilities. It allows organizations to view, comprehend, and process large volumes of data in an easy-to-understand, visual manner. Tableau promotes data exploration and understanding, enabling organizations to make data-driven decisions and strategies.MoEngage × Tableau
The integration of MoEngage with Tableau offers a direct and seamless connection between MoEngage user engagement data and your Tableau dashboards. This integration allows you to visualize and understand your user engagement data more effectively and intuitively, enhancing your ability to make data-backed strategic decisions. With the MoEngage and Tableau integration, you can:- Sync user engagement data to your Tableau on a scheduled basis - the syncs can be as frequent as every hour or as infrequent as once per week, depending on the data source.
- Visualize and analyze your user engagement data in Tableau using various interactive charts, graphs, and other visualization tools.
- Use these insights to segment your users more effectively and send personalized campaigns aimed at improving user engagement.
Use Cases
- Performance Tracking and Reporting: Marketers can use the integration to track and analyze the performance of their marketing campaigns and engagement initiatives. Tableau can pull data from MoEngage, consolidate it, and present visual reports and dashboards for easy interpretation.
- Campaign Optimization: The integration can be used to analyze and optimize marketing campaigns. Marketers can track key metrics like click-through rates, open rates, conversions, and revenue generated from each campaign. Tableau can then help visualize these metrics across different channels and campaigns, allowing marketers to identify successful strategies and allocate budgets accordingly.
- Predictive Analytics: By integrating MoEngage and Tableau, marketers can leverage predictive analytics capabilities. Tableau can analyze historical engagement data from MoEngage and use it to predict future customer behavior, enabling marketers to make data-driven decisions and design proactive marketing strategies.
Integration
- You will need access to your Tableau dashboard and have sufficient permissions to add a data source and create reports.
- You will need to enable Data Warehouses Exports for your account.
- Snowflake
- Amazon Redshift
- Google BigQuery
Step 1: Add your preferred data source to Tableau
- Snowflake
- Redshift
- BigQuery
To add Snowflake as a Data Source on Tableau, you can follow the steps mentioned in the Tableau Help Docs. MoEngage will dump all your campaign interaction data as per the schema defined in the Data Exports Glossary.
Step 2: Prepare your data for visualizations
If you wish to do basic campaign data analytics, you can always make use of the event attribute columns that contain all the standard information for creating charts and reports:- event_attributes_campaign_channel
- event_attributes_campaign_id
- event_attributes_readable_campaign_id
- event_attributes_campaign_name
- event_attributes_campaign_type
- event_attributes_parent_campaign_id
- event_attributes_parent_flow_id
- event_attributes_parent_flow_name
- event_attributes_locale_id
- event_attributes_locale_name
- event_attributes_variation_id
- event_attributes_logged_in_status
- event_attributes_platform
- event_attributes_first_session
Extracting attributes as separate columns
Tableau does not have native support for changing JSON structures and hence it is recommended to extract the attributes required for computation to make the computation faster. This can be done by creating a view on top of the tables created by MoEngage. Below is an example for a few attributes, but the same can be extended to any of your use cases:Snowflake
Snowflake
To create a view in Snowflake, you can use the following command as a base:
Redshift
Redshift
To create a view in Redshift, you can use the following command as a base:
BigQuery
BigQuery
To create a view in BigQuery, you can use the following command as a base:
Step 3: Load the data inside Tableau
After creating various views to analyze necessary events, you have the ability to load these views as a new data source within Tableau:Snowflake
Snowflake
To connect your Snowflake database to Tableau:
-
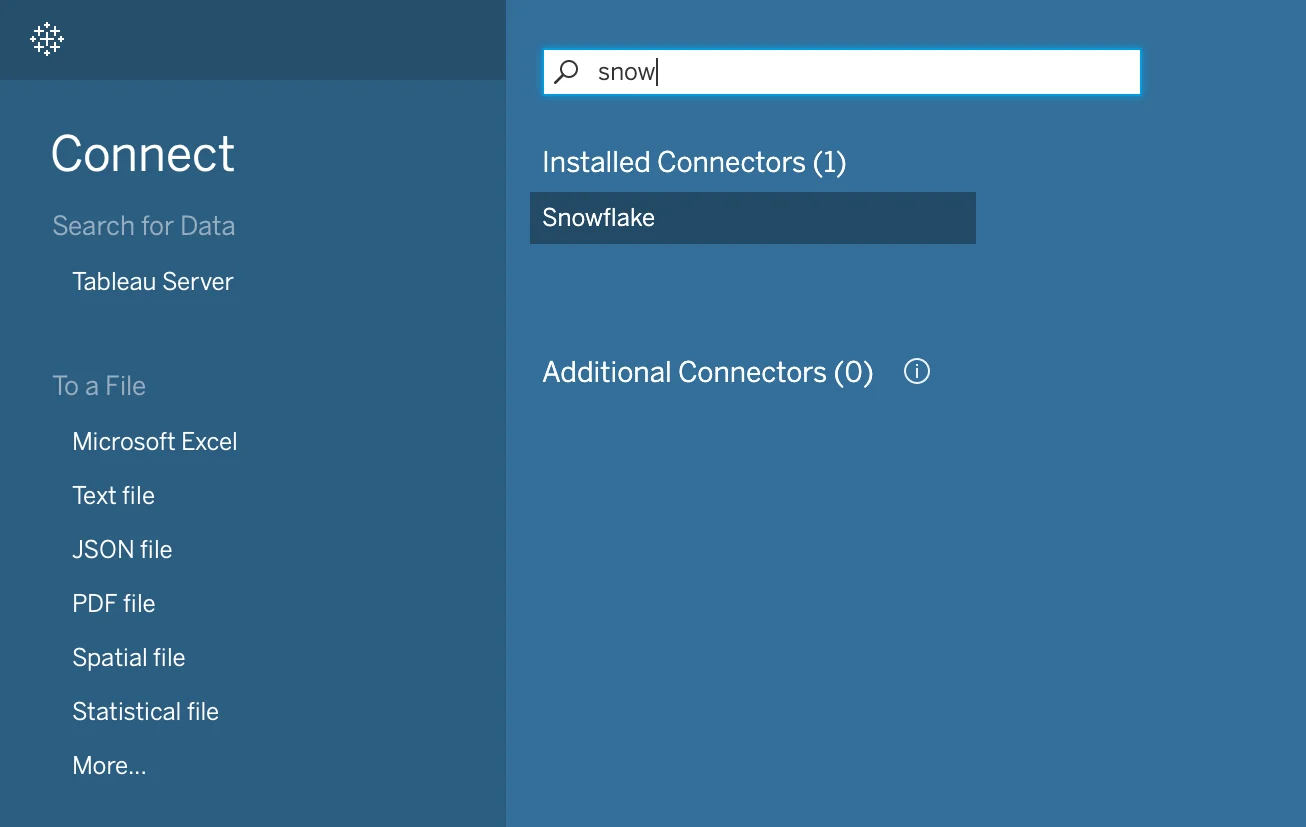
Open Tableau Desktop, and under Connect, select Snowflake.
-
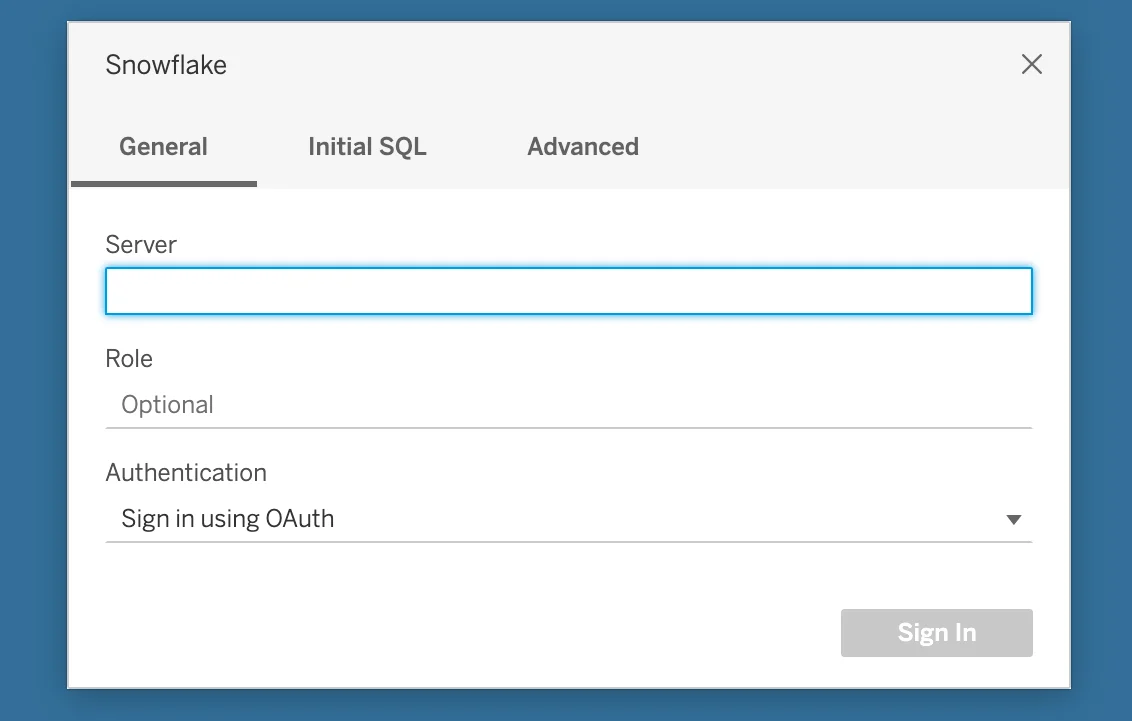
Fill in your connection details and click “Sign In”. Tableau supports signing in a username and password, Okta username and password, or by signing in using OAuth. You can also add advanced configurations like SQL statements to fire after connecting:
-
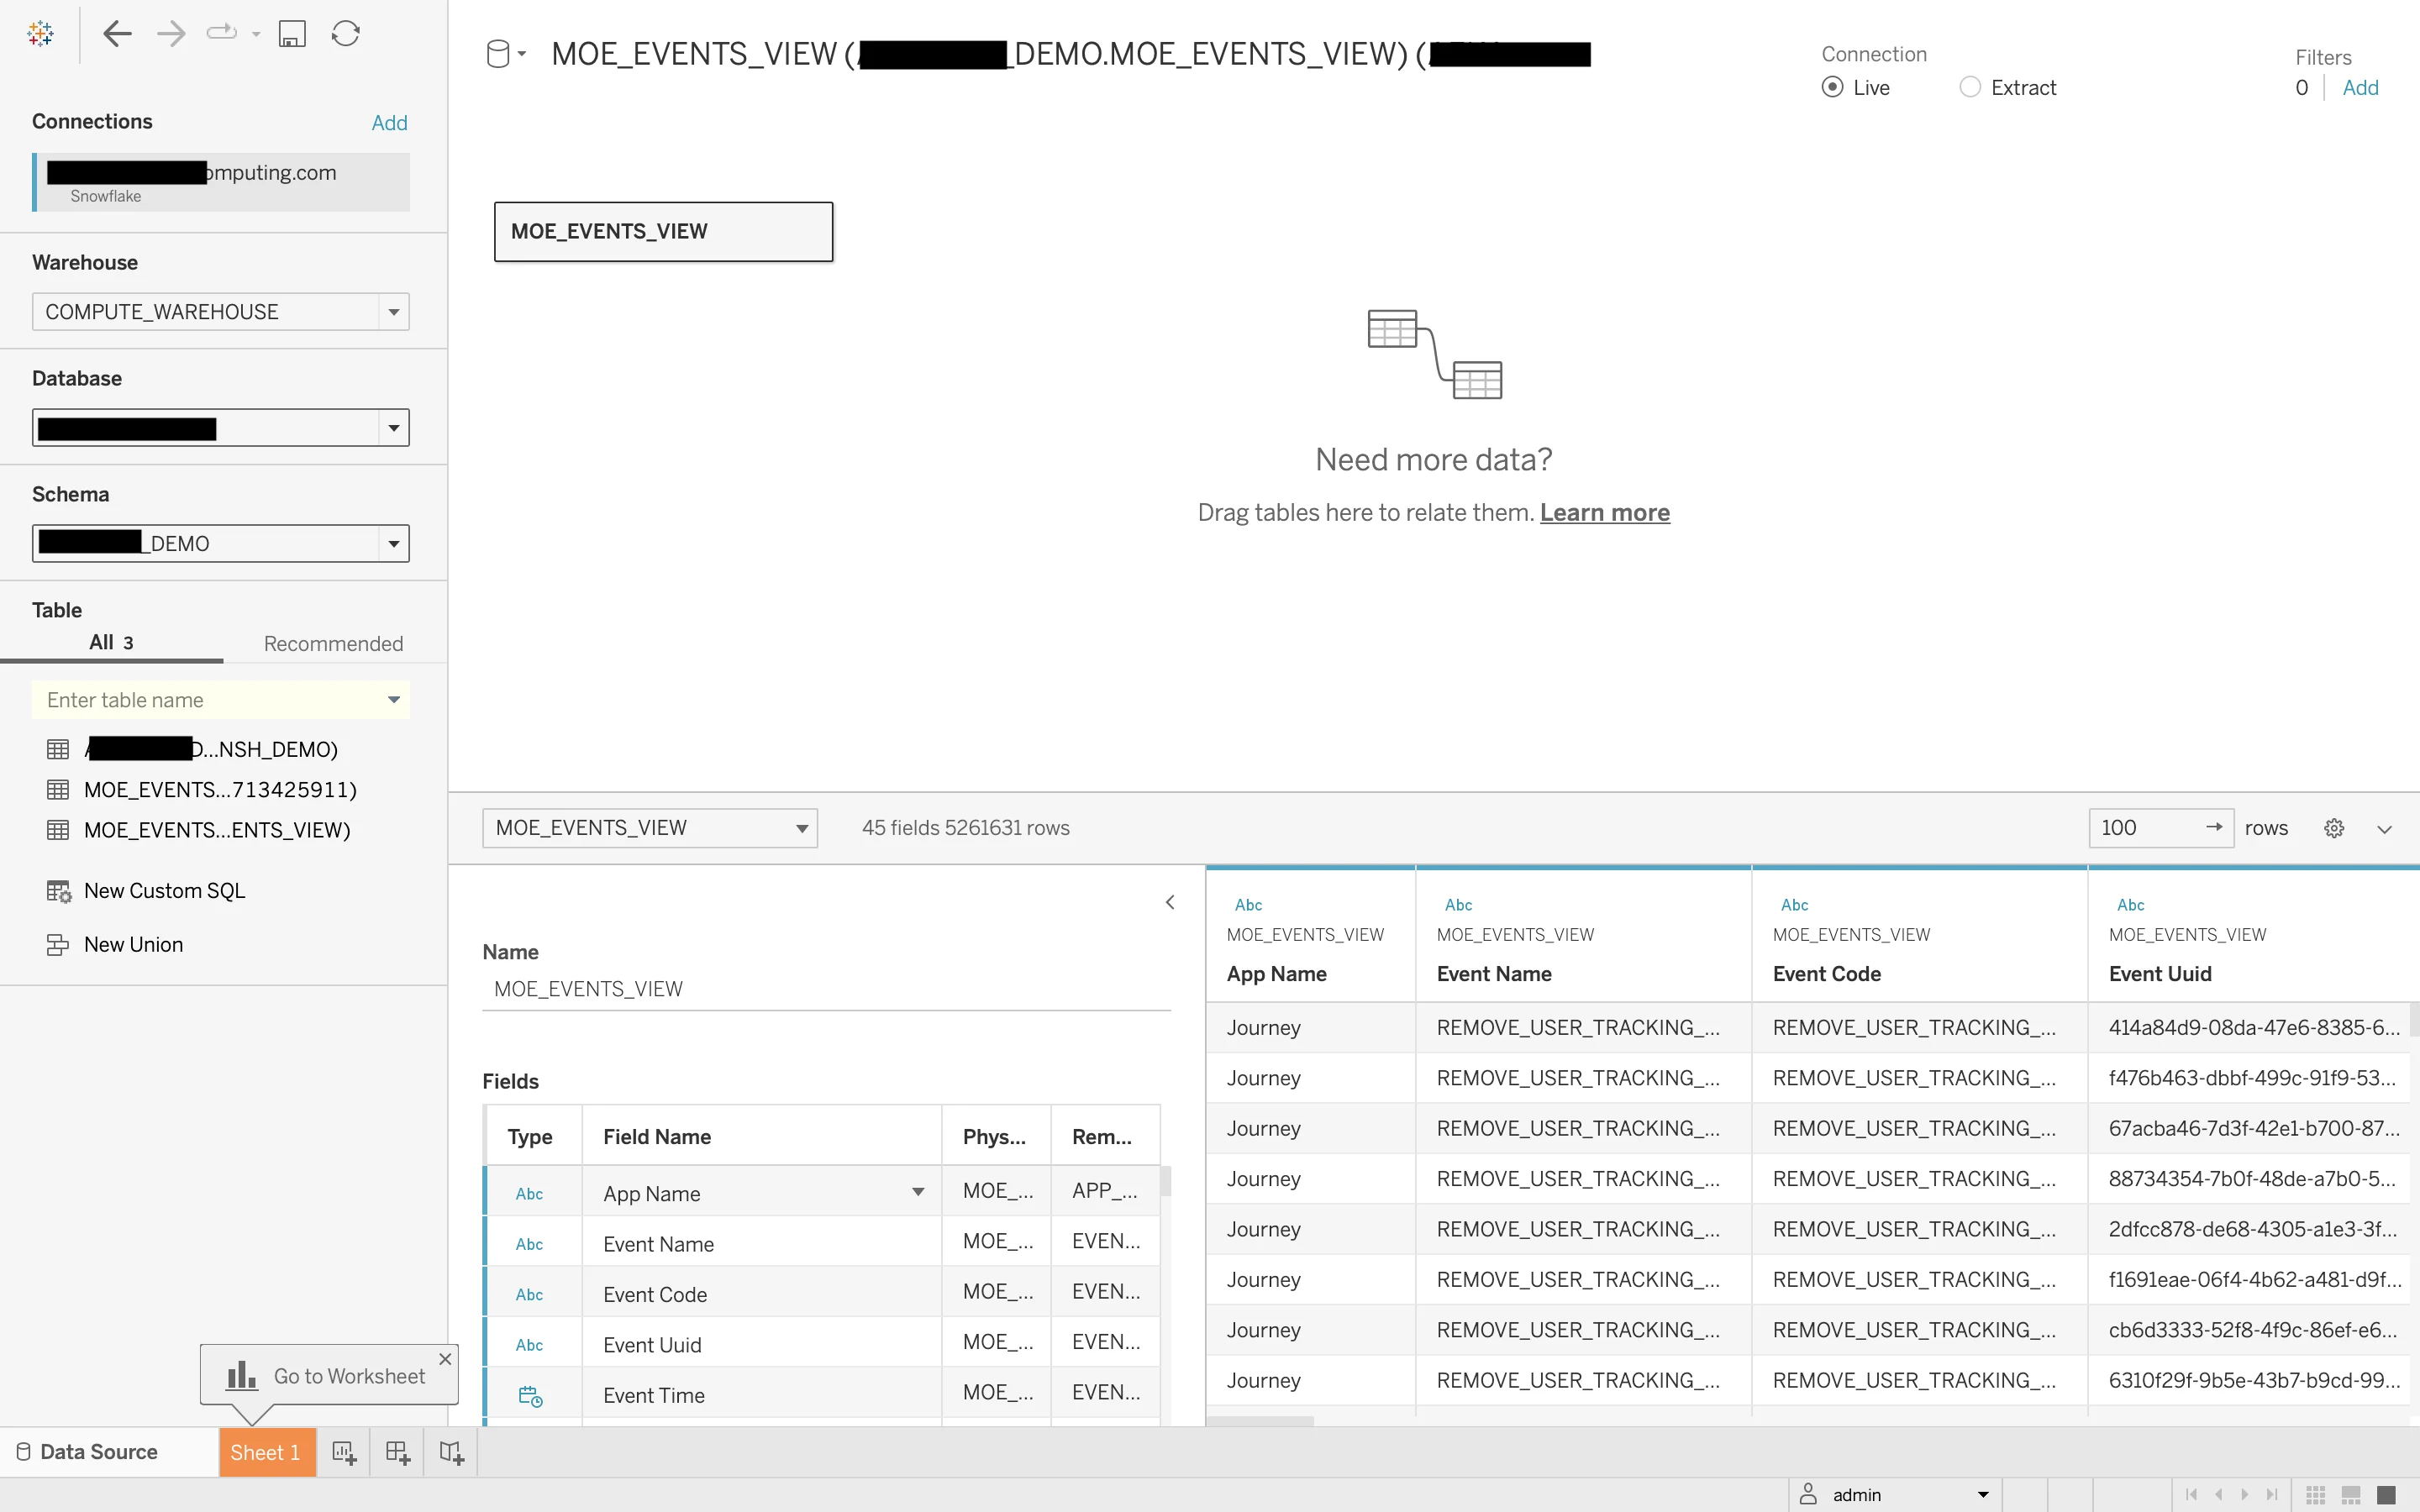
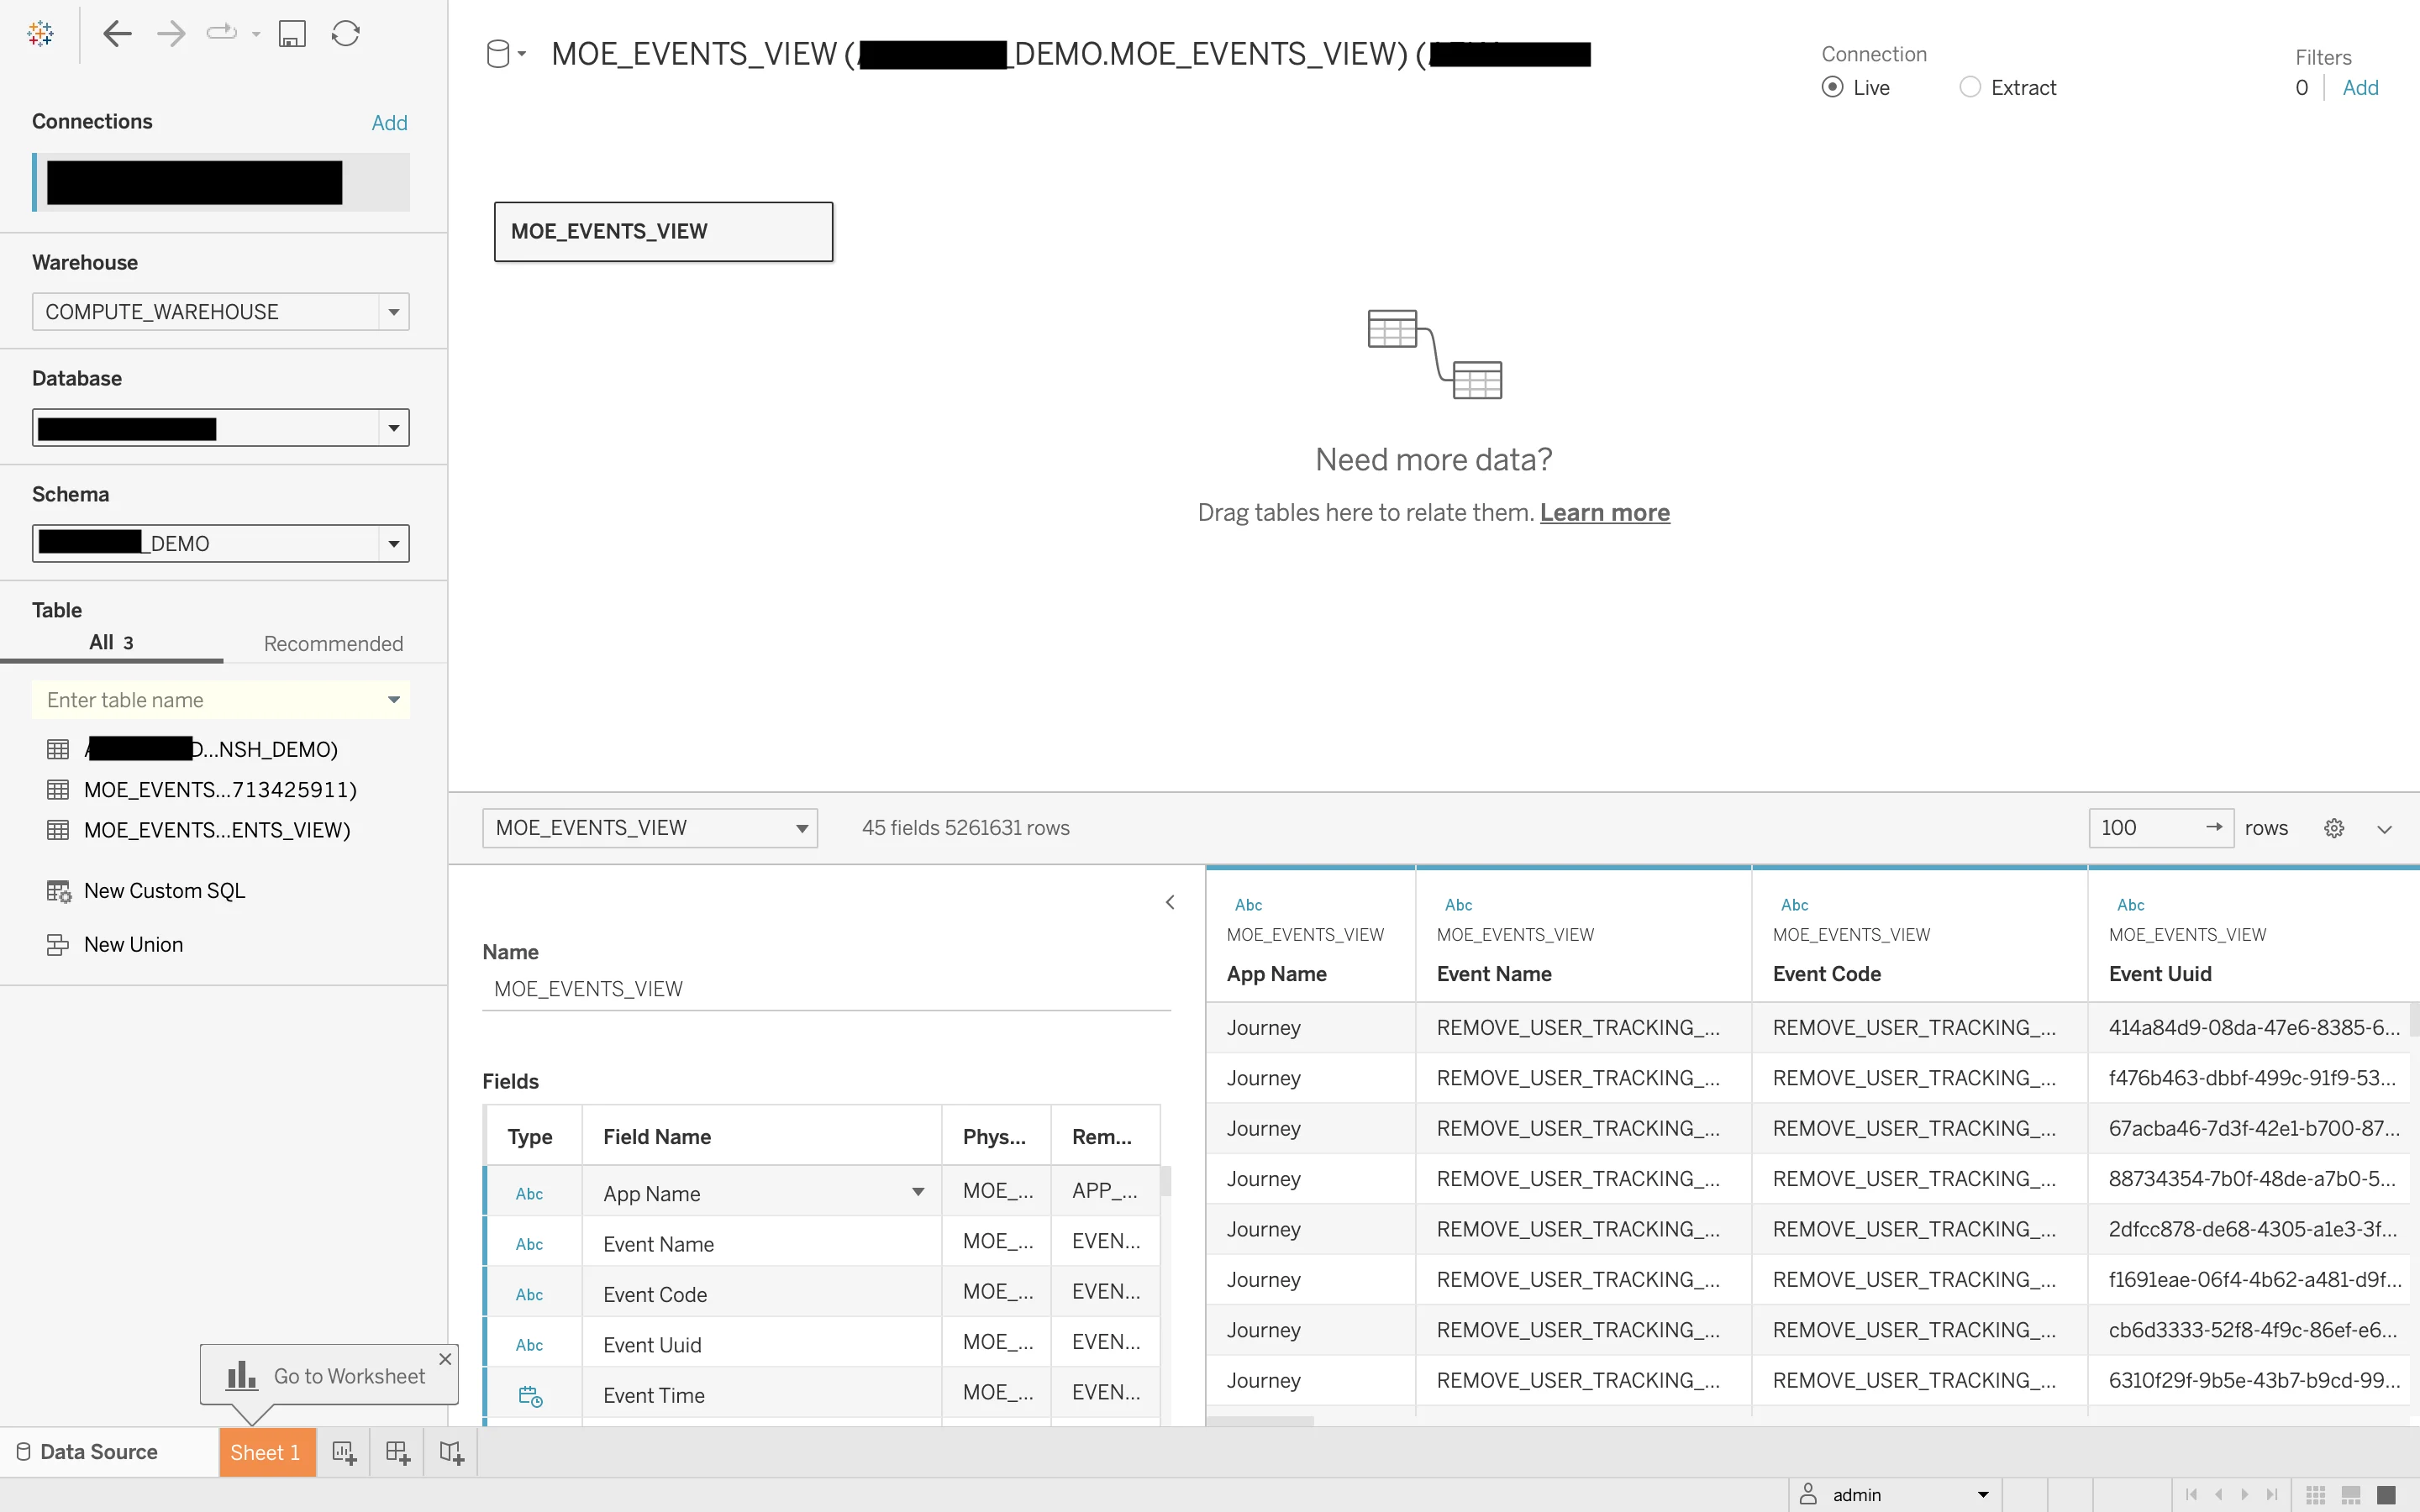
You will now be taken to the Data Source page, wherein you can select all the tables/views you want to import. Start with selecting your Warehouse, Database and Schema. For example, we will load the view that we created from the MoEngage Exports table.
- [Optional] If you wish to transform your data, you can do so by adding more tables or views to create relations between then and add/remove columns as well. For large datasets or certain operations, you might have to select the “Extract” connection method. Once you’re done, you can Save the Data Source page.
- Your data should now be available to use inside Tableau for powerful visualizations and reports.
Redshift
Redshift
To connect your Redshift database to Tableau:
-
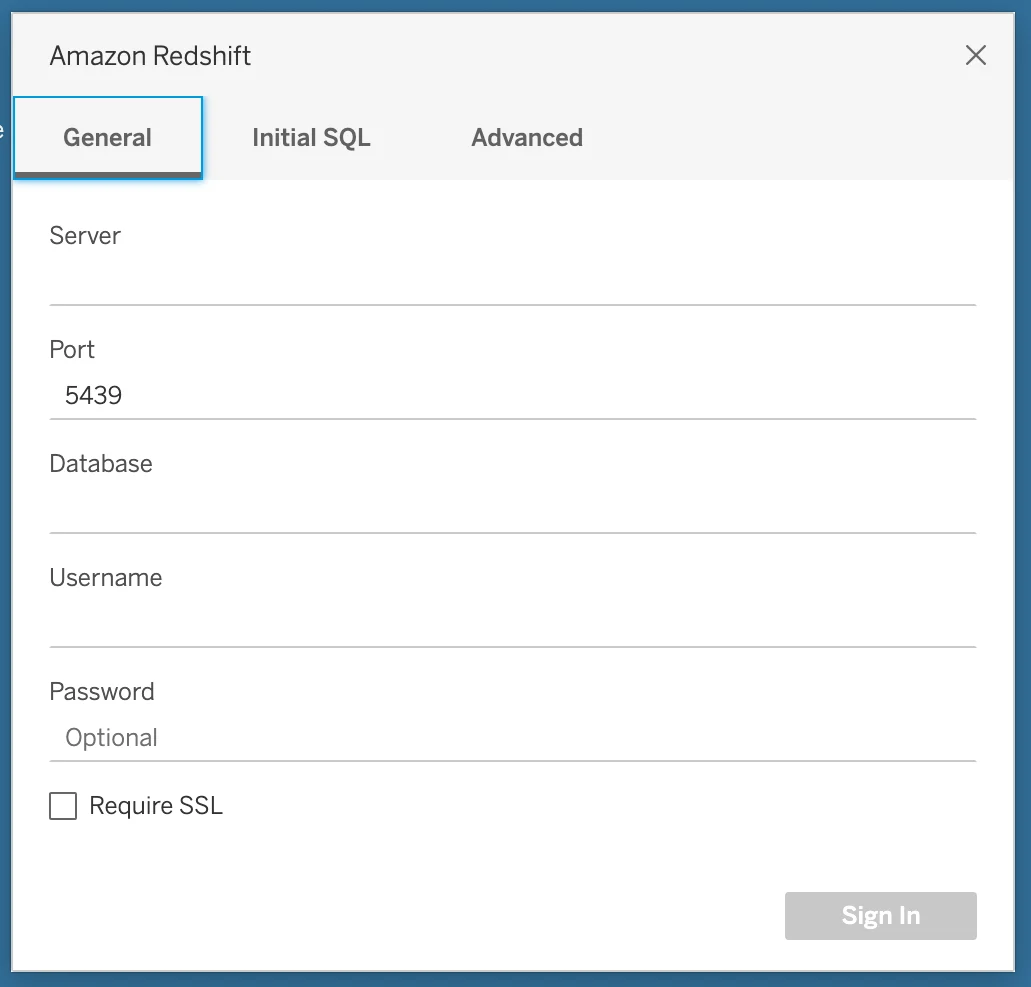
Open Tableau Desktop, and under Connect, select Redshift.
-
Fill in your connection details and click “Sign In”. You can also add advanced configurations like SQL statements to fire after connecting:
-
You will now be taken to the Data Source page, wherein you can select all the tables/views you want to import. Start with selecting your Warehouse, Database and Schema. For example, we will load the view that we created from the MoEngage Exports table.
- [Optional] If you wish to transform your data, you can do so by adding more tables or views to create relations between then and add/remove columns as well. For large datasets or certain operations, you might have to select the “Extract” connection method. Once you’re done, you can Save the Data Source page.
- Your data should now be available to use inside Tableau for powerful visualizations and reports.
BigQuery
BigQuery
To connect your BigQuery database to Tableau:
- Open Tableau Desktop, and under Connect, select BigQuery.
-
Fill in your connection details and click “OK”. You can also add advanced configurations like SQL statements to fire after connecting:
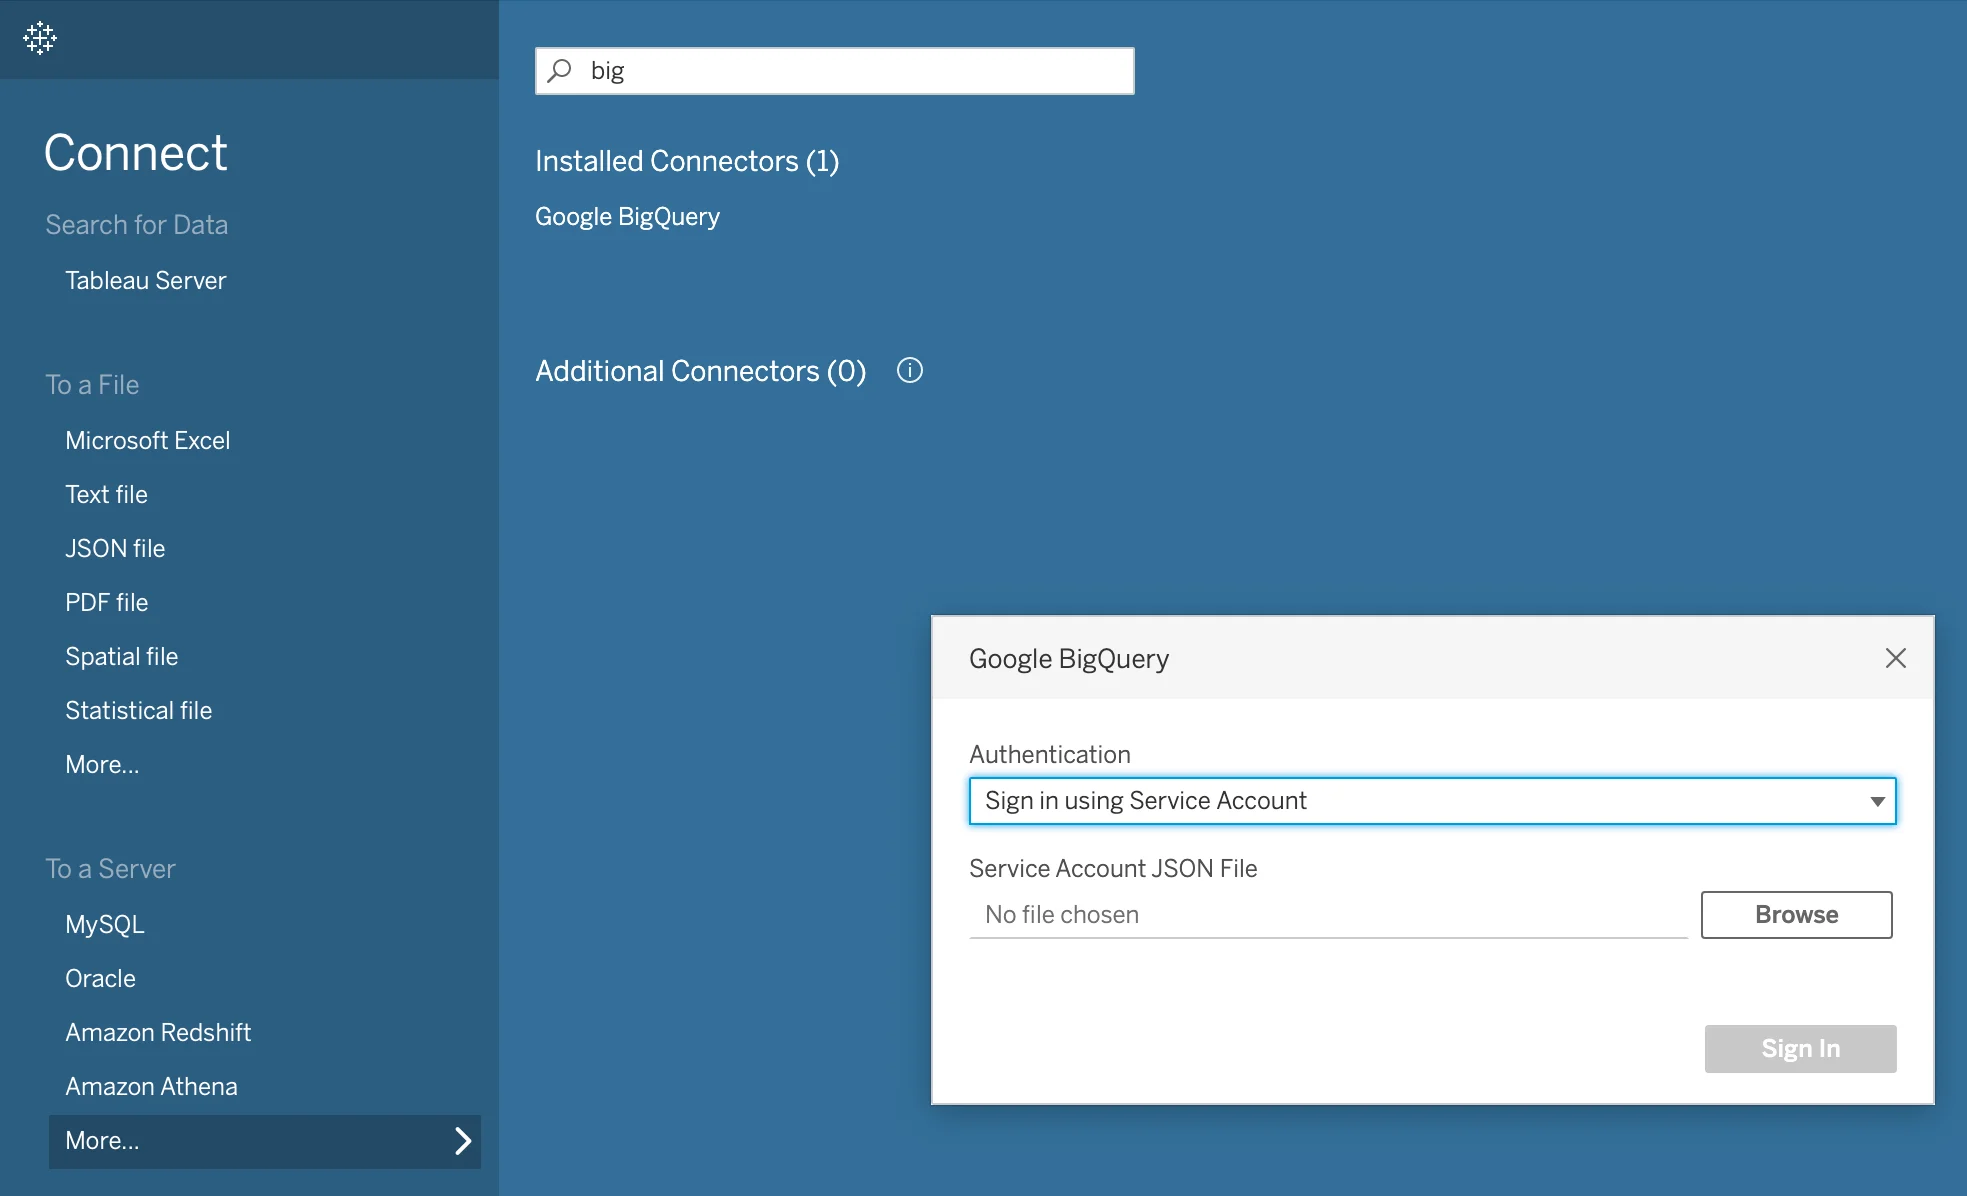
- The Google BigQuery connector supports connecting through OAuth or a service account sign-in. When connecting via a Service Account, you will need to upload the service account credentials file. Then select Sign In.
-
You will now be taken to the Data Source page, wherein you can select all the tables/views you want to import. Start with selecting your Warehouse, Database and Schema. For example, we will load the view that we created from the MoEngage Exports table.

- [Optional] If you wish to transform your data, you can do so by adding more tables or views to create relations between then and add/remove columns as well. For large datasets or certain operations, you might have to select the “Extract” connection method. Once you’re done, you can Save the Data Source page.
- Your data should now be available to use inside Tableau for powerful visualizations and reports.
Examples use cases
With Tableau, you can create a dashboard with metrics such as Daily Active Users count, Monthly Active Users count, Daily New Users, Daily Uninstalled Users, etc. Below are some examples to get you started -- User Activity Monitoring: This report can showcase how frequently users engage with the app. Events such as “App/Site Open”, “App Exit” can inform daily or monthly user activity. This might include metrics such as Daily Active Users (DAU), Monthly Active Users (MAU), and session duration.
- User Engagement Tracking: Events like “Notification Clicked Android”, “Notification Clicked iOS”, or “Notification Clicked Web” can be used to track user engagement on different platforms.
- Campaign Performance Analysis: For email-specific campaigns, you could use the events such as “Email Sent”, “Email Opened”, “Email Clicked”, “Email Bounced”, “Email Complained” and “Email Unsubscribed”. These would provide insights into aspects such as email delivery success rate, open rate, click-through rate, bounce rate, complaint rate, and unsubscribe rate. This information can be used to gauge the efficacy of your email campaigns and identify areas for improvement.
- User acquisition and churn report: Using “Install”, “ReInstall”, “Device Uninstall” and “User ReInstall” events, create a report to monitor user acquisition and churn rate. You can break it down based on various dimensions such as geographical location, device type, and so on.
- Behavior Flow Analysis: With events such as “App/Site Opened”, “Notification Clicked” (or “Card Clicked”), and a custom event of “Added to Cart” event, you’re able to track key user actions within a typical purchase funnel. This can allow you to visualize the user’s journey from opening the app, interacting with a promotional notification or in-app message, and adding an item to their shopping cart.