> ## Documentation Index
> Fetch the complete documentation index at: https://moengage.com/docs/llms.txt
> Use this file to discover all available pages before exploring further.
# Explore the Number of Notifications Received by Users
> Analyze how many notifications your users receive to find the right sending frequency that drives engagement without causing uninstalls.
Growth teams are always on top of the communication that they send to their customers. They need to know if they are sending too few or too many push notifications or emails.
You know the importance of push notifications in marketing. And you know how important it is that users get the notifications you send. So it’s super critical to keep an eye on the number of notifications received by them. The right number of notifications can boost engagement for your app, but too many of them can drive users to uninstall the app. You should analyze notification frequency regularly to prevent this from happening.
Using MoEngage Analytics, you can easily find out how many of your users are receiving notifications and how many notifications. Here’s how:
## Overall Distribution
1. Go to **Analytics** **>** **Behaviour**.
2. Select **Notification Received Android** as an event.
3. Select **Total events per user** as the *Analysis type* and **Distribution** as *Aggregation type* in *Behavior Options* and click on **Apply** button.
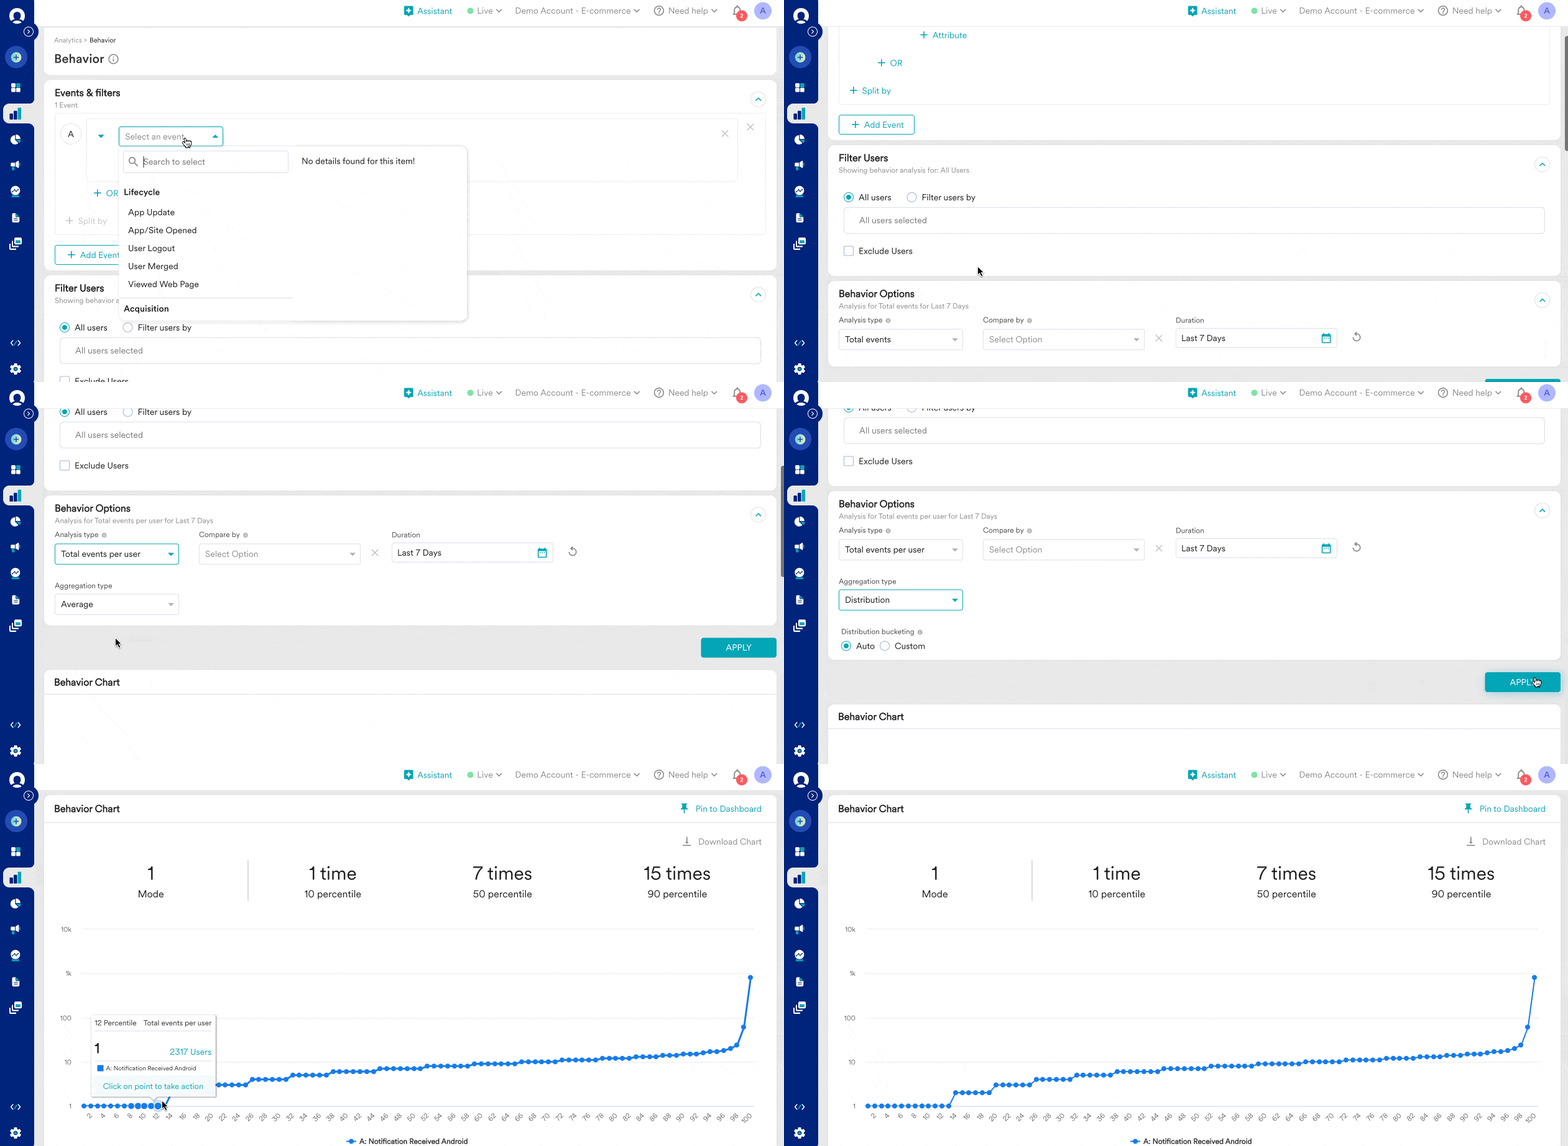 This analysis plots percentile users against the number of times they have received the notification. E.g. bottom 10 percentile users receive 1 notification, 50th percentile users receive 7 notifications and 90th percentile users receive 15 notifications in the last 7 days.
## Custom Distribution
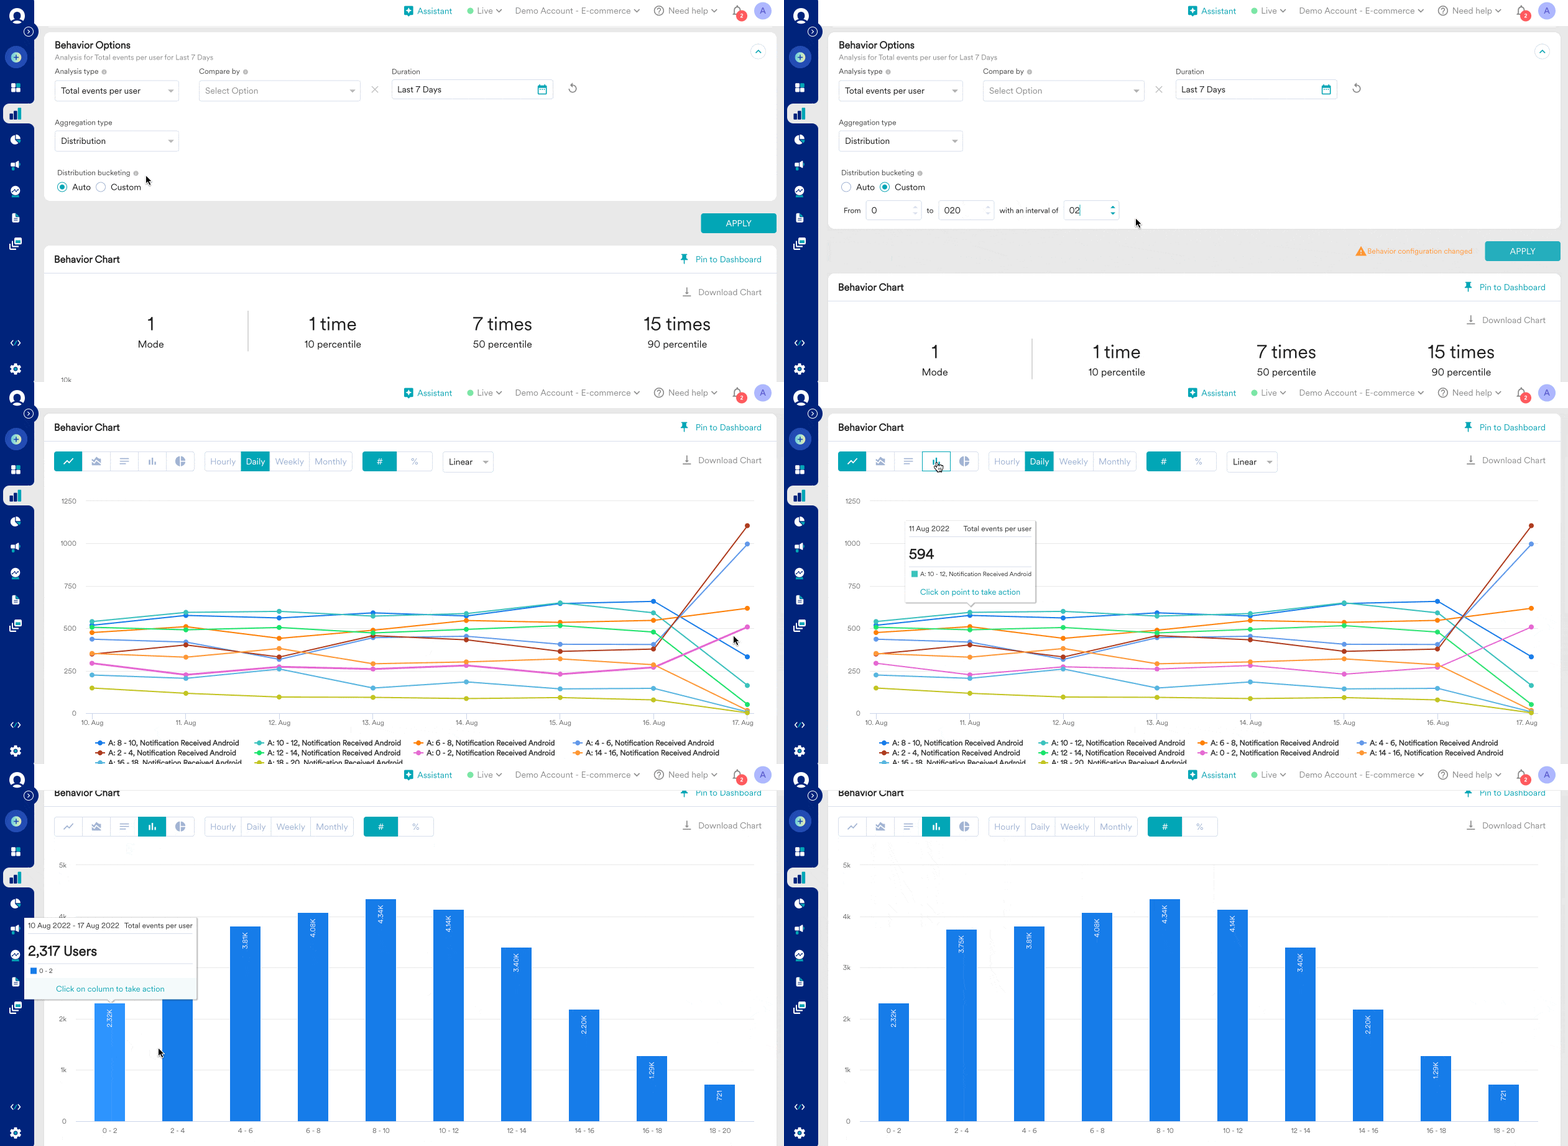
You can modify the distribution bucket based on your desired analysis and see how many users are receiving too many notifications or a specific number of notifications.
You can see the user count for the selected bucket at the hourly, daily, weekly, or monthly level or you can see the user count for the selected bucket for the entire time duration.
This analysis plots percentile users against the number of times they have received the notification. E.g. bottom 10 percentile users receive 1 notification, 50th percentile users receive 7 notifications and 90th percentile users receive 15 notifications in the last 7 days.
## Custom Distribution
You can modify the distribution bucket based on your desired analysis and see how many users are receiving too many notifications or a specific number of notifications.
You can see the user count for the selected bucket at the hourly, daily, weekly, or monthly level or you can see the user count for the selected bucket for the entire time duration.
 The ideal number of notifications to be sent to users varies with the industry and also for the app content/services. Growth marketers would want to analyze:
1. Users receive more notifications and whether they are uninstalling.
2. Users receive fewer notifications and whether they are engaging enough.
3. Users receive an average number of notifications and whether they are converting.
With this analysis, you can take the necessary steps to control the number of notifications and optimize for these metrics and the overall user experience.
Similarly, you can analyze the frequency to answer other questions like:
1. How many times do users open the app?
2. How many users are repeat buyers?
3. How many users open the app or buy too infrequently?
4. What was the highest number of purchases per user for last month?
The ideal number of notifications to be sent to users varies with the industry and also for the app content/services. Growth marketers would want to analyze:
1. Users receive more notifications and whether they are uninstalling.
2. Users receive fewer notifications and whether they are engaging enough.
3. Users receive an average number of notifications and whether they are converting.
With this analysis, you can take the necessary steps to control the number of notifications and optimize for these metrics and the overall user experience.
Similarly, you can analyze the frequency to answer other questions like:
1. How many times do users open the app?
2. How many users are repeat buyers?
3. How many users open the app or buy too infrequently?
4. What was the highest number of purchases per user for last month?