> ## Documentation Index
> Fetch the complete documentation index at: https://moengage.com/docs/llms.txt
> Use this file to discover all available pages before exploring further.
# Uninstall
> Visualize app and website uninstall trends in MoEngage — compare device-level uninstall events against unique user-level uninstall counts.
Uninstalls analytics visualizes the uninstalls event or users who uninstall the app or website.
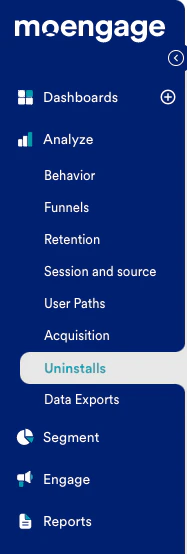
To view the uninstalls analytics, navigate to MoEngage Dashboard > Analyze > Uninstalls
 Two types of uninstall analytics are enabled:
**Uninstall Events**: Focuses on the device uninstall events.
**User Uninstalls**: Focuses on unique users who uninstalled the app.
Two types of uninstall analytics are enabled:
**Uninstall Events**: Focuses on the device uninstall events.
**User Uninstalls**: Focuses on unique users who uninstalled the app.
 Ensure that you have configured the Uninstall Settings for your app for the uninstall analytics to be available. For more information, refer to [Uninstall Settings](/user-guide/analyze/faqs-analyze/uninstall-tracking).
# User Uninstalls and Uninstall Events Difference
The User Uninstalls provide the number of unique users who uninstalled the app. If a user has the app on multiple devices, then the user is counted in User Uninstalls only when the user uninstalls the app from all the devices. As the analytics is at the user level, the filter on user attributes like city, country, number of sessions, and so on is possible.
Uninstall Events provides the number of times the app is uninstalled. If a user uninstalls, re-installs, and uninstalls the app again, both the uninstall actions are displayed in the Uninstall Events tab. As the analytics is based on user actions on a device, the filter on device attributes like OS version, device model, and so on is possible.
# User Uninstalls
User Uninstalls analytics provides deeper insights into which users are uninstalling your app with day-level accuracy.
Two types of user uninstall visualization are available:
* User Uninstalls By Time
* User Uninstalls By Attribute
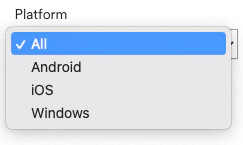
You can filter these statistics by:
**Platform Type**
Ensure that you have configured the Uninstall Settings for your app for the uninstall analytics to be available. For more information, refer to [Uninstall Settings](/user-guide/analyze/faqs-analyze/uninstall-tracking).
# User Uninstalls and Uninstall Events Difference
The User Uninstalls provide the number of unique users who uninstalled the app. If a user has the app on multiple devices, then the user is counted in User Uninstalls only when the user uninstalls the app from all the devices. As the analytics is at the user level, the filter on user attributes like city, country, number of sessions, and so on is possible.
Uninstall Events provides the number of times the app is uninstalled. If a user uninstalls, re-installs, and uninstalls the app again, both the uninstall actions are displayed in the Uninstall Events tab. As the analytics is based on user actions on a device, the filter on device attributes like OS version, device model, and so on is possible.
# User Uninstalls
User Uninstalls analytics provides deeper insights into which users are uninstalling your app with day-level accuracy.
Two types of user uninstall visualization are available:
* User Uninstalls By Time
* User Uninstalls By Attribute
You can filter these statistics by:
**Platform Type**
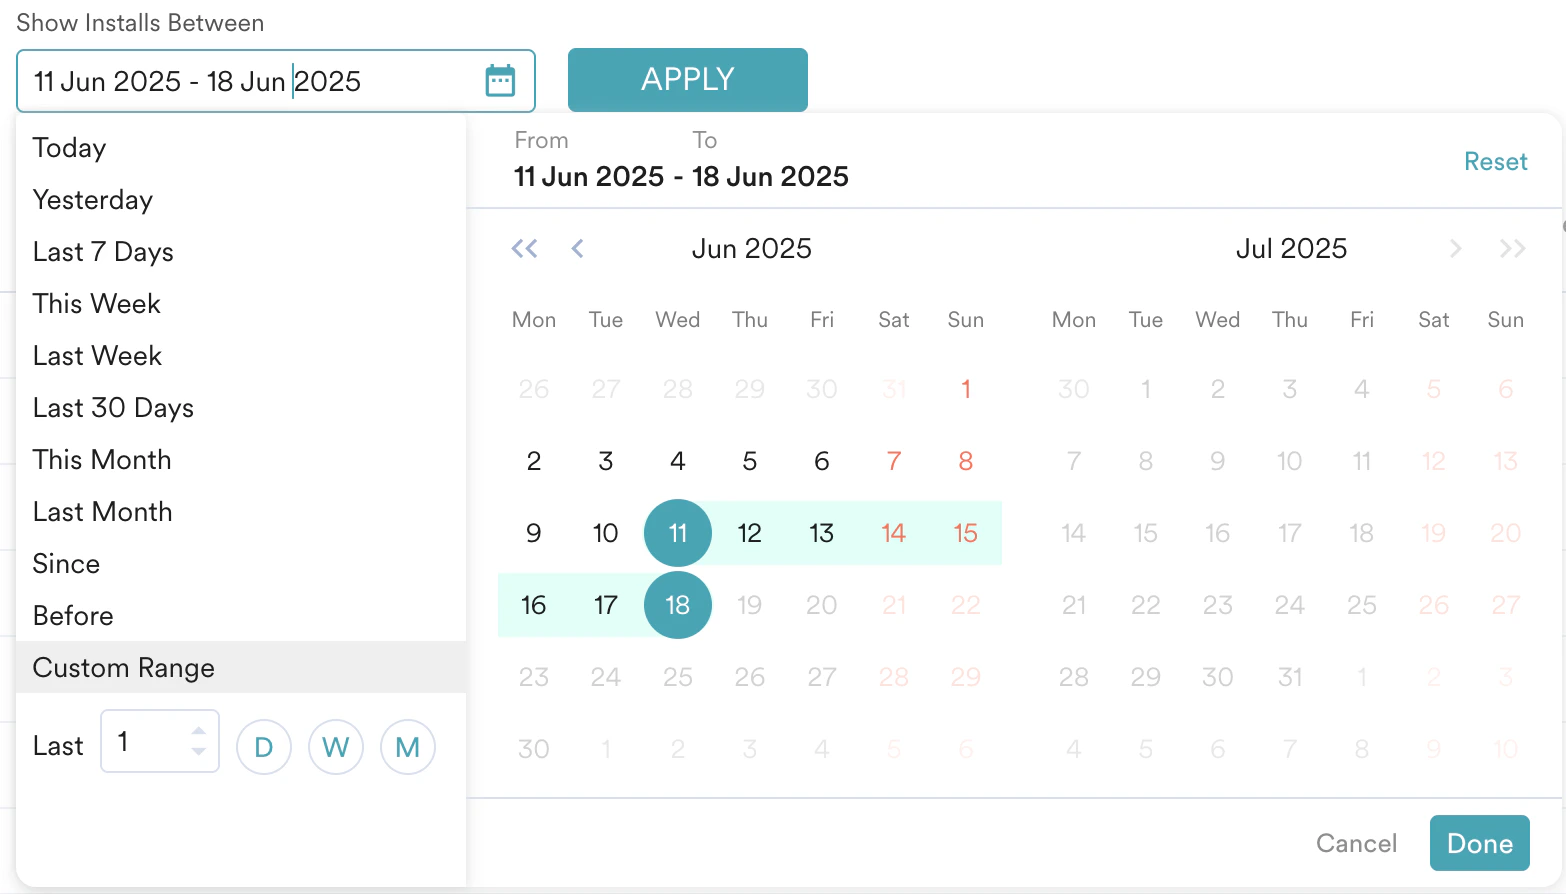
 **Date Range**
You can select a maximum of 60-day period at a time.
**Date Range**
You can select a maximum of 60-day period at a time.
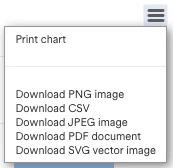
 **Export the chart data**
Export the chart data in various format including CSV, PDF, and image files.
**Export the chart data**
Export the chart data in various format including CSV, PDF, and image files.
 ## User Uninstalls By Time
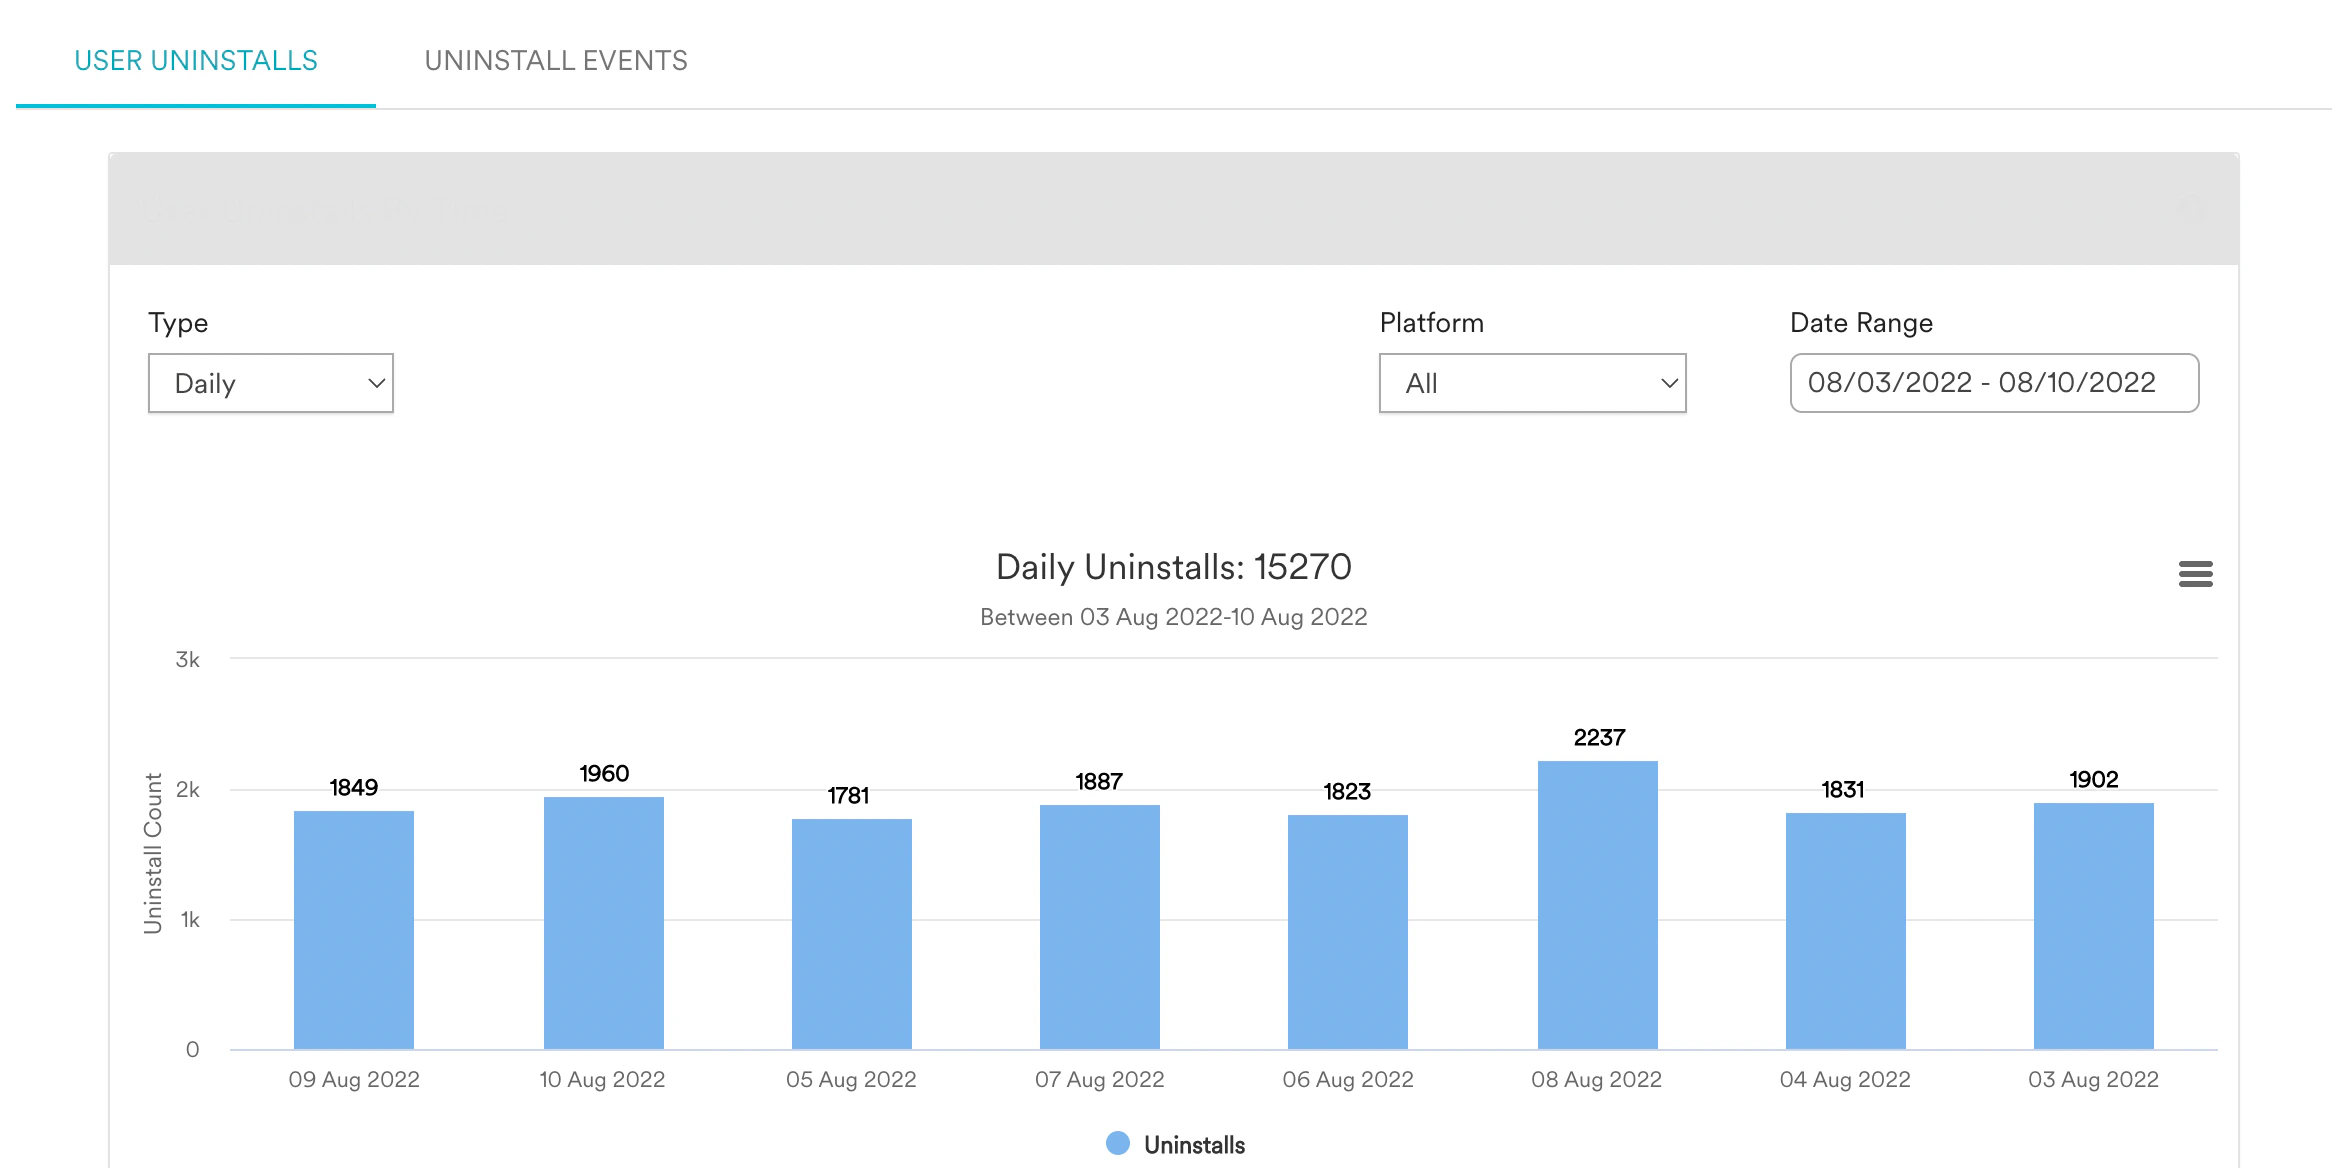
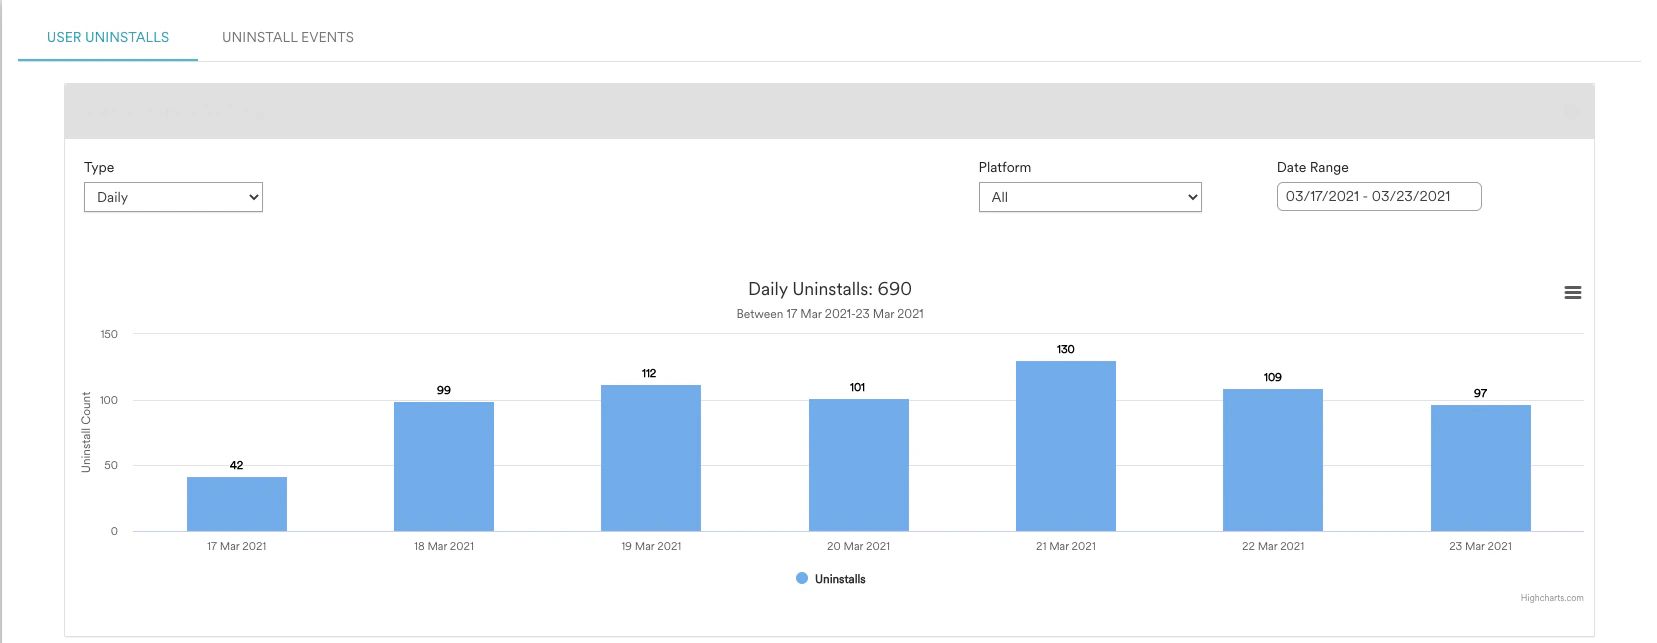
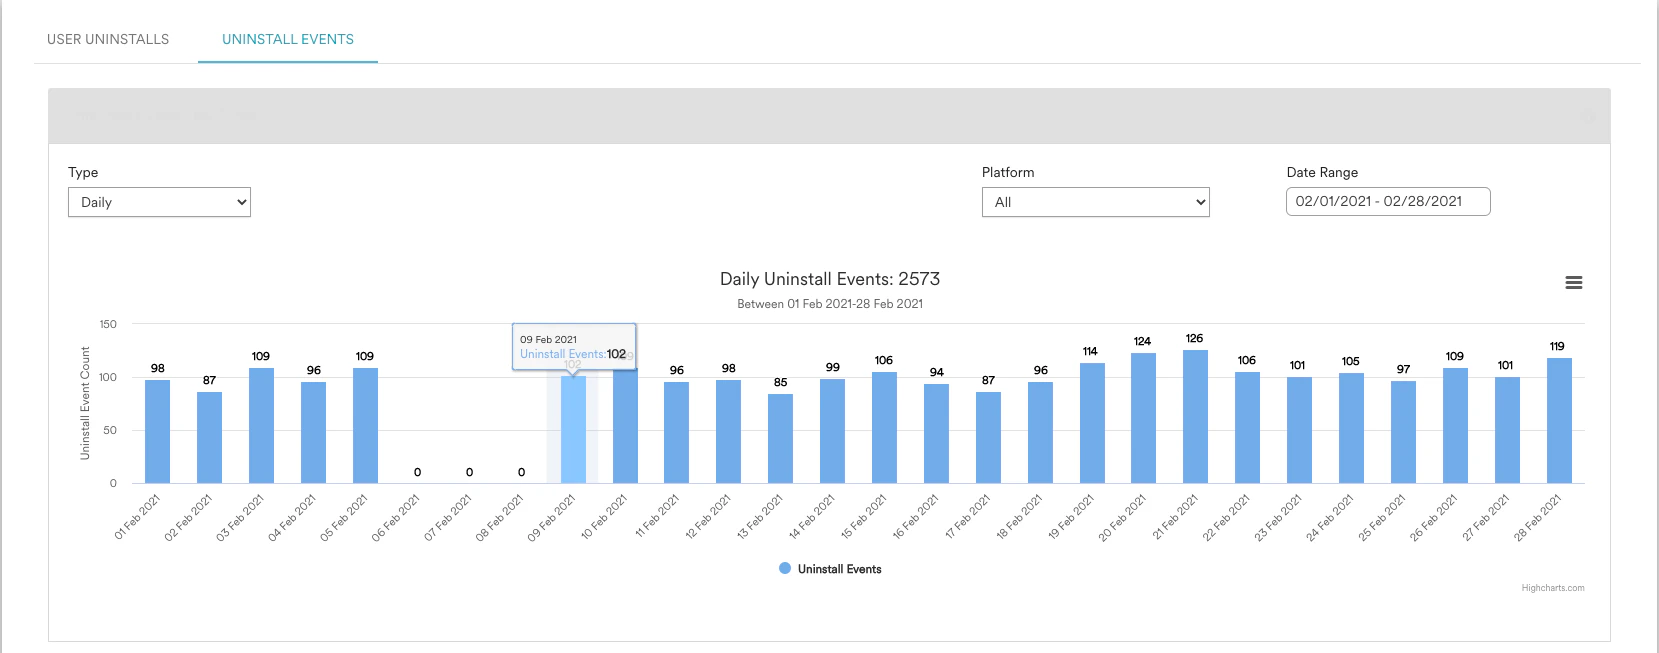
User uninstalls by time provide day-level accuracy such as:
* You can view daily, weekly, or monthly uninstalls for a time range and platform.
* The chart also shows total uninstalls for a set time.
## User Uninstalls By Time
User uninstalls by time provide day-level accuracy such as:
* You can view daily, weekly, or monthly uninstalls for a time range and platform.
* The chart also shows total uninstalls for a set time.
 ## User Uninstalls By Attribute
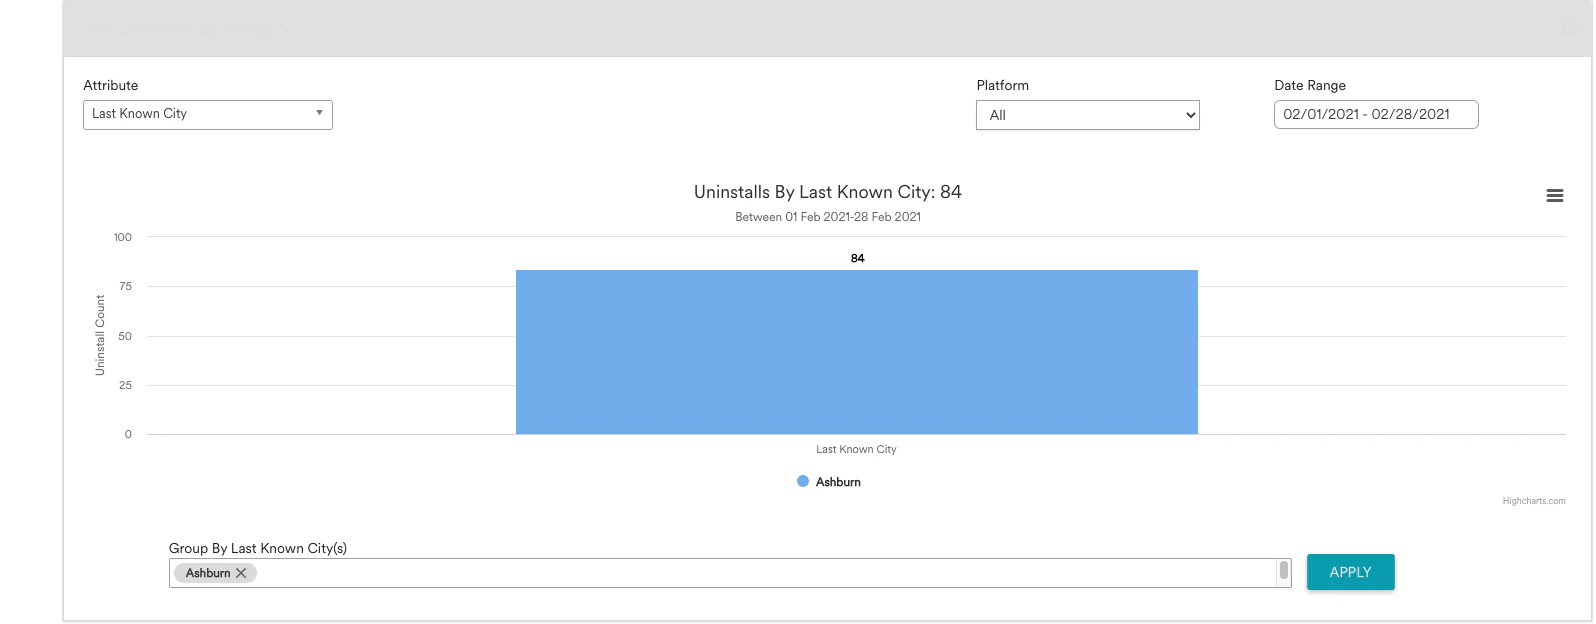
User uninstalls by attributes provide analytics for various ranges or categories by a user attribute grouped together.
* Group uninstalls by any **string, numeric, or boolean type user attribute**.
* The Sum of all uninstalls displayed in the chart is also shown at the top.
* For **string attributes**, by default, the graph displays at most top 10 attribute values by uninstall count.
* For example, the top 10 Last Known Cities are displayed by uninstall count
* If you wish to see uninstalls for any other value, **enter the Attribute values in the input box** and click **APPLY**.
## User Uninstalls By Attribute
User uninstalls by attributes provide analytics for various ranges or categories by a user attribute grouped together.
* Group uninstalls by any **string, numeric, or boolean type user attribute**.
* The Sum of all uninstalls displayed in the chart is also shown at the top.
* For **string attributes**, by default, the graph displays at most top 10 attribute values by uninstall count.
* For example, the top 10 Last Known Cities are displayed by uninstall count
* If you wish to see uninstalls for any other value, **enter the Attribute values in the input box** and click **APPLY**.
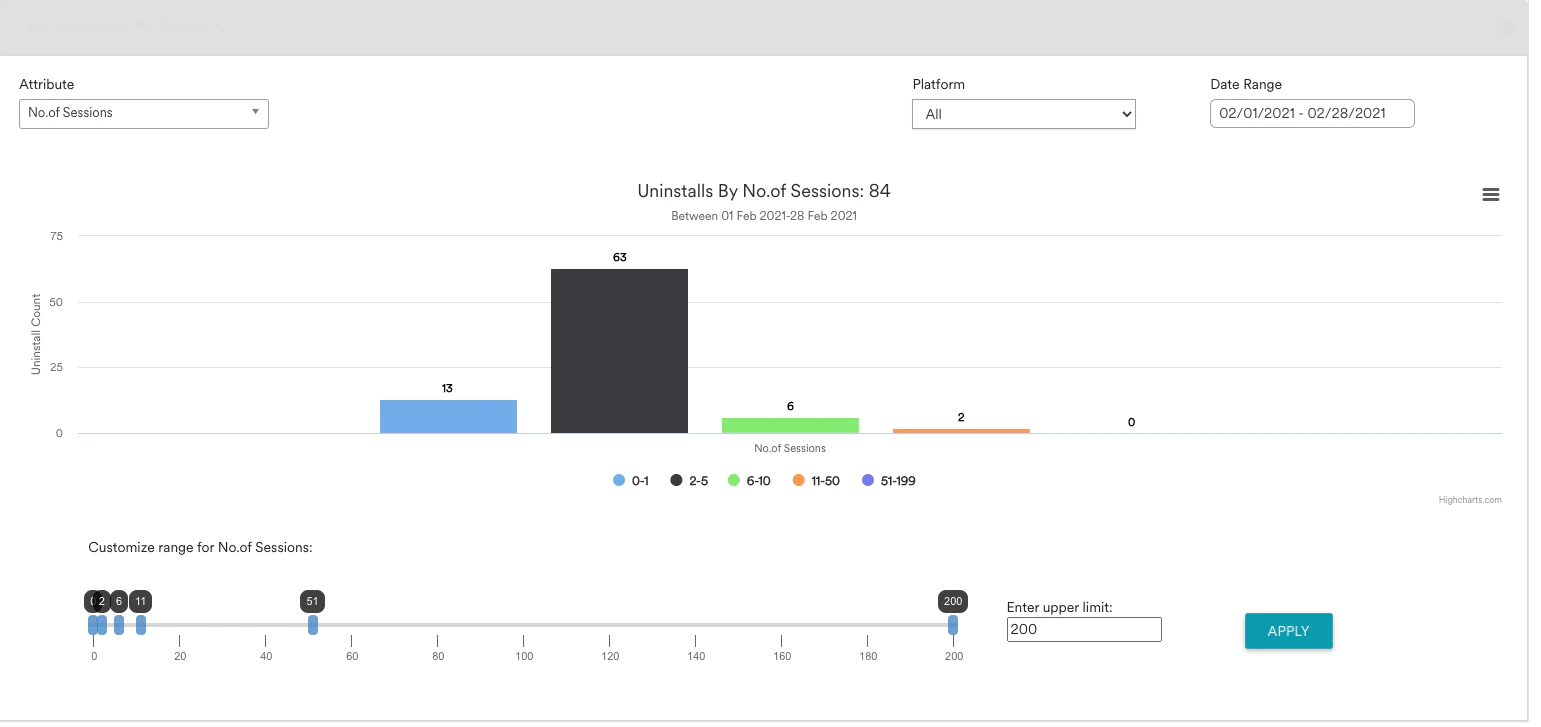
 * For **numeric attributes**, the graph displays uninstalls for various ranges of attribute values.
* For example, for No. of Sessions, by default you will see uninstalls grouped into ranges 1-1, 2-5, 6-10 11-50, and 51-199.
* If you wish to modify these ranges, **move the knobs on the slider to the required position** and click on “APPLY”.
* You can also modify the upper limit of the slider. Minimum value for the upper limit is 10.
* For **numeric attributes**, the graph displays uninstalls for various ranges of attribute values.
* For example, for No. of Sessions, by default you will see uninstalls grouped into ranges 1-1, 2-5, 6-10 11-50, and 51-199.
* If you wish to modify these ranges, **move the knobs on the slider to the required position** and click on “APPLY”.
* You can also modify the upper limit of the slider. Minimum value for the upper limit is 10.
 Uninstall counts are based on the most recent data available. It is possible that past uninstall figures changed due to below listed reasons -
* Users uninstall and reinstall the app
* User merging or user deletion
# Uninstall Events
Two types of uninstall events visualization for devices are available:
* Uninstall Events By Time
* Uninstall Events By Attribute
## Uninstall Events By Time
Uninstall counts are based on the most recent data available. It is possible that past uninstall figures changed due to below listed reasons -
* Users uninstall and reinstall the app
* User merging or user deletion
# Uninstall Events
Two types of uninstall events visualization for devices are available:
* Uninstall Events By Time
* Uninstall Events By Attribute
## Uninstall Events By Time
 ## Uninstall Events by Attribute
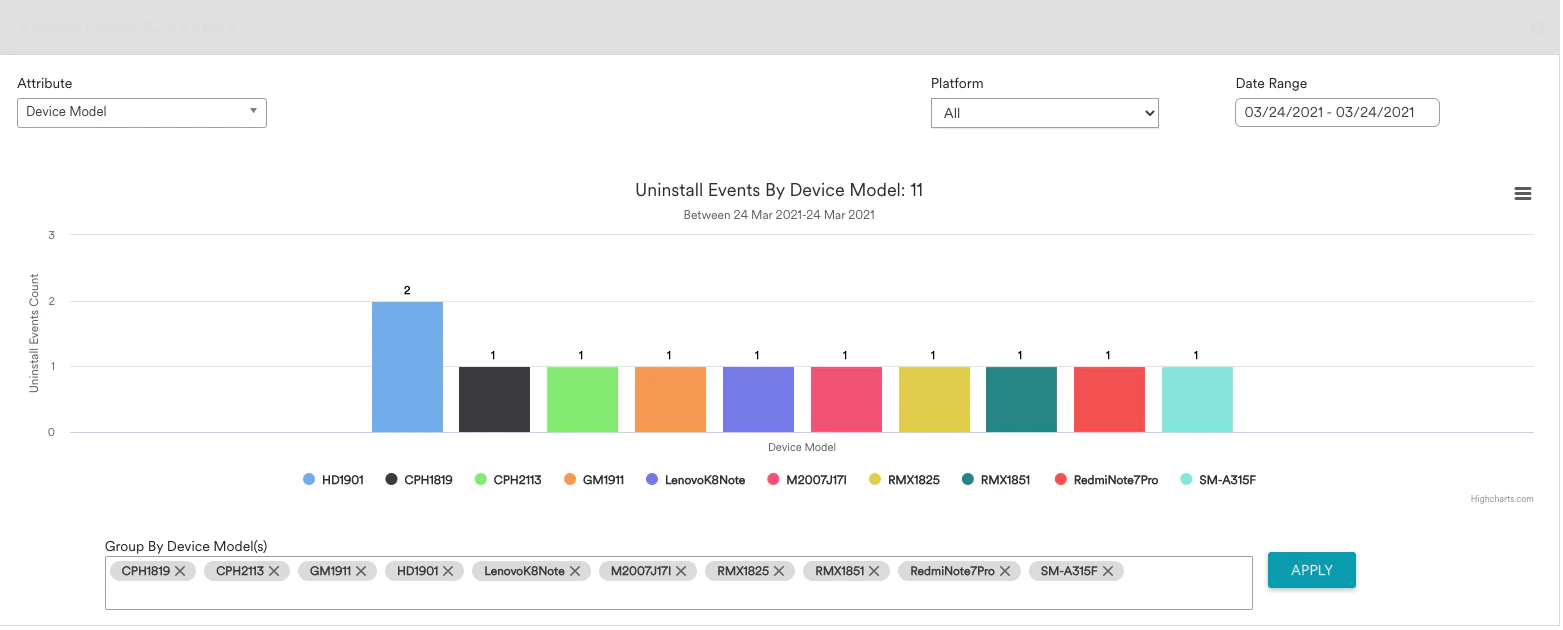 The graphs provide:
1. Filtered based on the platform and date range (up to the **last 60 days**)
2. Downloaded in CSV, jpeg, png, pdf, SVG vector image formats.
3. Display the **sum of all uninstalls** at the top.
4. Support **customizable ranges and modification of upper limit** for numeric attributes.
5. Have a **minimum upper limit of 10** for numeric attributes.
6. Display **top 10 attribute values** by uninstalling events count.
In Lifetime Activity, you find attributes like Days since last active and Days till last active.
* **Days since last active** helps you visualize device uninstall data according to the number of days between uninstall time of the user on that device and the last active time of the user
* **Days till last active** helps you to visualize device uninstall data according to the number of days between the last active time of the user and when the user was detected first on the MoEngage platform using that device (User created time in MoEngage)
For further assistance, please contact your MoEngage Customer Success Manager (CSM) or the Support team.
The graphs provide:
1. Filtered based on the platform and date range (up to the **last 60 days**)
2. Downloaded in CSV, jpeg, png, pdf, SVG vector image formats.
3. Display the **sum of all uninstalls** at the top.
4. Support **customizable ranges and modification of upper limit** for numeric attributes.
5. Have a **minimum upper limit of 10** for numeric attributes.
6. Display **top 10 attribute values** by uninstalling events count.
In Lifetime Activity, you find attributes like Days since last active and Days till last active.
* **Days since last active** helps you visualize device uninstall data according to the number of days between uninstall time of the user on that device and the last active time of the user
* **Days till last active** helps you to visualize device uninstall data according to the number of days between the last active time of the user and when the user was detected first on the MoEngage platform using that device (User created time in MoEngage)
For further assistance, please contact your MoEngage Customer Success Manager (CSM) or the Support team.