> ## Documentation Index
> Fetch the complete documentation index at: https://moengage.com/docs/llms.txt
> Use this file to discover all available pages before exploring further.
# User Path Analysis
> Analyze forward and reverse user paths in MoEngage to see how users navigate before and after key events on your website or mobile app.
# Step 1: Choose Event
An event refers to any action that a user completes on your website or app that is tracked. It’s important to understand how users navigate after completing their first event and to know the path they take to reach a specific event. You have two options to analyze:
* **Forward user paths**: This option displays all user paths that begin with the selected event. To use this feature, select the **Path type** as *Starting with* and select the desired **Event**. For example, you can analyze the user paths that start with the event *App/Site Opened*.
* **Reverse user paths**: This option shows all user paths that lead up to the selected event. To use this feature, select the **Path type** as *Ending with* and select the desired **Event**\*.\* For example, you can analyze the user paths that end with the event *Checkout Completed*.
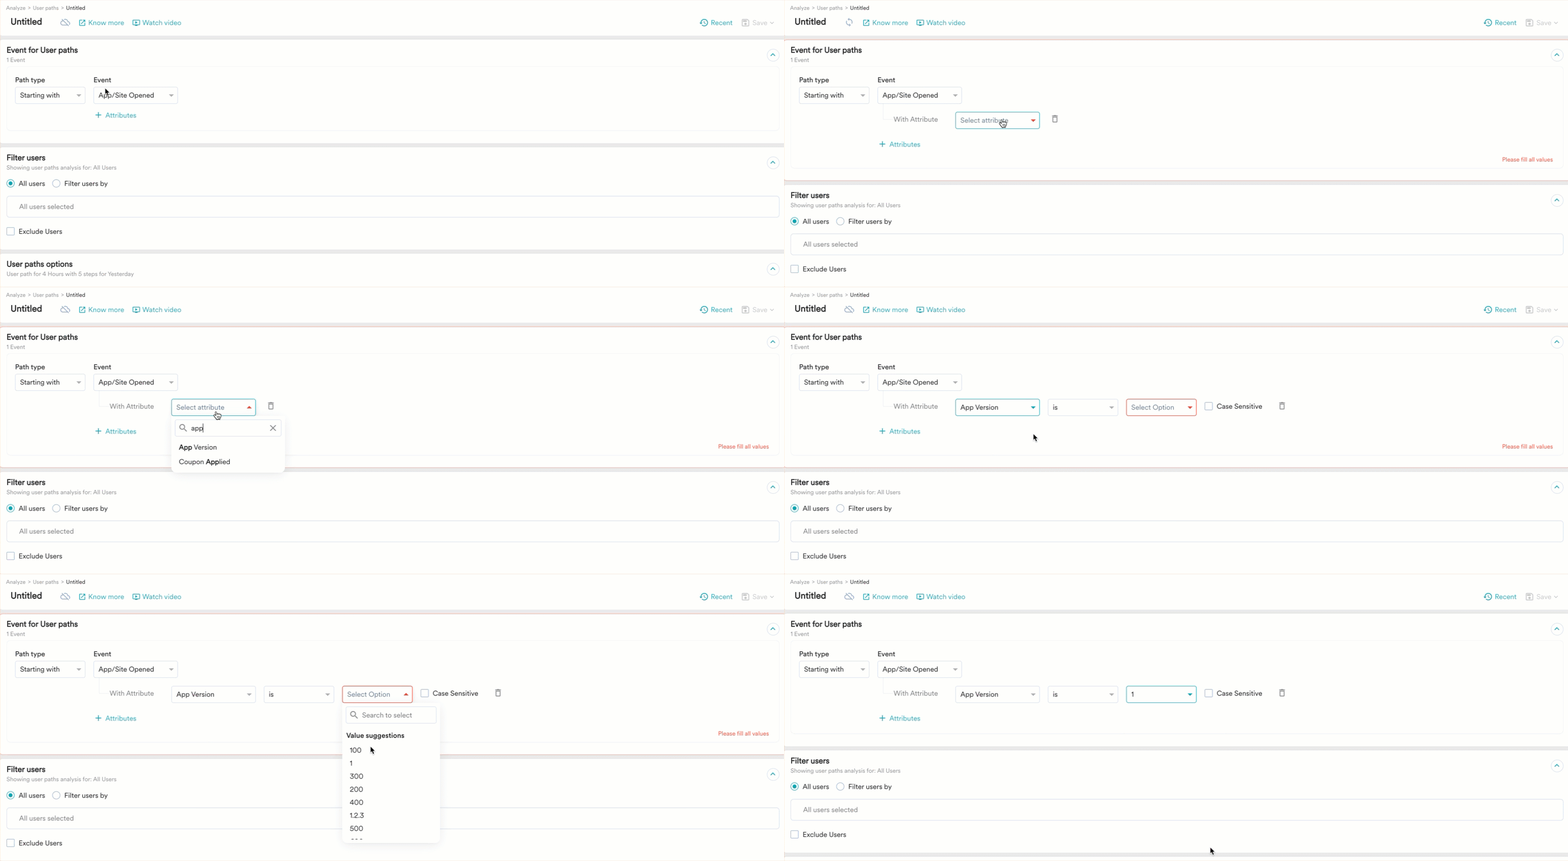
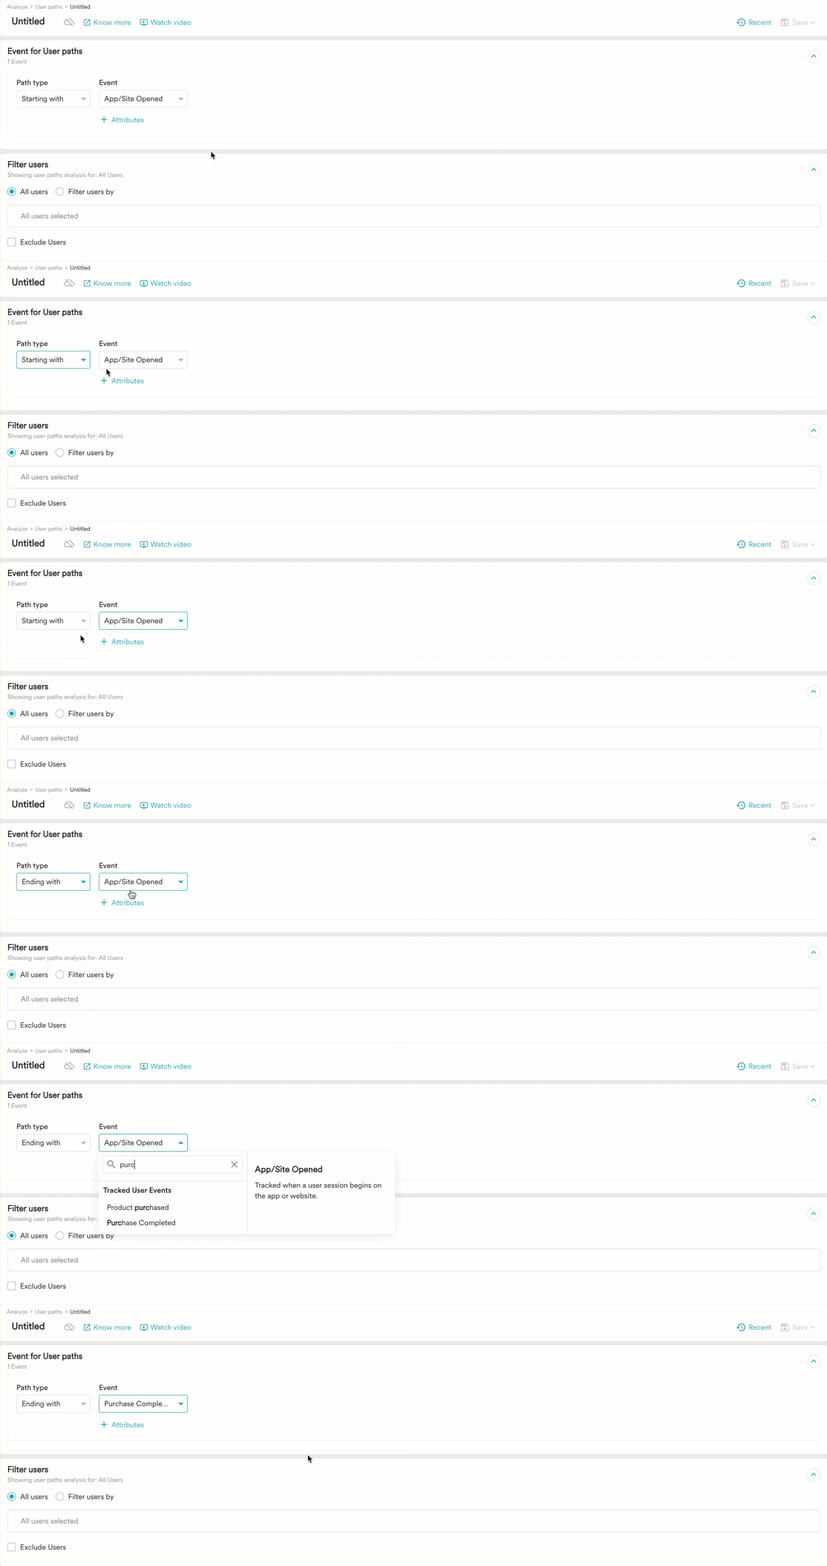 The event can be further filtered. To do so, click **+ Attributes** and select event attributes for specific user actions, such as *Platform*, *App Version*, and so on.
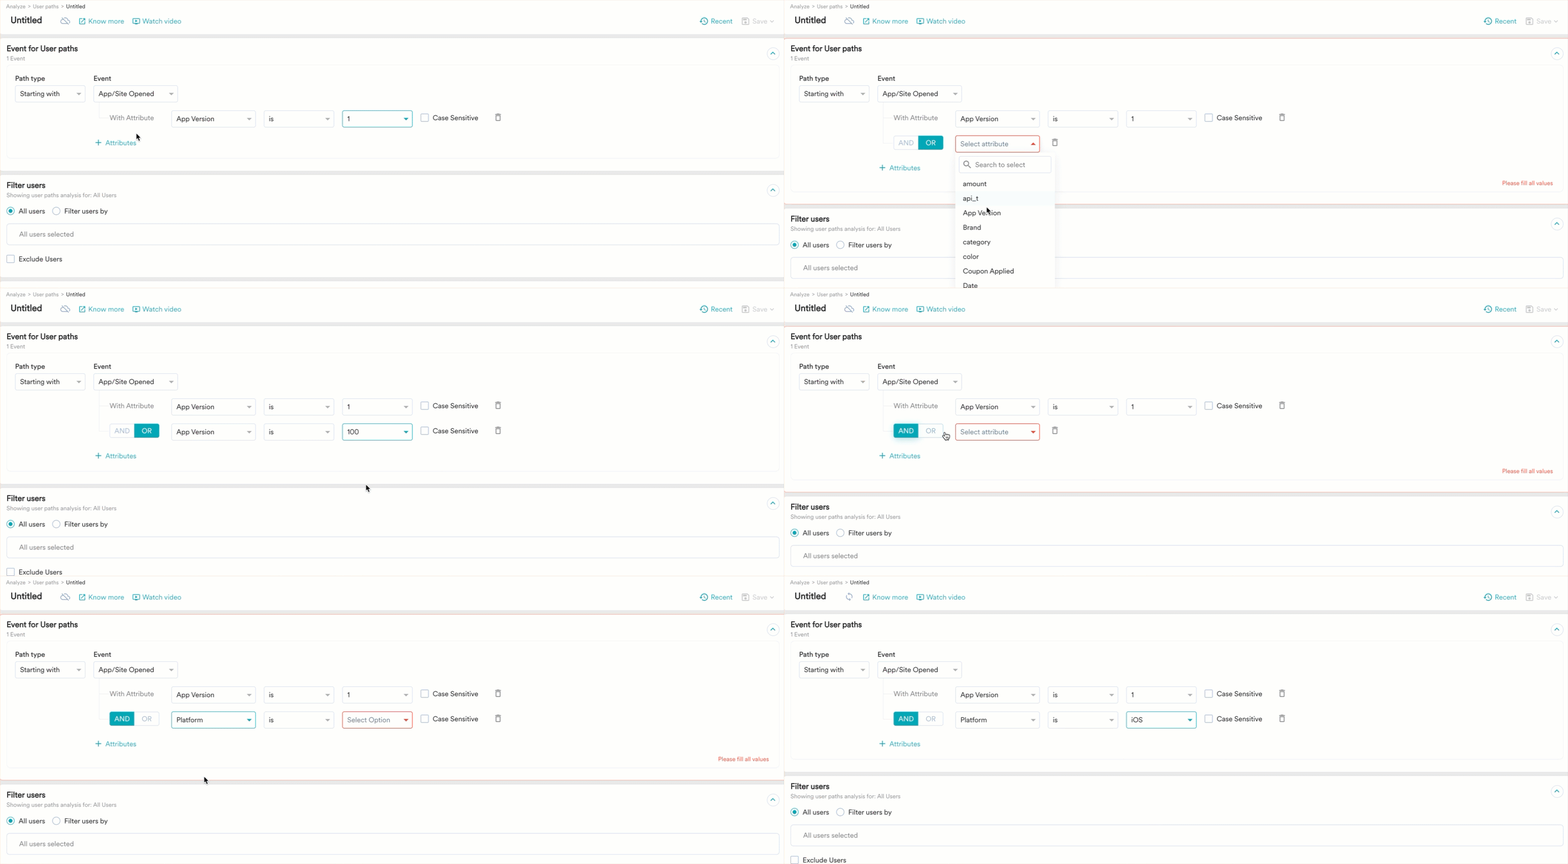
 Click **+ Attributes** again and combine multiple attributes using **AND**/**OR** for each event. For example, use the **OR** filter to combine data across two platforms. If you want to get data for a specific platform and look at the visits to a specific website, use the **AND** filter.
 # Step 2: Filter Users
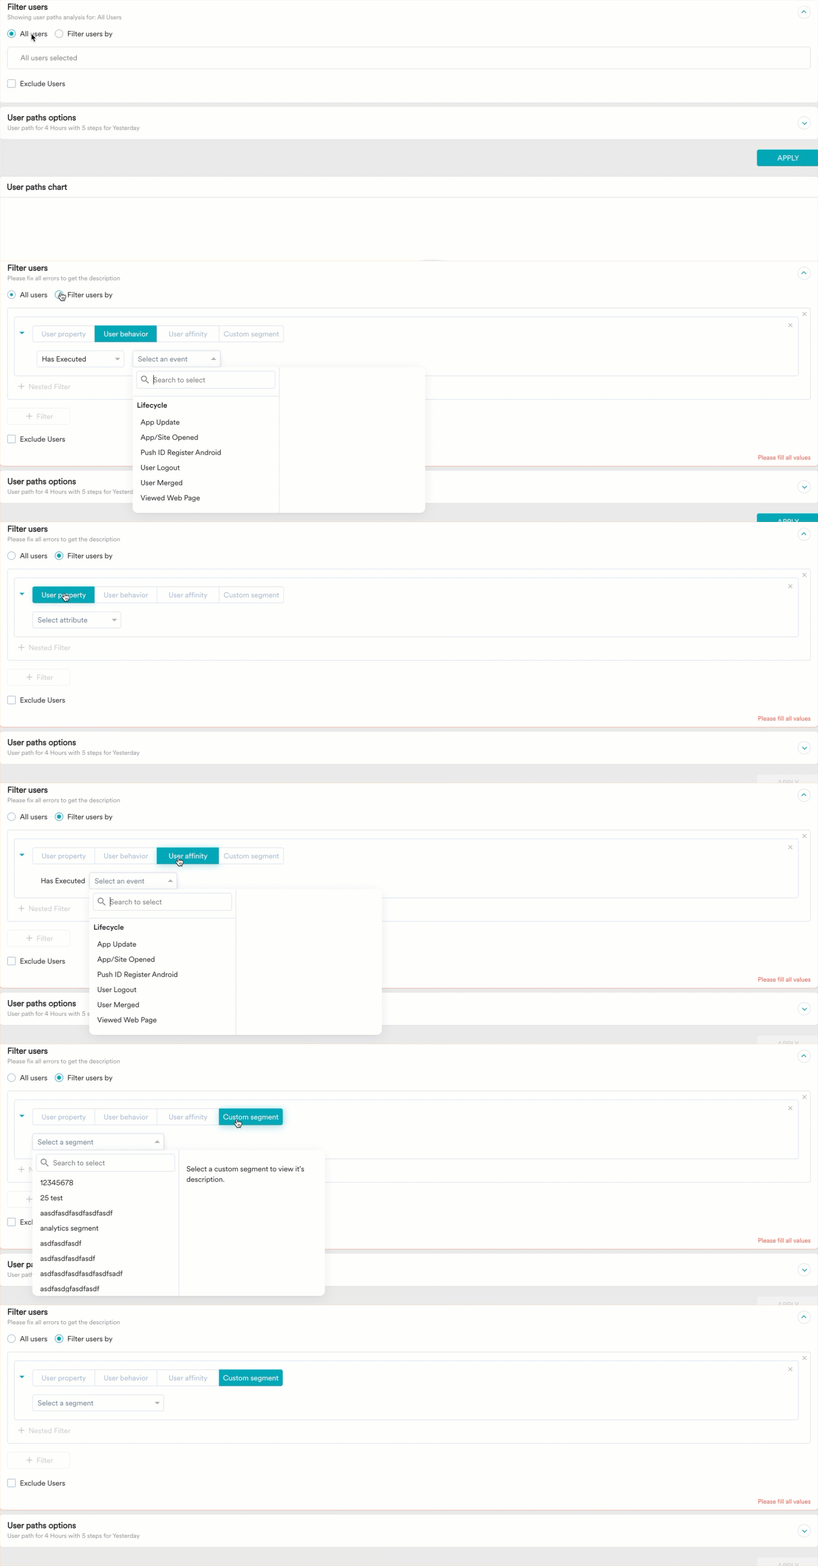
By default, you can obtain the user paths for all users. However, you can also query for a group of users filtered using **User property**, **User activity**, **User affinity**, or **Custom segments**. Filtering users is similar to creating a segment. For more information, refer to [Create Segment](/user-guide/segment/segment-operations/create-segments).
# Step 2: Filter Users
By default, you can obtain the user paths for all users. However, you can also query for a group of users filtered using **User property**, **User activity**, **User affinity**, or **Custom segments**. Filtering users is similar to creating a segment. For more information, refer to [Create Segment](/user-guide/segment/segment-operations/create-segments).
 # Step 3: User Paths Options
 ### User Path Window
Select the desired time window to analyze user paths within a specific duration. This option considers the events that occur within the specified time after the starting event or before the ending event.
The window is set to four hours by default. You can choose units of *Days*, *Hours*, or *Minutes*.
For example, to analyze user paths that occur after the *App/Site Opened* event within a span of 10 hours, you can set the user path window accordingly.
### User Path Steps
By default, the user paths chart shows the first five steps taken by the users after the selected event. For some user events, you might want to analyze the path for a specific number of steps. You can have up to 15 steps in user paths.
For example, analyze the first three actions of the user after they receive a push notification by setting the **User path steps** to three.
### Date Range
After defining the user path window and user path steps, select the time frame for which you want to perform the user path analysis. You can choose from:
### User Path Window
Select the desired time window to analyze user paths within a specific duration. This option considers the events that occur within the specified time after the starting event or before the ending event.
The window is set to four hours by default. You can choose units of *Days*, *Hours*, or *Minutes*.
For example, to analyze user paths that occur after the *App/Site Opened* event within a span of 10 hours, you can set the user path window accordingly.
### User Path Steps
By default, the user paths chart shows the first five steps taken by the users after the selected event. For some user events, you might want to analyze the path for a specific number of steps. You can have up to 15 steps in user paths.
For example, analyze the first three actions of the user after they receive a push notification by setting the **User path steps** to three.
### Date Range
After defining the user path window and user path steps, select the time frame for which you want to perform the user path analysis. You can choose from:
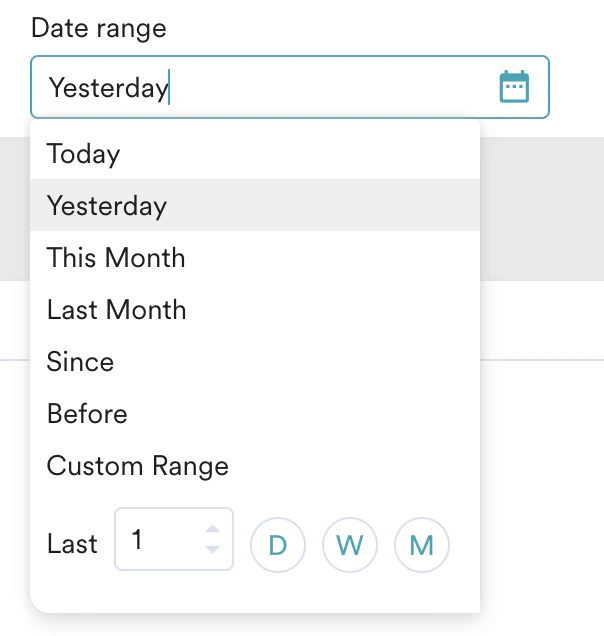 * Today
* Yesterday
* This Month
* Last Month
* Since
* Before
* Custom range
By default, the date range selected is *Yesterday*. User paths cannot be analyzed for more than 30 days at a time. After selecting the date range, click **APPLY**. Your chart is now generated.
# Step 4: Chart
User paths are illustrated using a Sankey Chart analysis, which displays paths and steps flowing from left to right. Each **Node** represents a specific event, while a vertical arrangement of nodes signifies a step. The area or cord connecting two nodes indicates the path taken.
* Today
* Yesterday
* This Month
* Last Month
* Since
* Before
* Custom range
By default, the date range selected is *Yesterday*. User paths cannot be analyzed for more than 30 days at a time. After selecting the date range, click **APPLY**. Your chart is now generated.
# Step 4: Chart
User paths are illustrated using a Sankey Chart analysis, which displays paths and steps flowing from left to right. Each **Node** represents a specific event, while a vertical arrangement of nodes signifies a step. The area or cord connecting two nodes indicates the path taken.
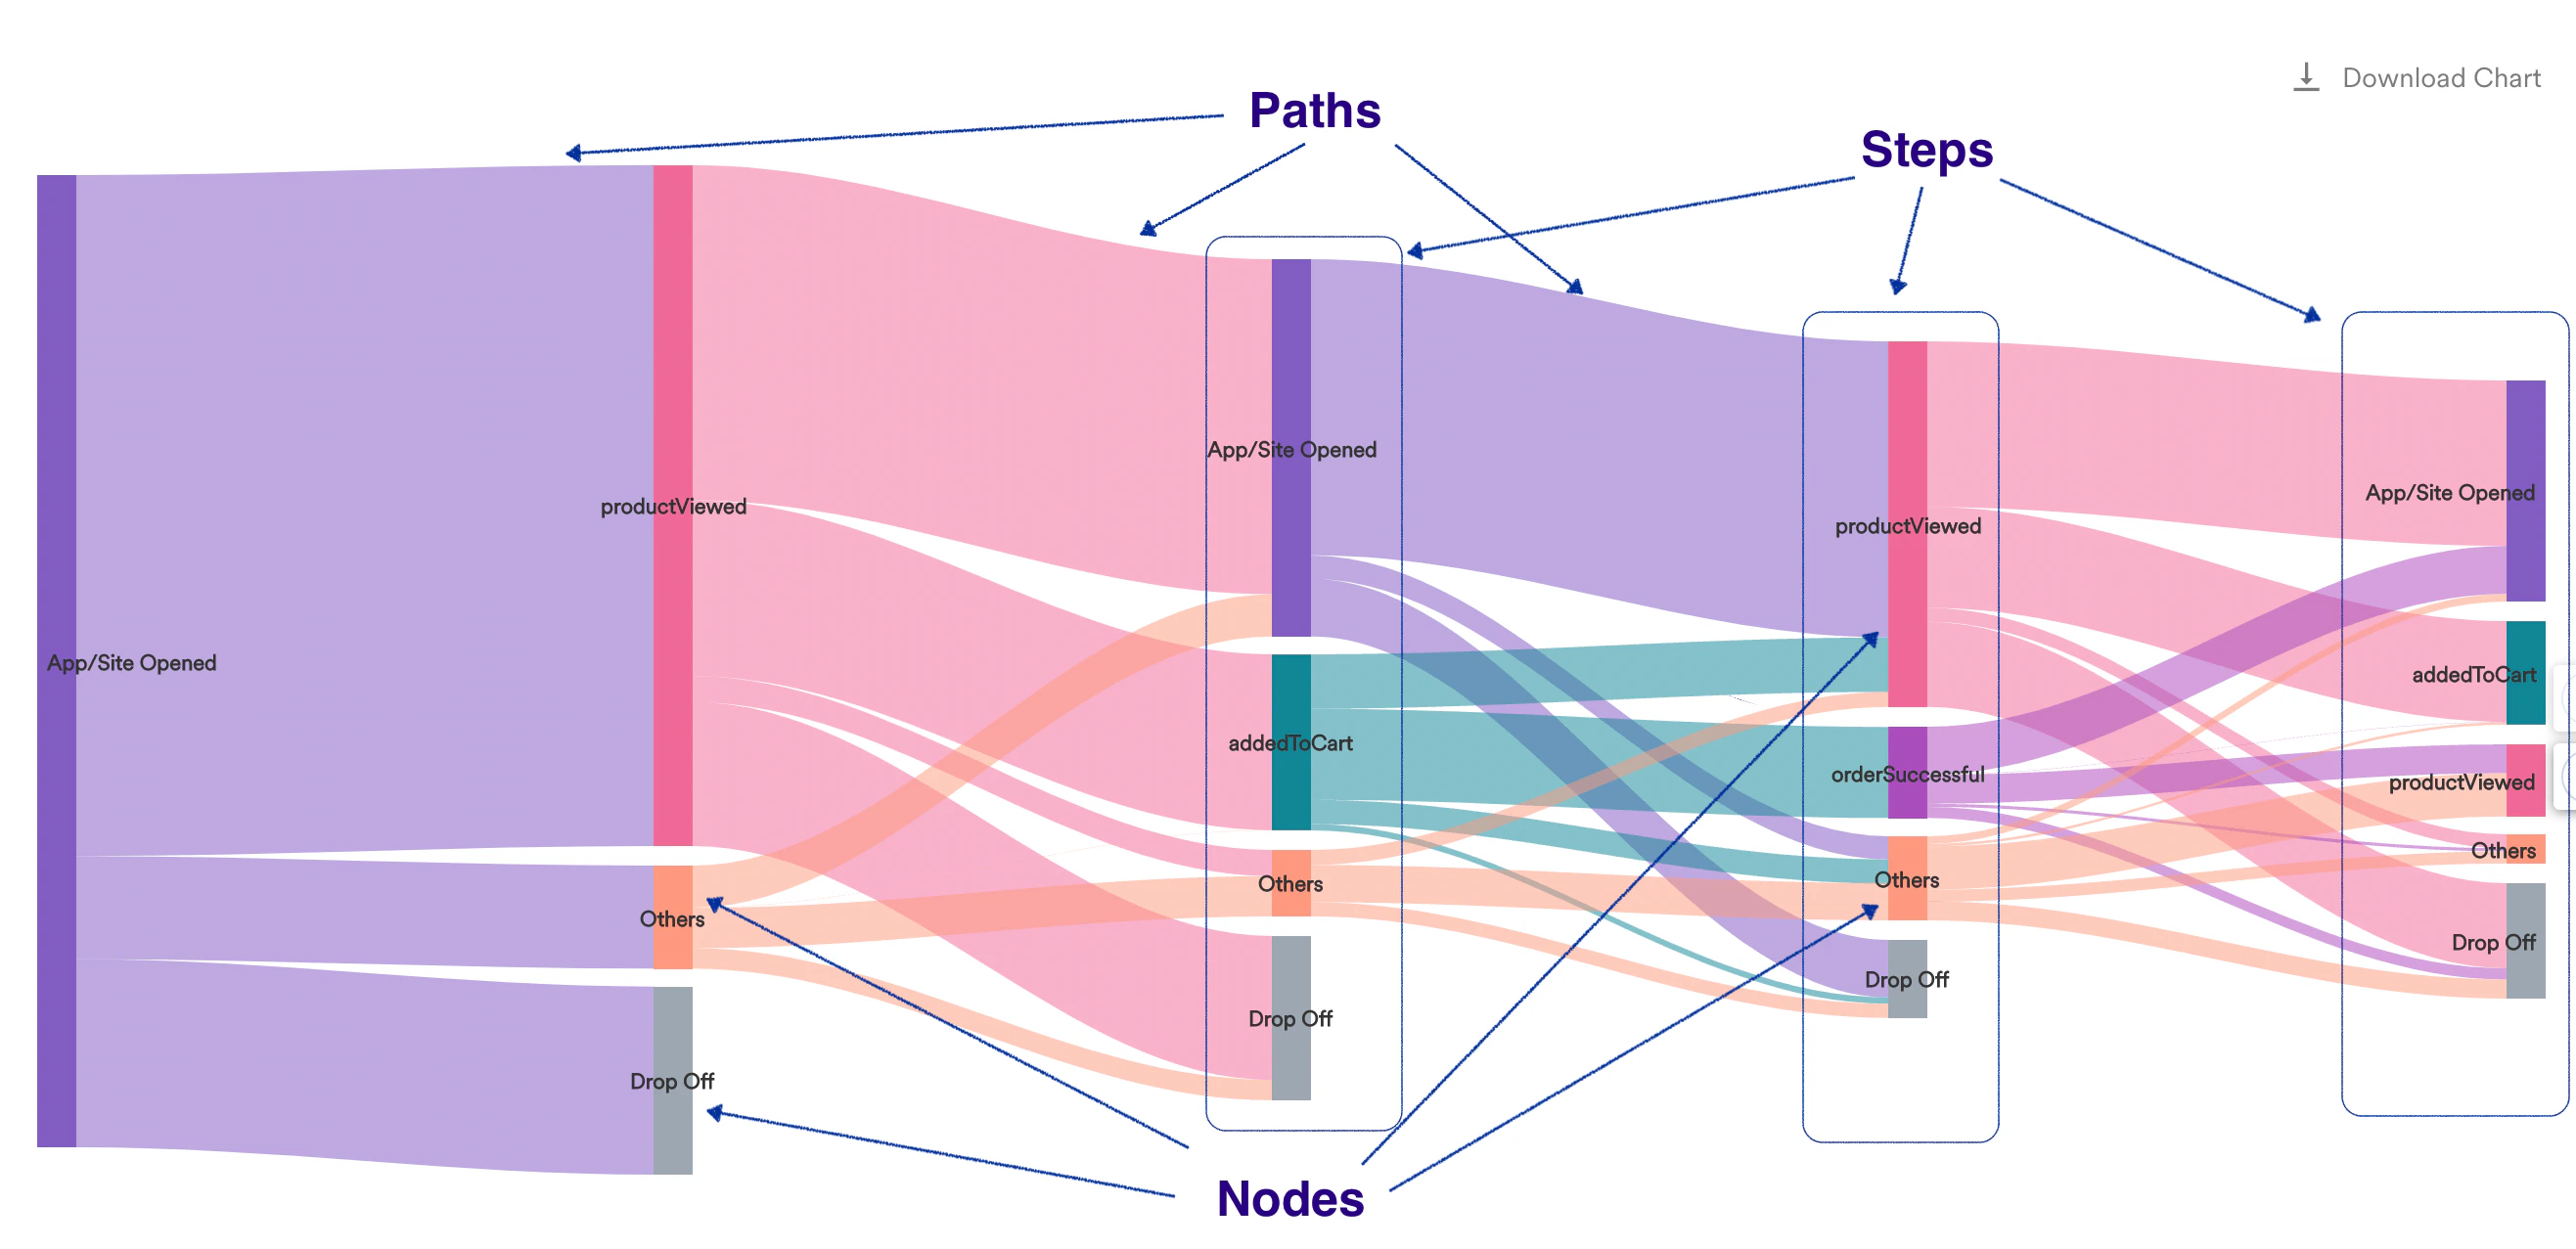 You can analyze user paths by examining consecutive nodes and paths. The forward user path begins at an event and then branches out into multiple paths taken by different users following that initial event. In contrast, reverse user paths involve the merging of different paths into one event.
## Chart for the Forward User Paths
When you hover over a node, the total number of users for that event is shown, as well as a percentage. You can also see the percentage of users who went to the next step and the percentage of users who did nothing after the current step and dropped off. In this scenario, the end nodes do not display any information about the drop-off or the next step because no information is available.
The **Drop off** node represents the total number of times users have dropped off from the previous step and the percentage for the first node.
**Paths** represent the number of times users went from one node to another, along with the origin and destination node names, and the percentage for the origin node.
You can analyze user paths by examining consecutive nodes and paths. The forward user path begins at an event and then branches out into multiple paths taken by different users following that initial event. In contrast, reverse user paths involve the merging of different paths into one event.
## Chart for the Forward User Paths
When you hover over a node, the total number of users for that event is shown, as well as a percentage. You can also see the percentage of users who went to the next step and the percentage of users who did nothing after the current step and dropped off. In this scenario, the end nodes do not display any information about the drop-off or the next step because no information is available.
The **Drop off** node represents the total number of times users have dropped off from the previous step and the percentage for the first node.
**Paths** represent the number of times users went from one node to another, along with the origin and destination node names, and the percentage for the origin node.
 ## Chart for Reverse User Paths
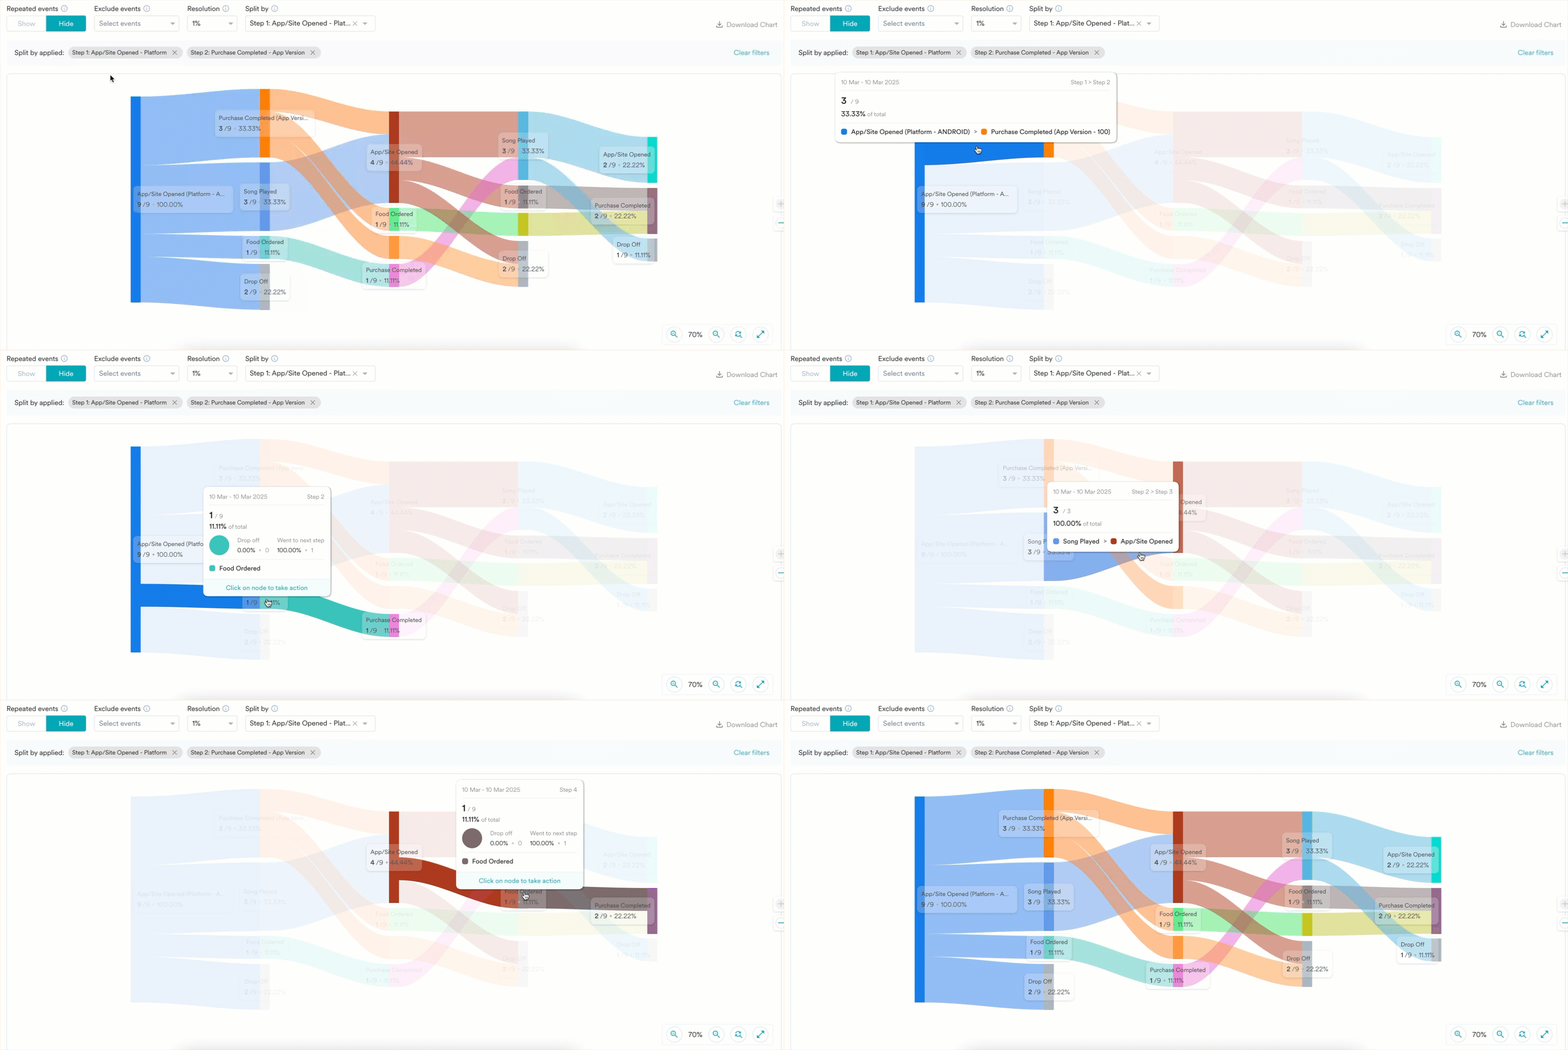
When you hover over a node, the total number of users for that event is shown, as well as a percentage. For the reverse user paths, the popup shows the percentage with respect to the last node. You can also see the percentage of users who came from the previous steps and the percentage of users who went directly to the current step/node. In this scenario, the start nodes do not represent any entry, and the information on the previous step is not available.
The **Entry** **node** represents the total number of times users have entered the next step and the percentage with respect to the last node.
**Paths** represent the number of times users went from one node to another, along with the names of the origin node and destination node, and the percentage change relative to the origin node.
## Chart for Reverse User Paths
When you hover over a node, the total number of users for that event is shown, as well as a percentage. For the reverse user paths, the popup shows the percentage with respect to the last node. You can also see the percentage of users who came from the previous steps and the percentage of users who went directly to the current step/node. In this scenario, the start nodes do not represent any entry, and the information on the previous step is not available.
The **Entry** **node** represents the total number of times users have entered the next step and the percentage with respect to the last node.
**Paths** represent the number of times users went from one node to another, along with the names of the origin node and destination node, and the percentage change relative to the origin node.
 ## Chart Settings
 ### Repeated Events
Repeated events are a series of the same events performed multiple times by users in succession. Click **Hide** to merge the sequence into one event, and click **Show** to view the entire sequence.
### Exclude Events
To hide certain events from appearing in your User Paths chart, select the desired events from the **Excluded events** list and click **Apply Filters**.
Alternatively, you can add the events to be excluded directly to the chart. To do so, perform the following steps:
1. On the user paths chart, click a desired node. The Perform action dialog box appears.
2. Under **Actions**, select **Exclude this event**.
3. Click **Apply**.
### Resolution
Resolution provides user path details based on a defined percentage count. You can adjust the resolution to increase or decrease the number of paths and nodes.
With this filter, you can set a lower boundary for node visibility in the user path chart. If the percentage of action/event performed for a particular step is lower than the defined resolution, instead of showing the event as a separate node, MoEngage Analytics will integrate any percentage of events that fall below the resolution filter into a single node and label it as **Others**.
### Split By
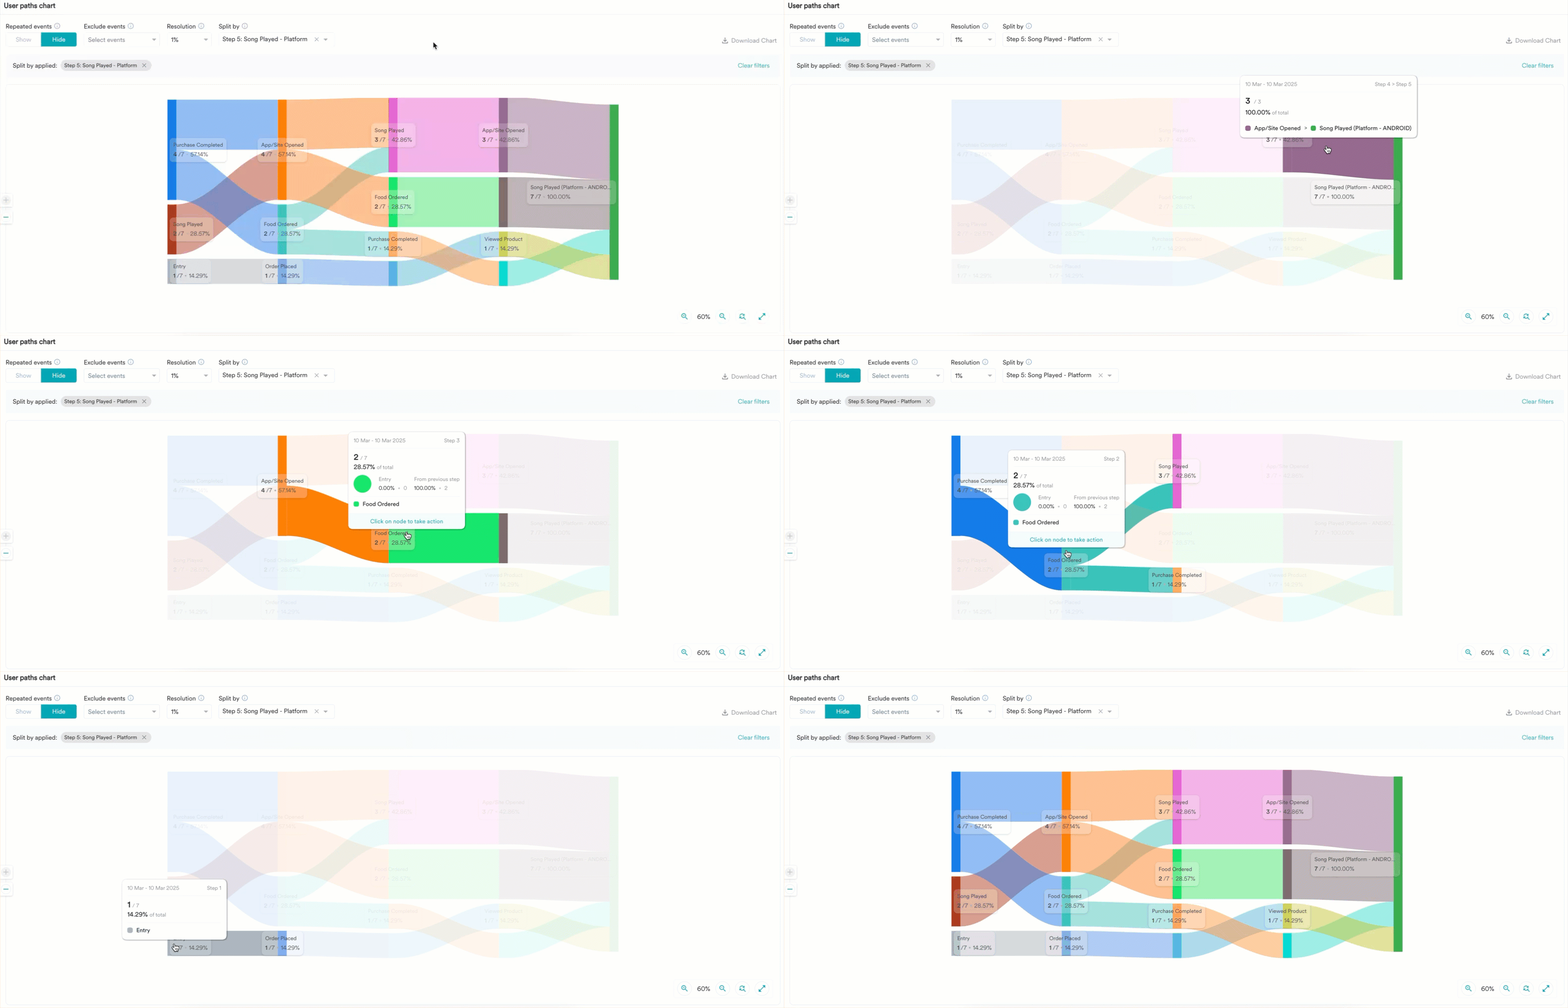
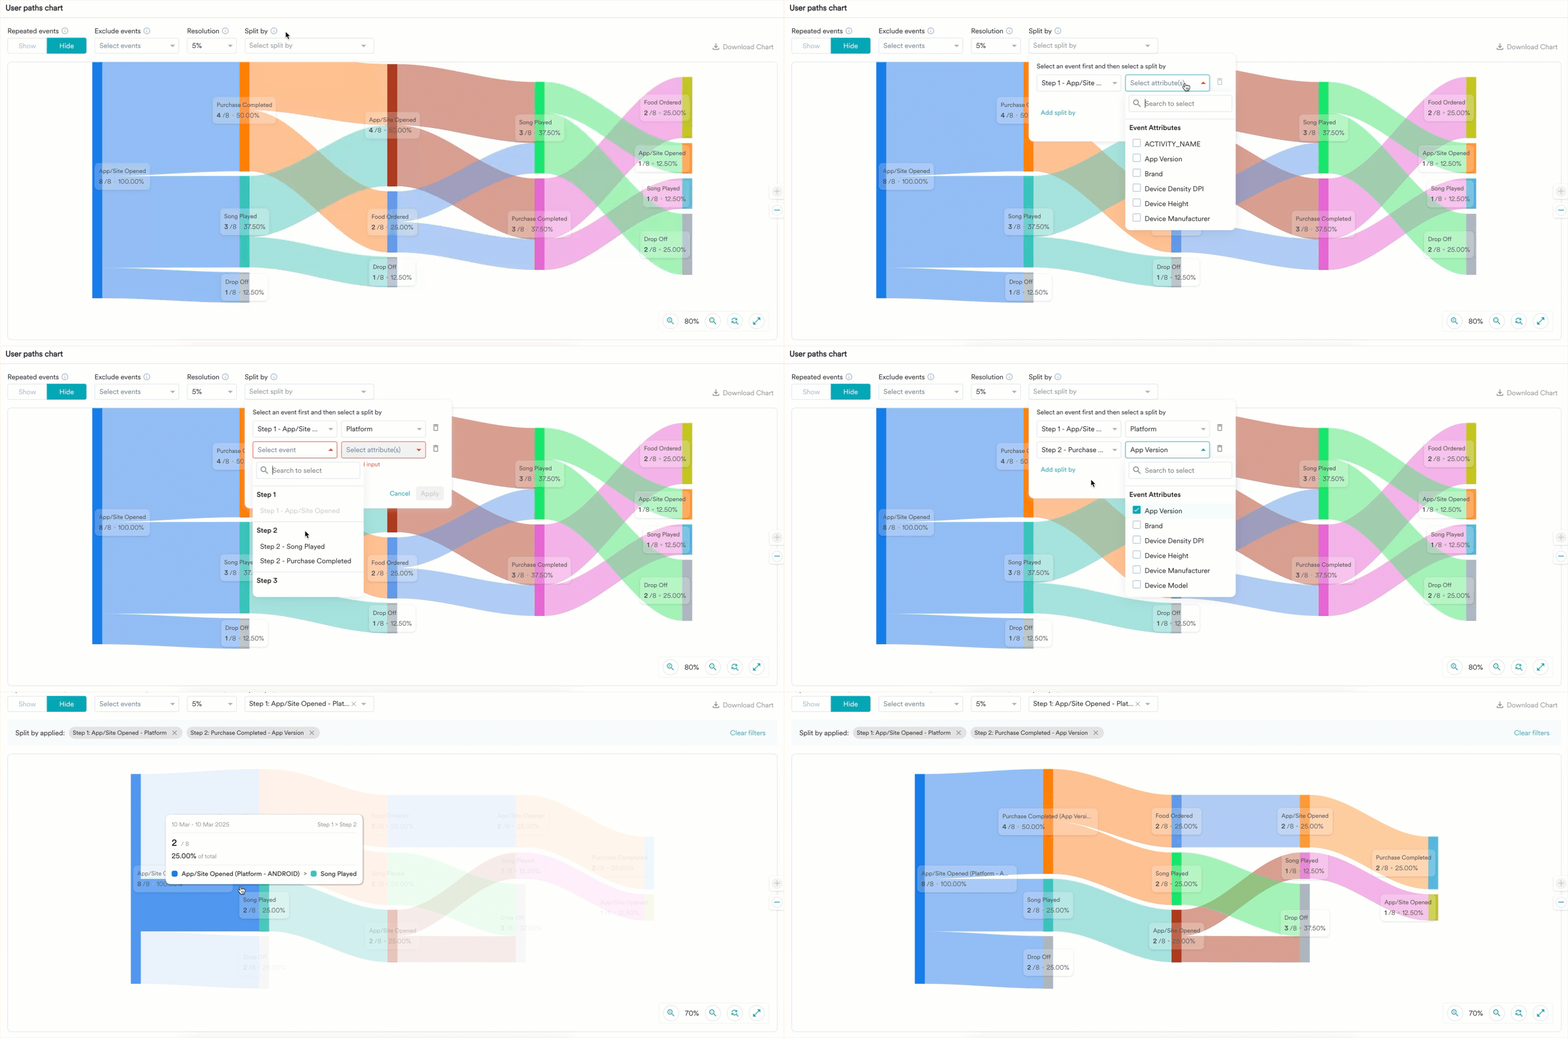
You can use the split by option to group and compare data based on a specific attribute. This feature distributes events according to the event property or user property you select. When you choose only one split by attribute, the distribution displays the analysis of available values for that property. When you split an event, the path will be split by the selected attribute at each node where the event is present.
You can select a maximum of five split by attributes for any step.
### Repeated Events
Repeated events are a series of the same events performed multiple times by users in succession. Click **Hide** to merge the sequence into one event, and click **Show** to view the entire sequence.
### Exclude Events
To hide certain events from appearing in your User Paths chart, select the desired events from the **Excluded events** list and click **Apply Filters**.
Alternatively, you can add the events to be excluded directly to the chart. To do so, perform the following steps:
1. On the user paths chart, click a desired node. The Perform action dialog box appears.
2. Under **Actions**, select **Exclude this event**.
3. Click **Apply**.
### Resolution
Resolution provides user path details based on a defined percentage count. You can adjust the resolution to increase or decrease the number of paths and nodes.
With this filter, you can set a lower boundary for node visibility in the user path chart. If the percentage of action/event performed for a particular step is lower than the defined resolution, instead of showing the event as a separate node, MoEngage Analytics will integrate any percentage of events that fall below the resolution filter into a single node and label it as **Others**.
### Split By
You can use the split by option to group and compare data based on a specific attribute. This feature distributes events according to the event property or user property you select. When you choose only one split by attribute, the distribution displays the analysis of available values for that property. When you split an event, the path will be split by the selected attribute at each node where the event is present.
You can select a maximum of five split by attributes for any step.
 Alternatively, you can add the split by attributes directly on the nodes. To do so, perform the following steps:
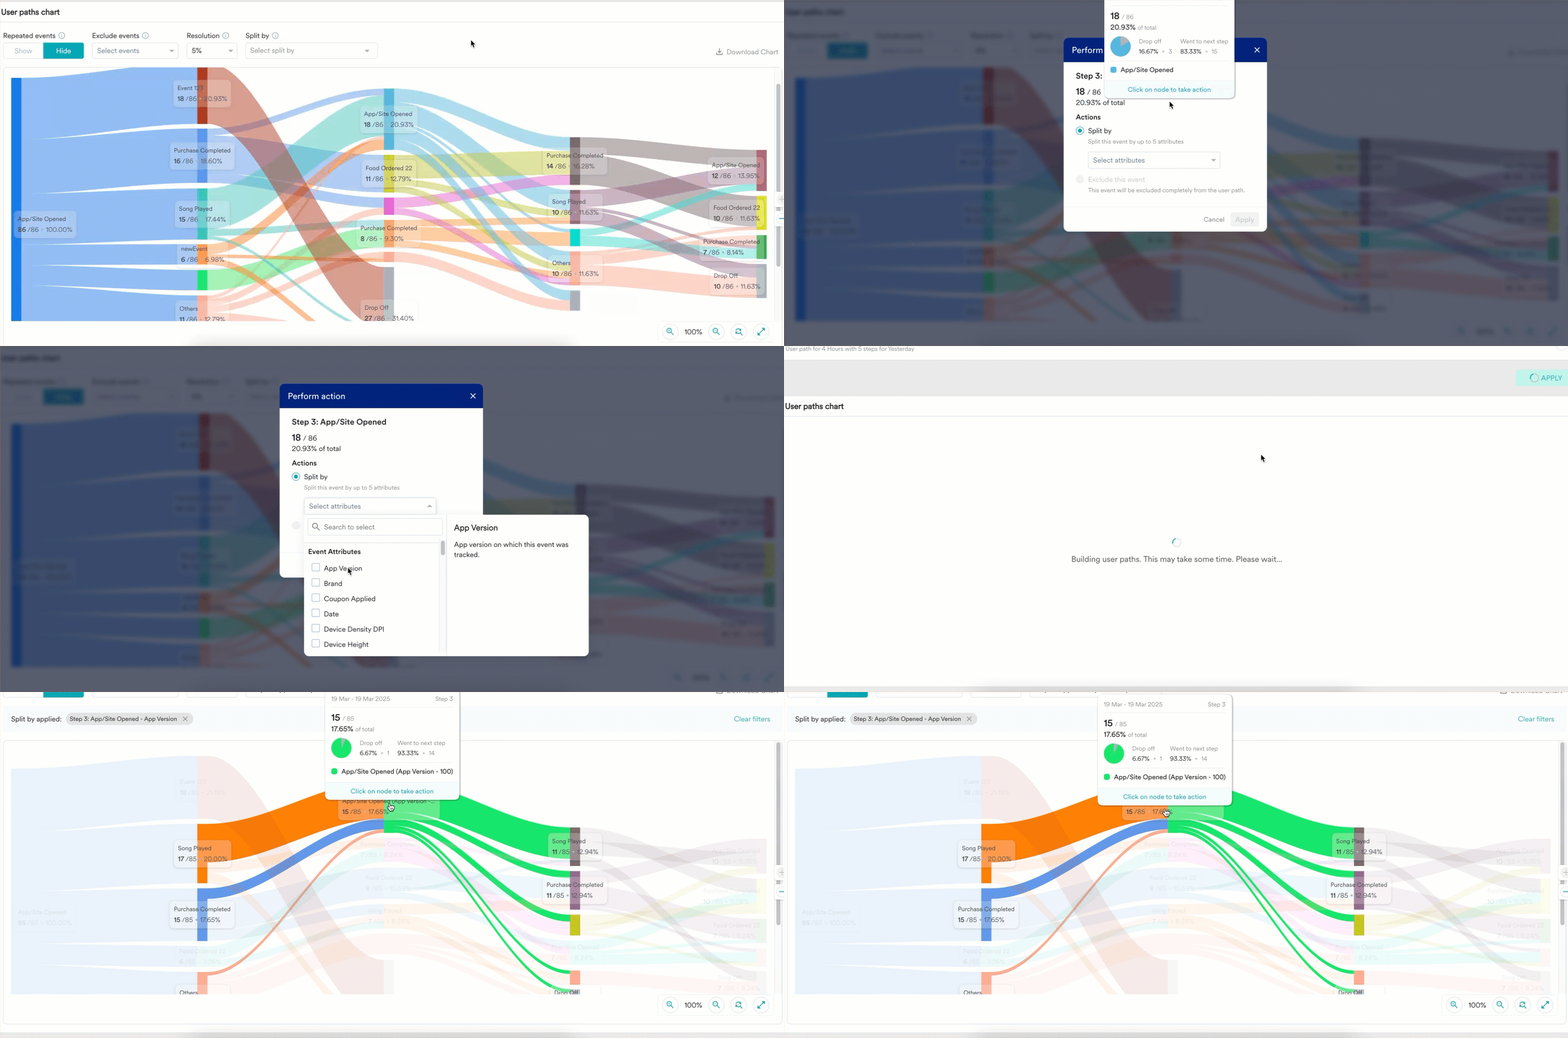
1. On the user paths chart, click a desired node. The Perform action dialog box appears.
2. Under **Actions**, select **Split by**.
3. From the **Select attributes** list, select the desired split by attributes. You can split an event by up to five attributes.
4. Click **Apply**.
Alternatively, you can add the split by attributes directly on the nodes. To do so, perform the following steps:
1. On the user paths chart, click a desired node. The Perform action dialog box appears.
2. Under **Actions**, select **Split by**.
3. From the **Select attributes** list, select the desired split by attributes. You can split an event by up to five attributes.
4. Click **Apply**.
 ### Zoom Chart
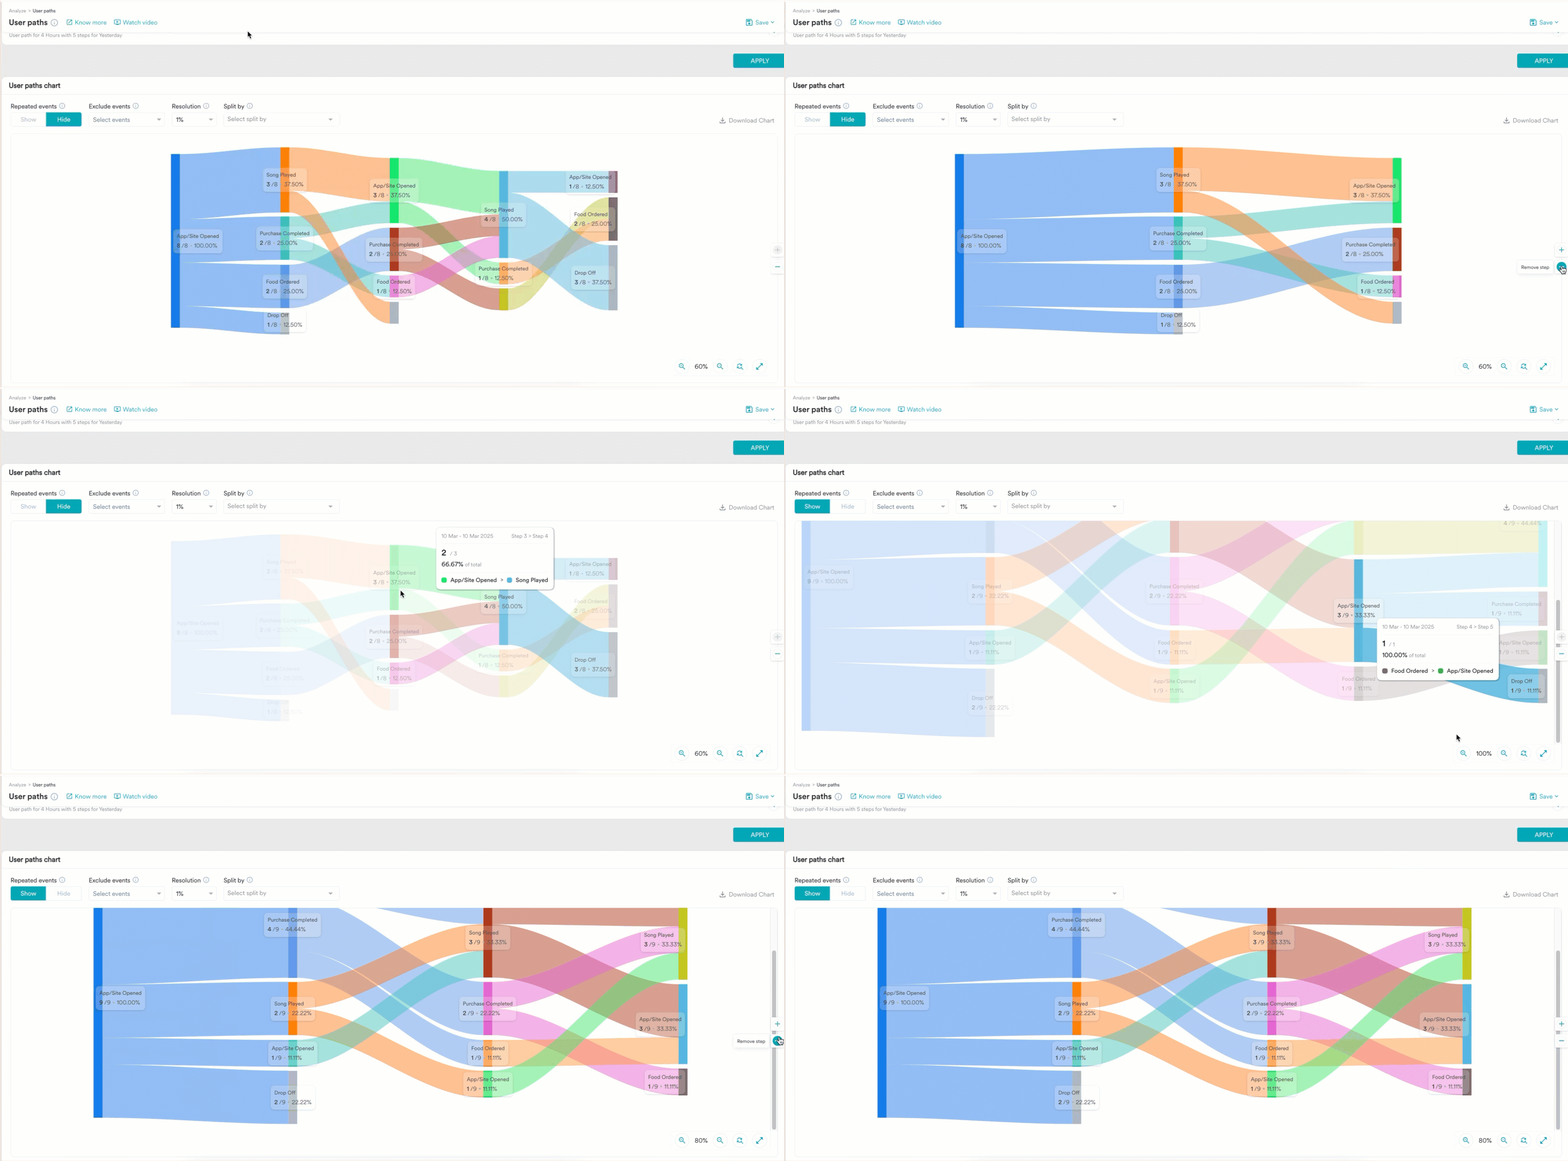
While analyzing user paths with a higher number of steps, you can use the **Zoom chart** functionality to zoom in on a specific step or node and view the details clearly. Similarly, zoom out shall zoom out the chart, and reset zoom shall reset the zoom level of the chart.
### Add and Remove Steps
Apart from the Zoom functionality, you can click **Add Step** or **Remove Step** to control the number of visible steps in the chart. These buttons are available on the right side of the chart in the forward user path and the left side of the chart in the reverse user path.
### Zoom Chart
While analyzing user paths with a higher number of steps, you can use the **Zoom chart** functionality to zoom in on a specific step or node and view the details clearly. Similarly, zoom out shall zoom out the chart, and reset zoom shall reset the zoom level of the chart.
### Add and Remove Steps
Apart from the Zoom functionality, you can click **Add Step** or **Remove Step** to control the number of visible steps in the chart. These buttons are available on the right side of the chart in the forward user path and the left side of the chart in the reverse user path.
 ## Download
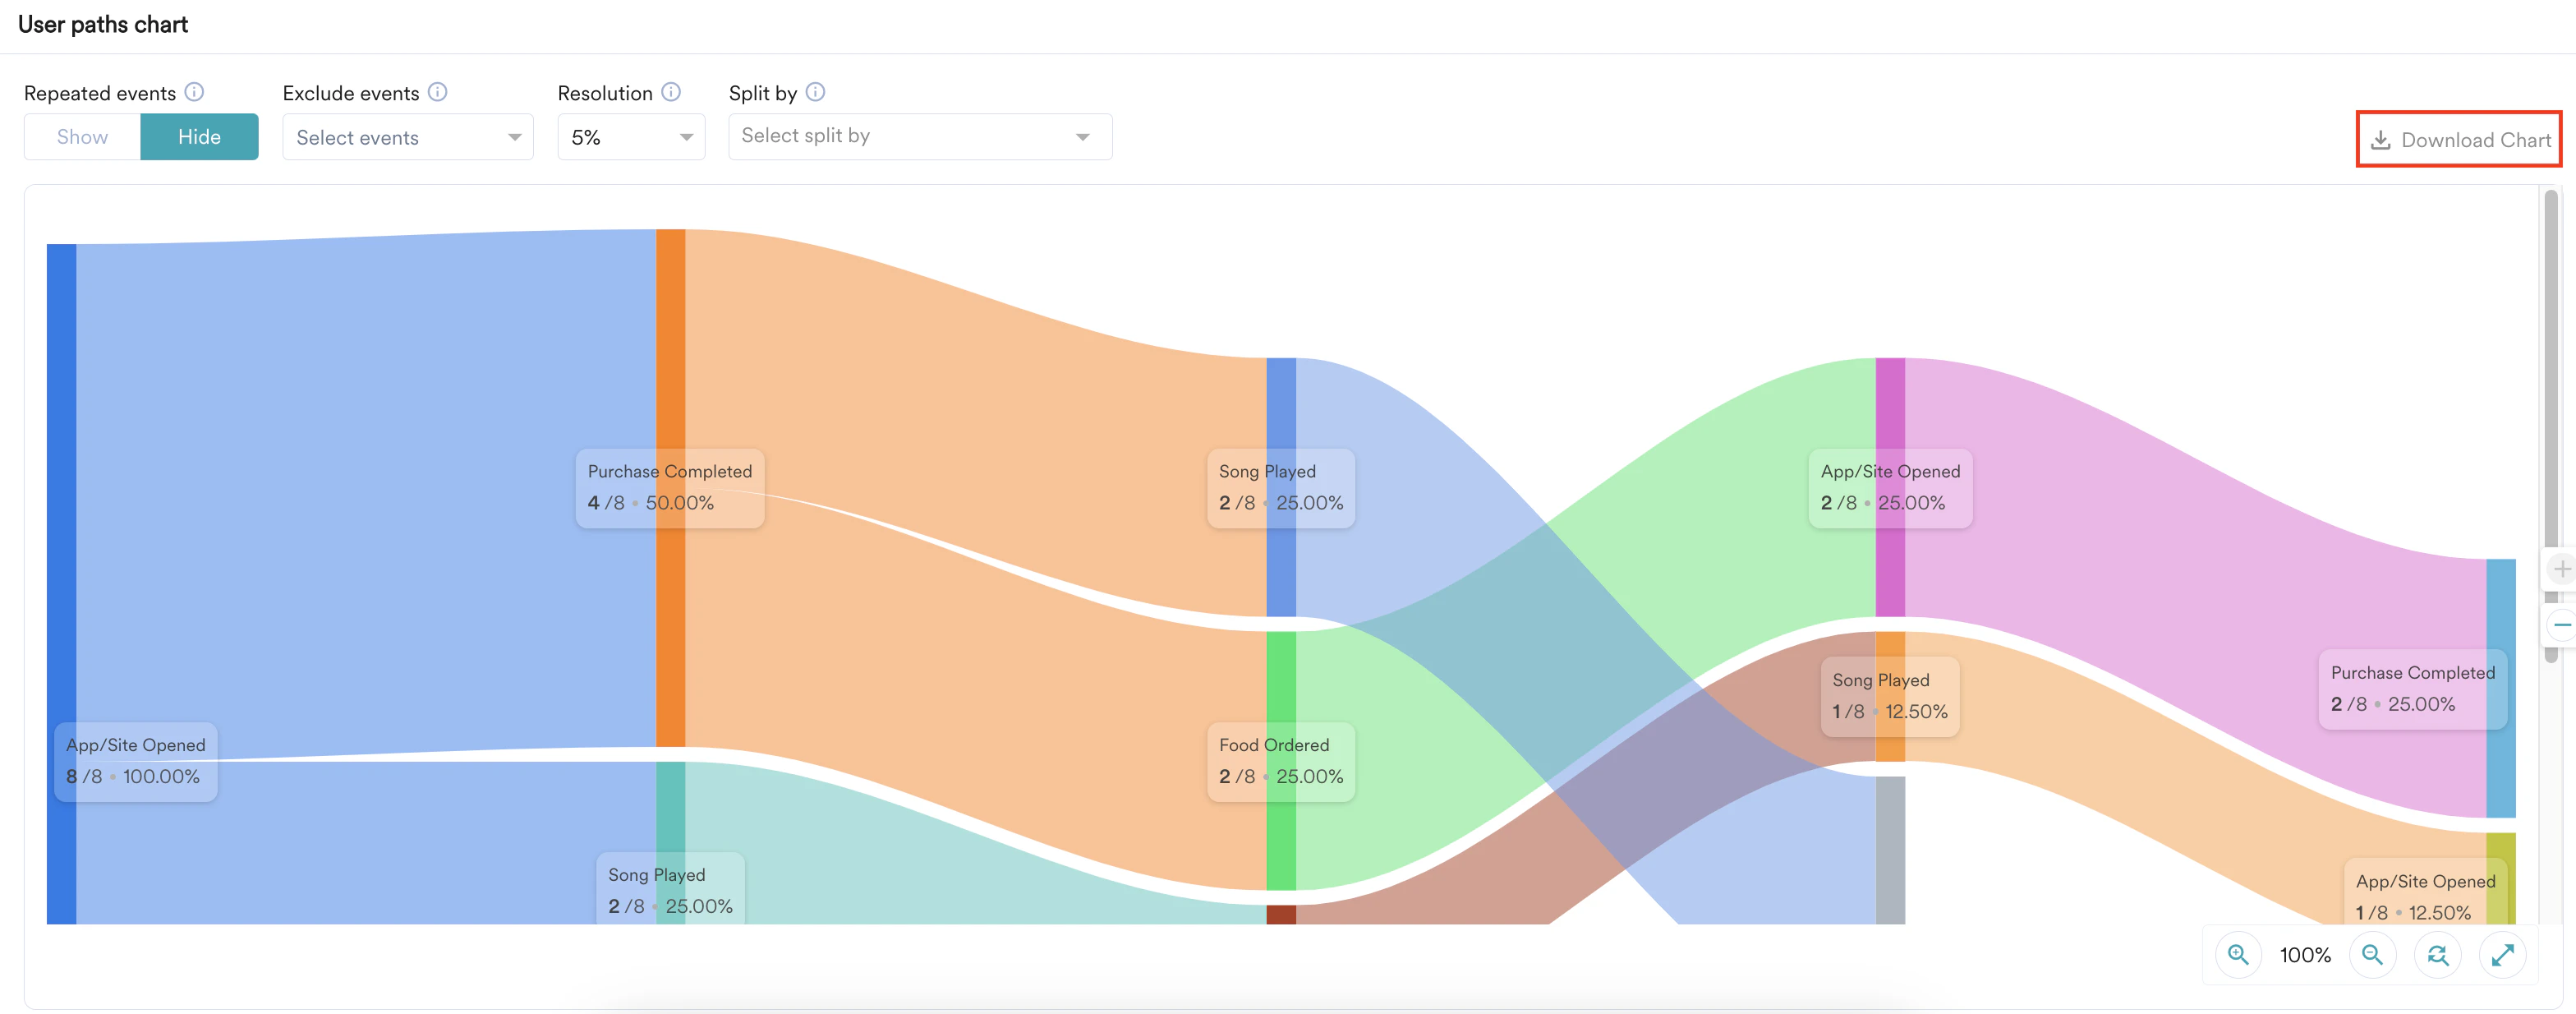
After you view the chart, you might need to share it with your team. Click **Download Chart** in the upper-right corner to download it. The chart will be saved in PNG format.
## Download
After you view the chart, you might need to share it with your team. Click **Download Chart** in the upper-right corner to download it. The chart will be saved in PNG format.
 # Save to My Studio
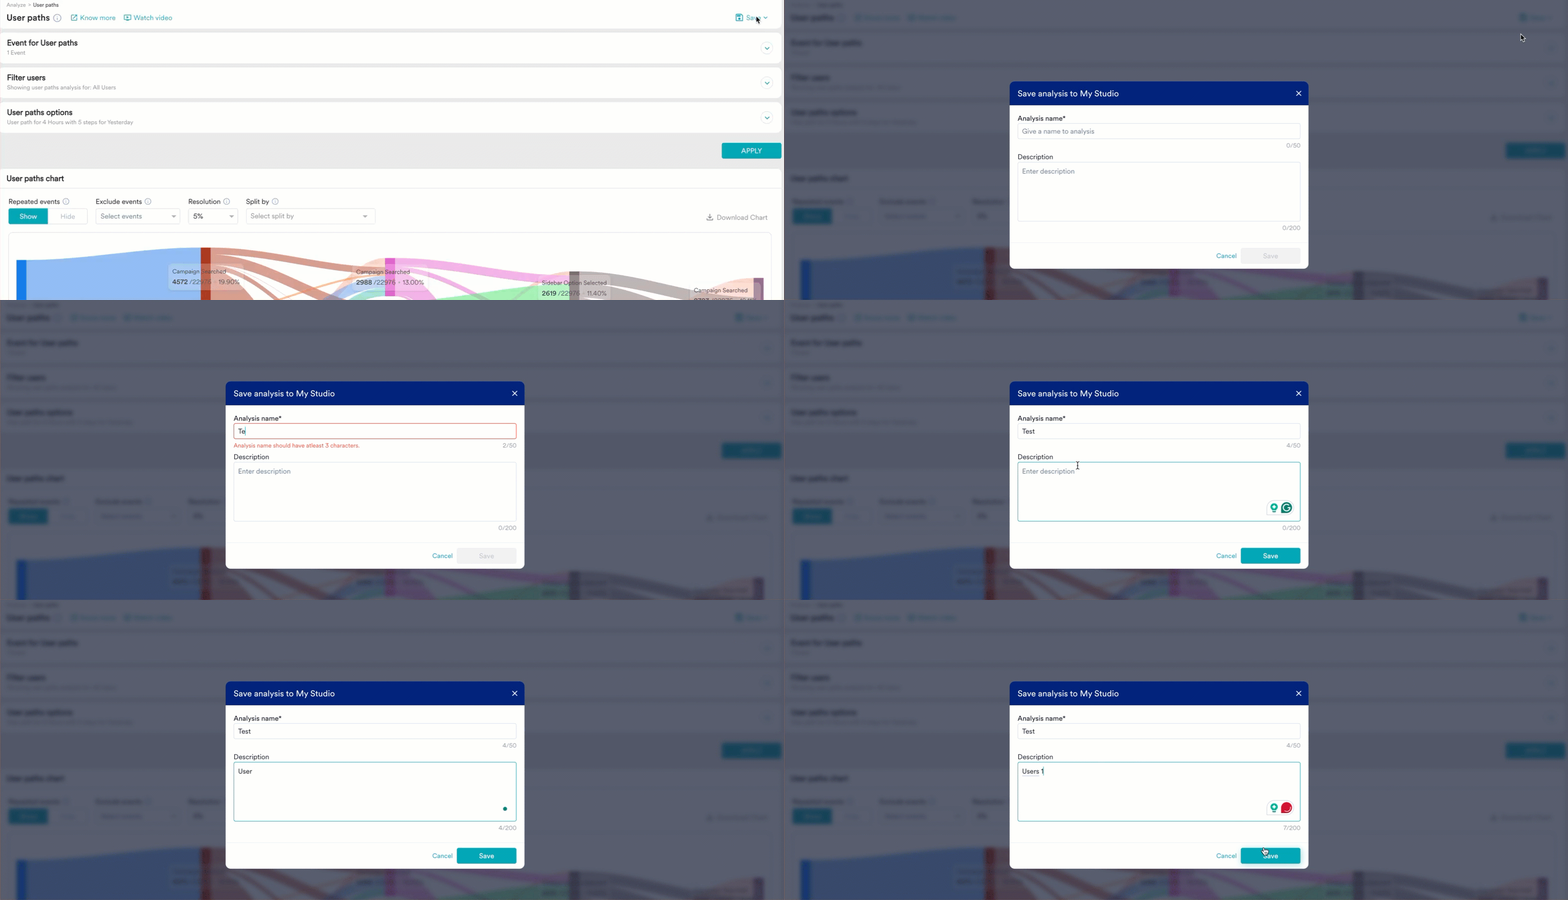
Your analysis is now ready. To access this later, you can save the analysis.
Perform the following steps to save your analysis:
1. Click the icon in the upper-right corner.
2. Click **Save to My Studio.**
3. Enter a name and description for your analysis.
4. Click **Save**.
# Save to My Studio
Your analysis is now ready. To access this later, you can save the analysis.
Perform the following steps to save your analysis:
1. Click the icon in the upper-right corner.
2. Click **Save to My Studio.**
3. Enter a name and description for your analysis.
4. Click **Save**.
 You can access the analysis by navigating to **Analyze** > **My Studio**.
# Next Steps
* [MoEngage Dashboards](/user-guide/analyze/dashboards/overview)
* [My Studio](/user-guide/analyze/dashboards/my-studio)
You can access the analysis by navigating to **Analyze** > **My Studio**.
# Next Steps
* [MoEngage Dashboards](/user-guide/analyze/dashboards/overview)
* [My Studio](/user-guide/analyze/dashboards/my-studio)