> ## Documentation Index
> Fetch the complete documentation index at: https://moengage.com/docs/llms.txt
> Use this file to discover all available pages before exploring further.
# Overview
> Overview of MoEngage dashboards for monitoring campaigns, tracking KPIs, and accessing pre-built or custom views for your analytics needs.
A dashboard is a landscape that displays all your analysis charts and tables, summarizing the most important data. It enables you to easily monitor the status of your marketing campaigns and other product initiatives. You can add your analysis reports and key performance indicators (KPIs) to your dashboard and save them, allowing you to check on them whenever you wish.
To access dashboards:
1. On the sidebar menu in MoEngage, hover over the **Dashboards**  menu item. The **Dashboards** menu appears.
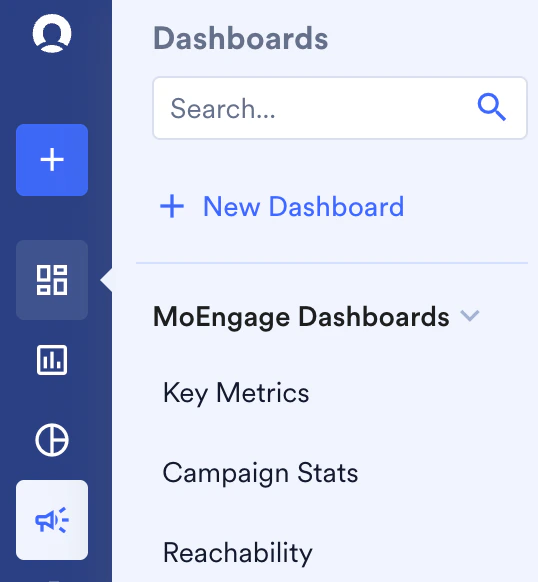 To get started quickly, MoEngage offers the following pre-built dashboards that meet basic analytics needs:
* [Key metrics](/user-guide/analyze/dashboards/key-metrics)
* [Campaign stats](/user-guide/analyze/dashboards/campaign-stats)
* [Best time analysis](/user-guide/analyze/dashboards/best-time-analysis)
* [Reachability](/user-guide/analyze/dashboards/reachability)
Before building your custom dashboard, let's learn more about what these dashboards offer.
To get started quickly, MoEngage offers the following pre-built dashboards that meet basic analytics needs:
* [Key metrics](/user-guide/analyze/dashboards/key-metrics)
* [Campaign stats](/user-guide/analyze/dashboards/campaign-stats)
* [Best time analysis](/user-guide/analyze/dashboards/best-time-analysis)
* [Reachability](/user-guide/analyze/dashboards/reachability)
Before building your custom dashboard, let's learn more about what these dashboards offer.