> ## Documentation Index
> Fetch the complete documentation index at: https://moengage.com/docs/llms.txt
> Use this file to discover all available pages before exploring further.
# Analyze Landing Pages
> Monitor landing page performance with metrics like visits, form submissions, and click rates in MoEngage. Identify what to optimize for results.
The analytics page gives you a clear view of how your landing pages are performing. You can track key metrics to see what's resonating with visitors and where improvements are needed. Use this data to see what aspect of the page needs improvements and then make changes to get better results.
# Accessing the Analytics Page
Upon successfully creating a landing page, you will be redirected to the analytics page. Alternatively, perform the following steps to access the analytics page:
1. On the left navigation menu in the MoEngage dashboard, click **Content**, and then click **Landing pages**.
2. Click the published landing page. You will be redirected to the analytics page.
# Landing Page Details
This section provides an overview of the landing page details, including:
* Name
* URL
* Creator of the landing page
* Landing page ID
* Creation time of the landing page
 Additionally, you can **Refresh**, **Duplicate**, and **Edit** the landing page from the upper-right corner.
# Analytics
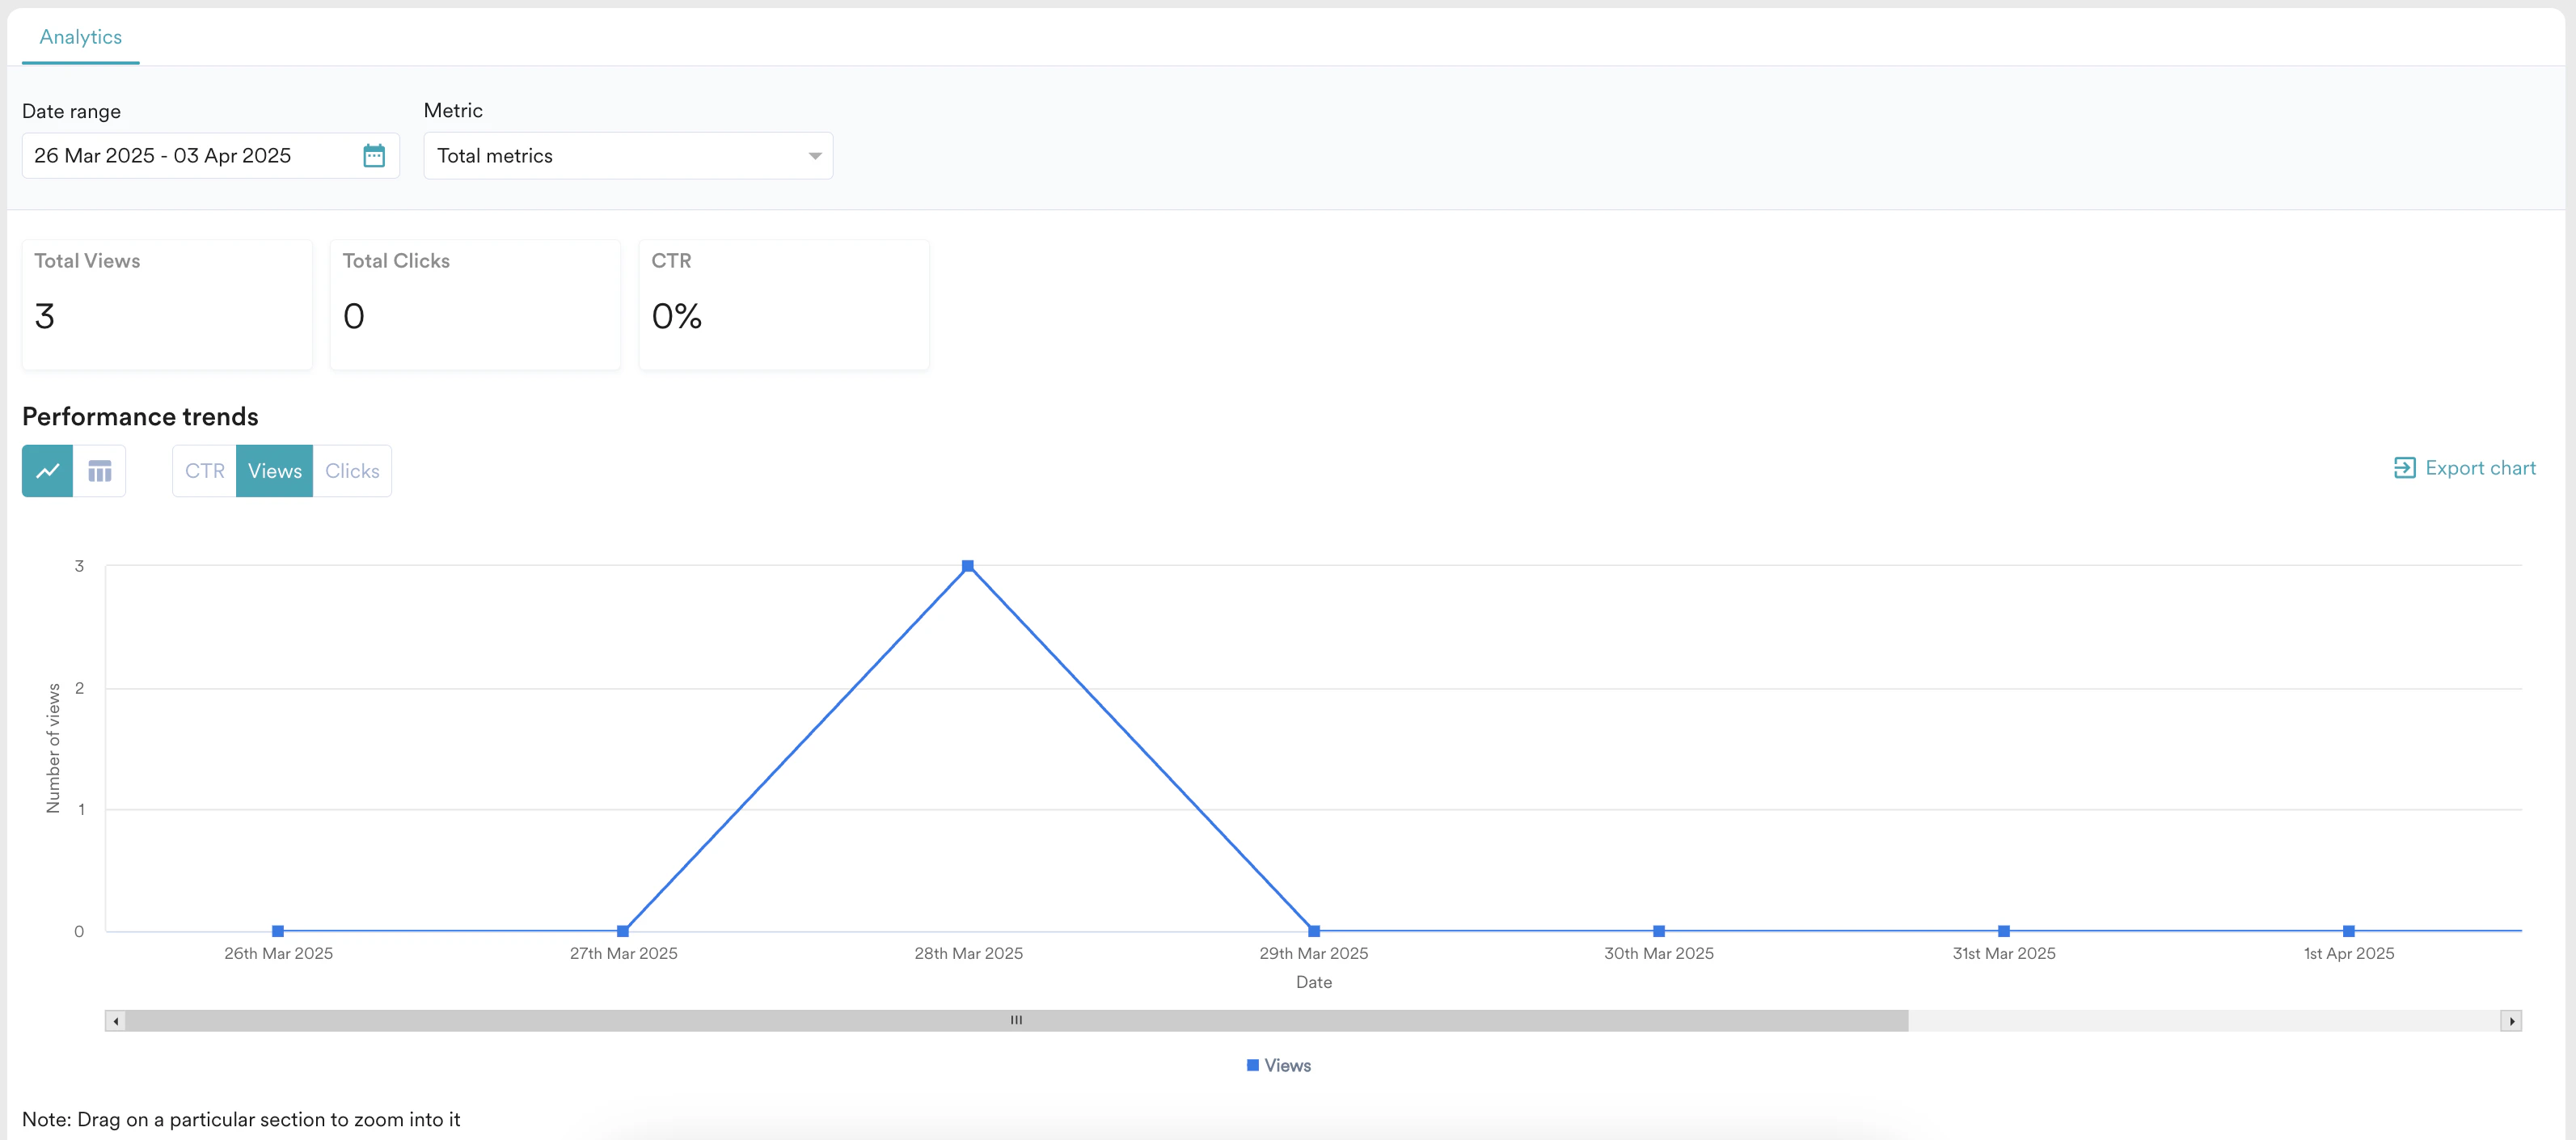
This section displays all the metrics for your landing page using the selected filters. You can view the following metrics:
* **Views**: Number of times the landing page was viewed by the users.
* **Clicks**: Number of times the landing page was clicked by the users.
* **CTR**: Click-through rate. This is calculated as CTR = (Clicks/Impressions)\*100.
Additionally, you can **Refresh**, **Duplicate**, and **Edit** the landing page from the upper-right corner.
# Analytics
This section displays all the metrics for your landing page using the selected filters. You can view the following metrics:
* **Views**: Number of times the landing page was viewed by the users.
* **Clicks**: Number of times the landing page was clicked by the users.
* **CTR**: Click-through rate. This is calculated as CTR = (Clicks/Impressions)\*100.
 ### Filters
You can filter the analytics by:
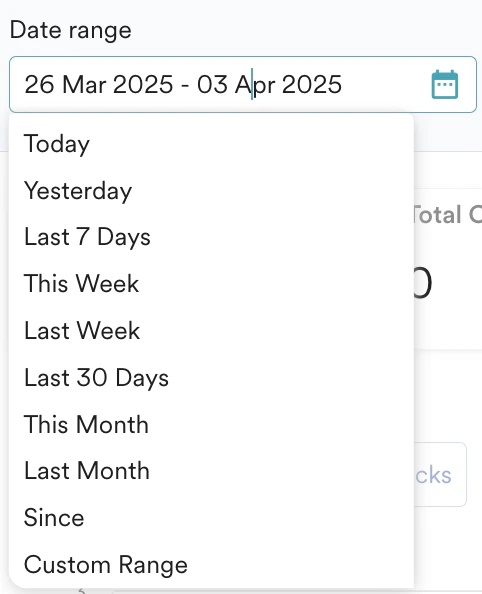
* **Date range**: The metrics will be displayed for the selected date range.
### Filters
You can filter the analytics by:
* **Date range**: The metrics will be displayed for the selected date range.
 * **Metric**: You can view the landing page metrics by:
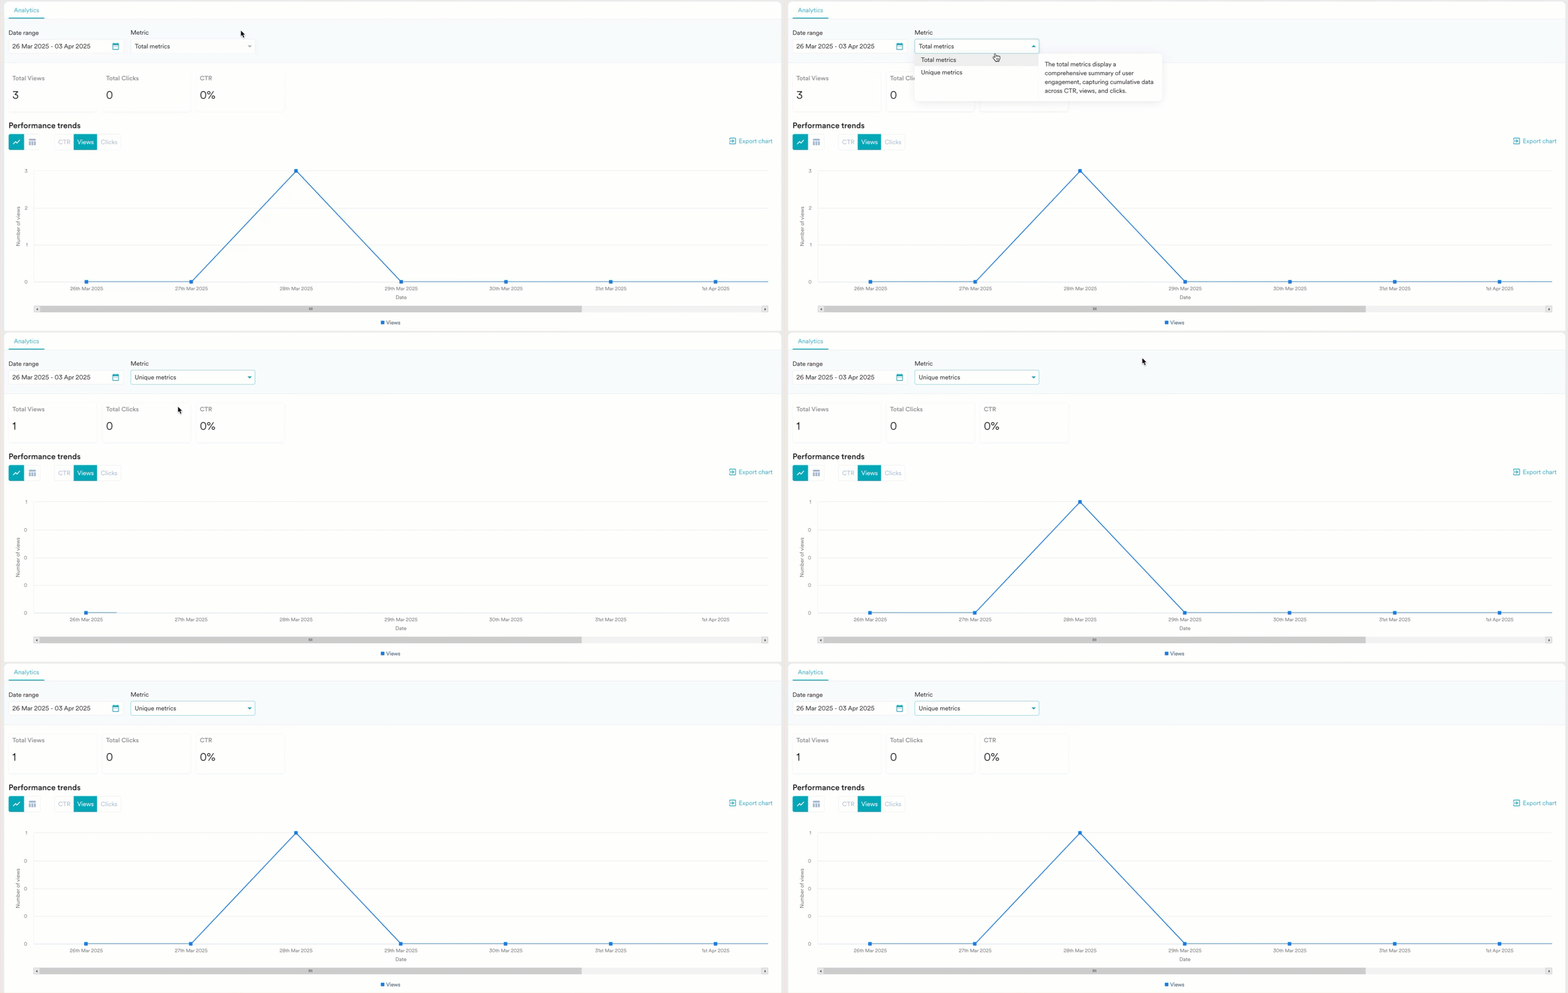 * **Total metrics**: This will display a comprehensive summary of user engagement across views, clicks, and CTR.
* **Unique metrics**: This will display the distinct count of individual user engagement across views, clicks, and CTR.
## Performance Trends
This section helps you visualize how the landing page metrics have varied over time. You can switch between Chart and Table views to better visualize the data, as shown below:
* **Total metrics**: This will display a comprehensive summary of user engagement across views, clicks, and CTR.
* **Unique metrics**: This will display the distinct count of individual user engagement across views, clicks, and CTR.
## Performance Trends
This section helps you visualize how the landing page metrics have varied over time. You can switch between Chart and Table views to better visualize the data, as shown below:
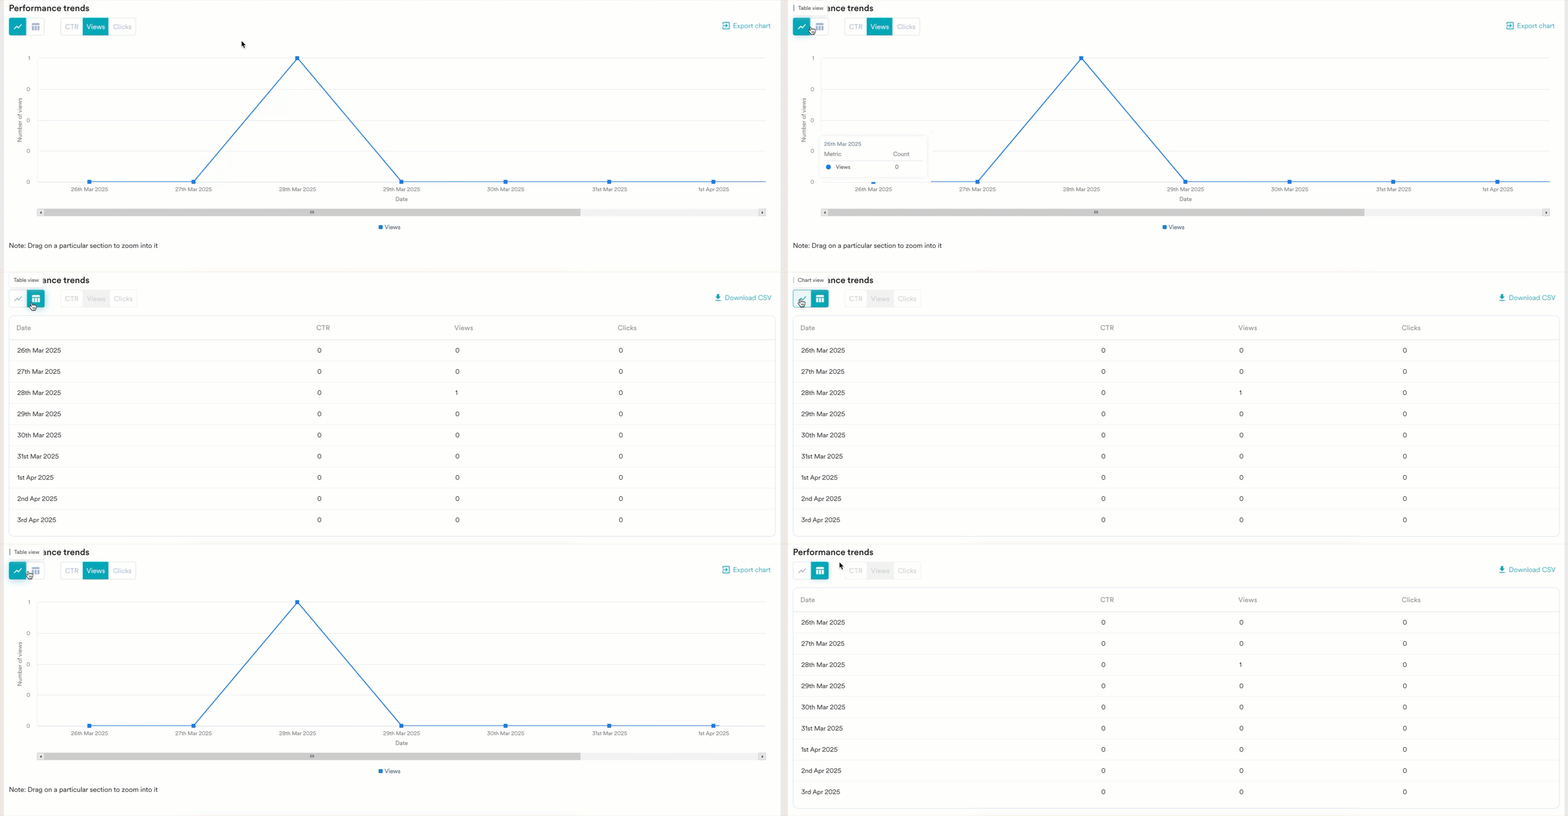 ### Chart View
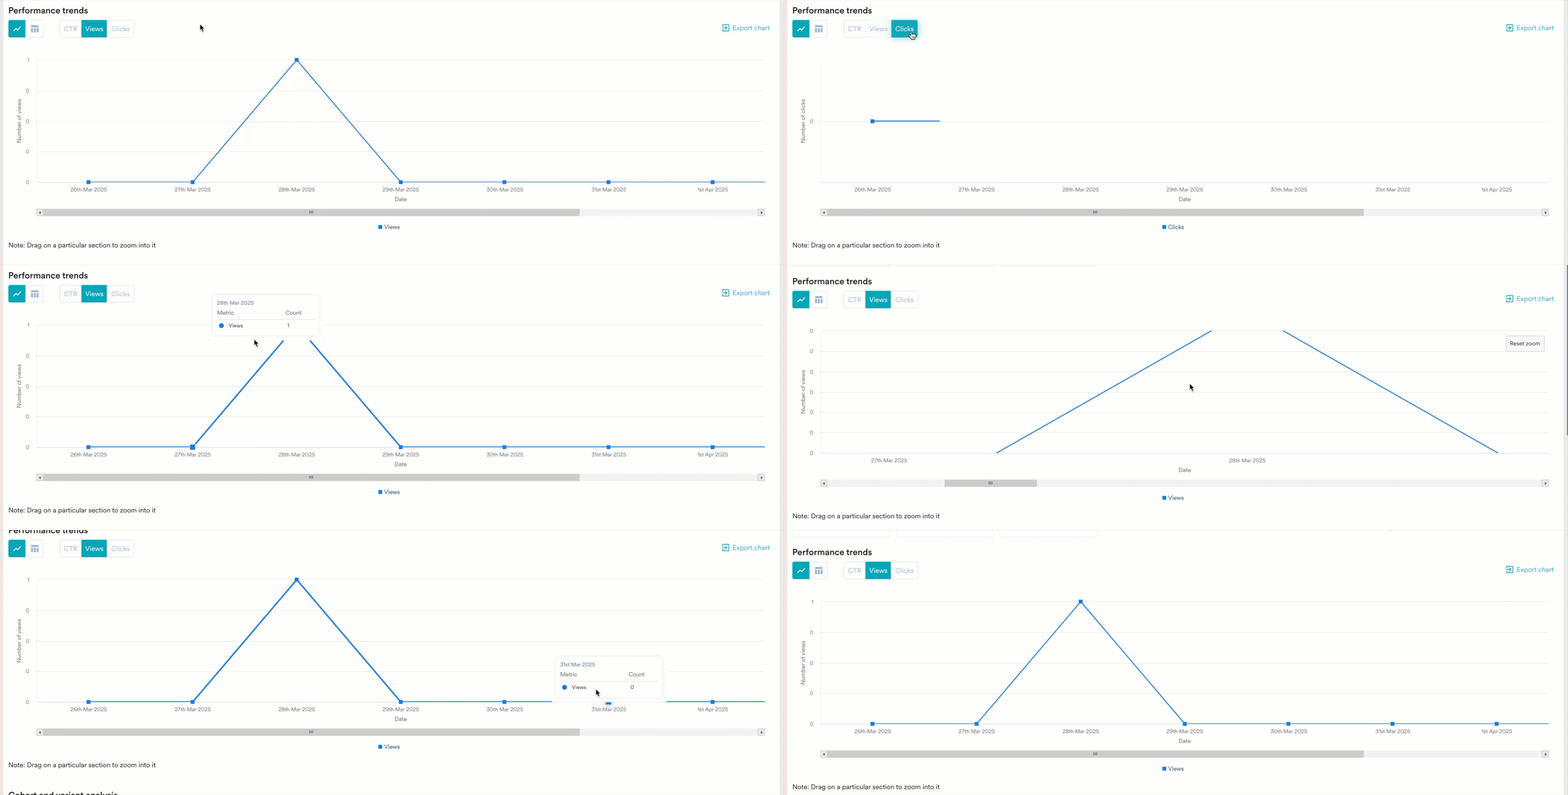 You can perform the following actions in the chart view:
* Visualize CTR, views, and clicks for landing page performance.
* Switch between individual metrics to visualize them separately.
* Zoom in on any section of the chart. To do so, click and drag over the area you wish to focus on.
* Download the chart. To do so, click **Export chart** in the upper-right corner.
### Table View
You can perform the following actions in the chart view:
* Visualize CTR, views, and clicks for landing page performance.
* Switch between individual metrics to visualize them separately.
* Zoom in on any section of the chart. To do so, click and drag over the area you wish to focus on.
* Download the chart. To do so, click **Export chart** in the upper-right corner.
### Table View
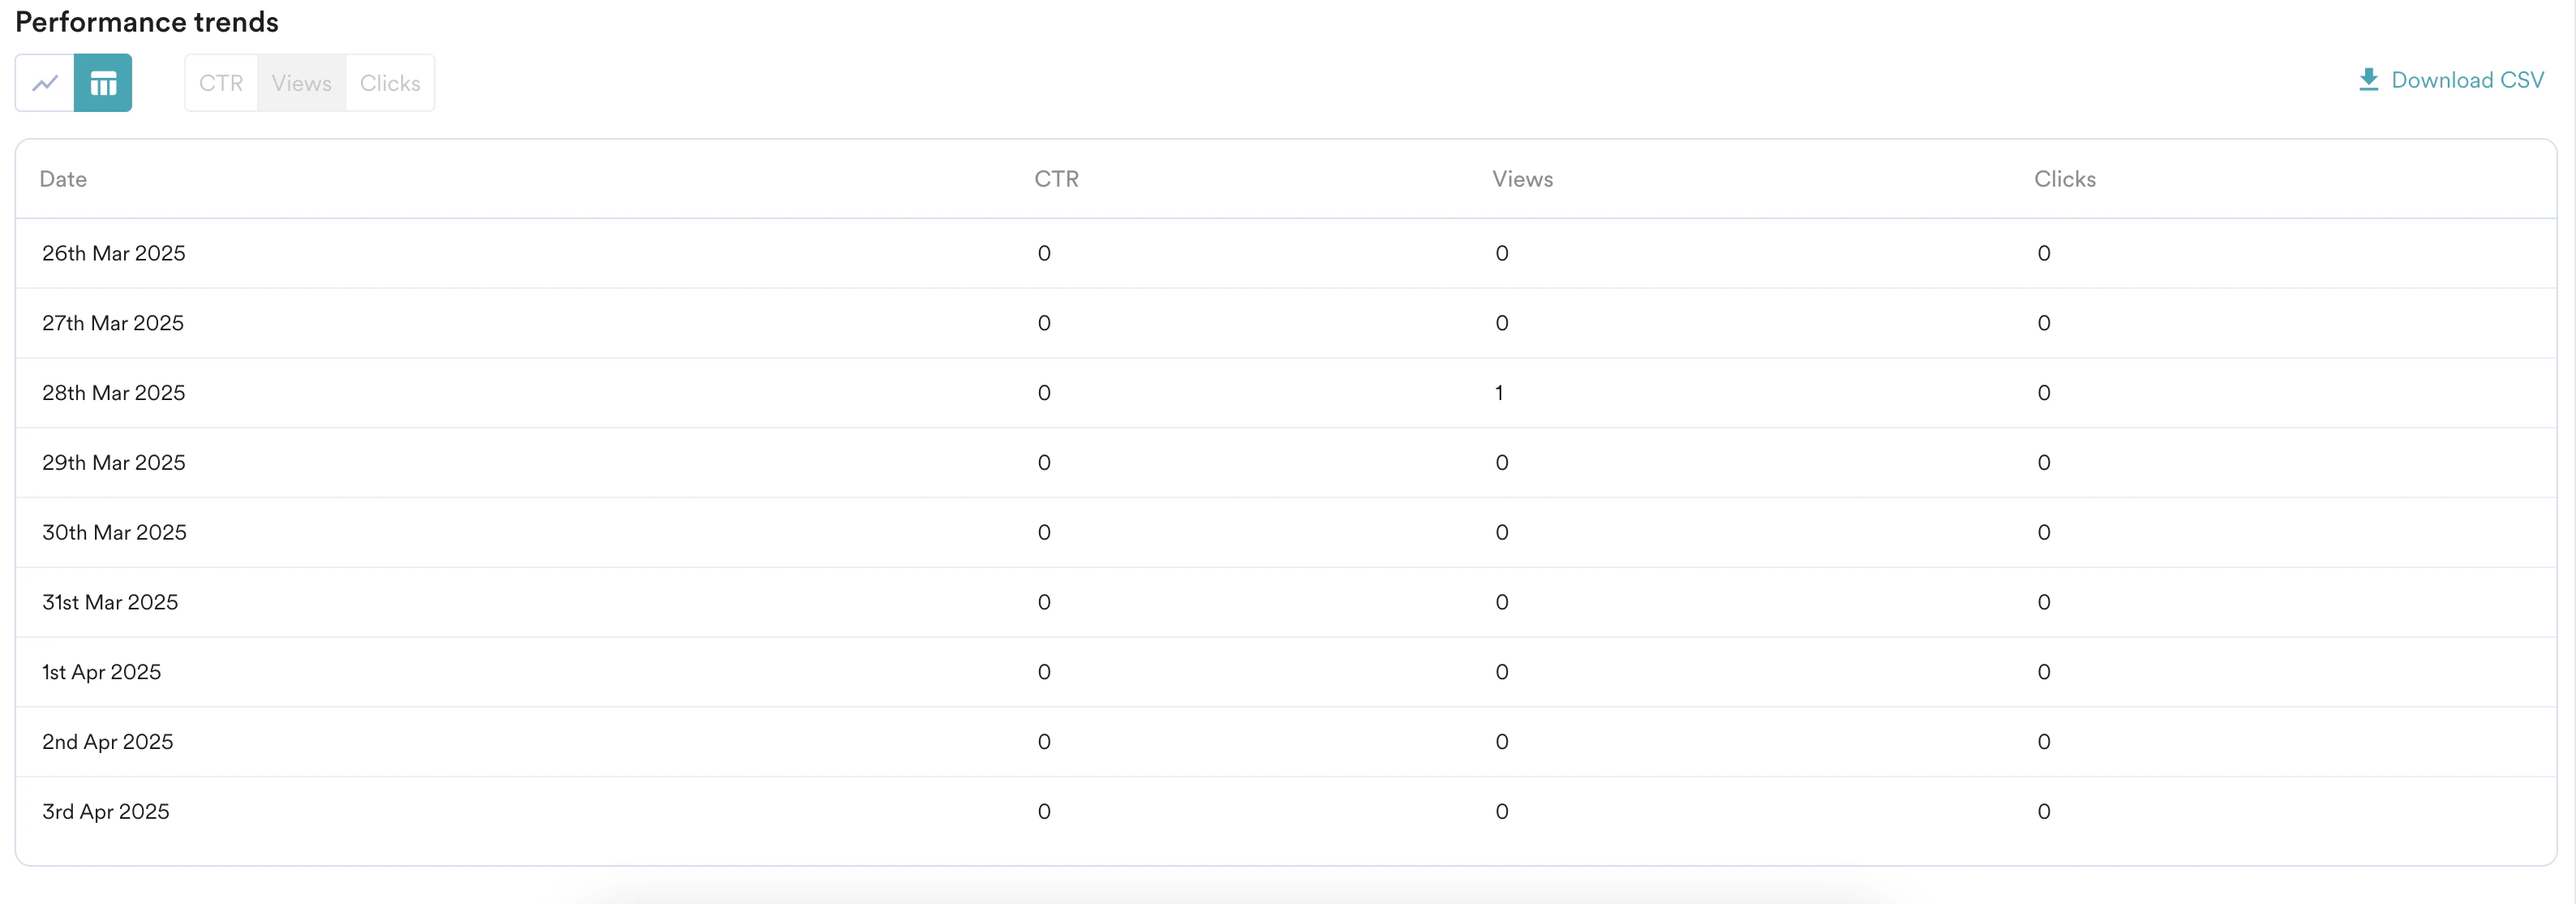 You can perform the following actions in the table view:
* View all the metrics in a tabular format. The metrics are presented by dates.
* You can export the table. To do so, click **Download CSV** in the upper-right corner.
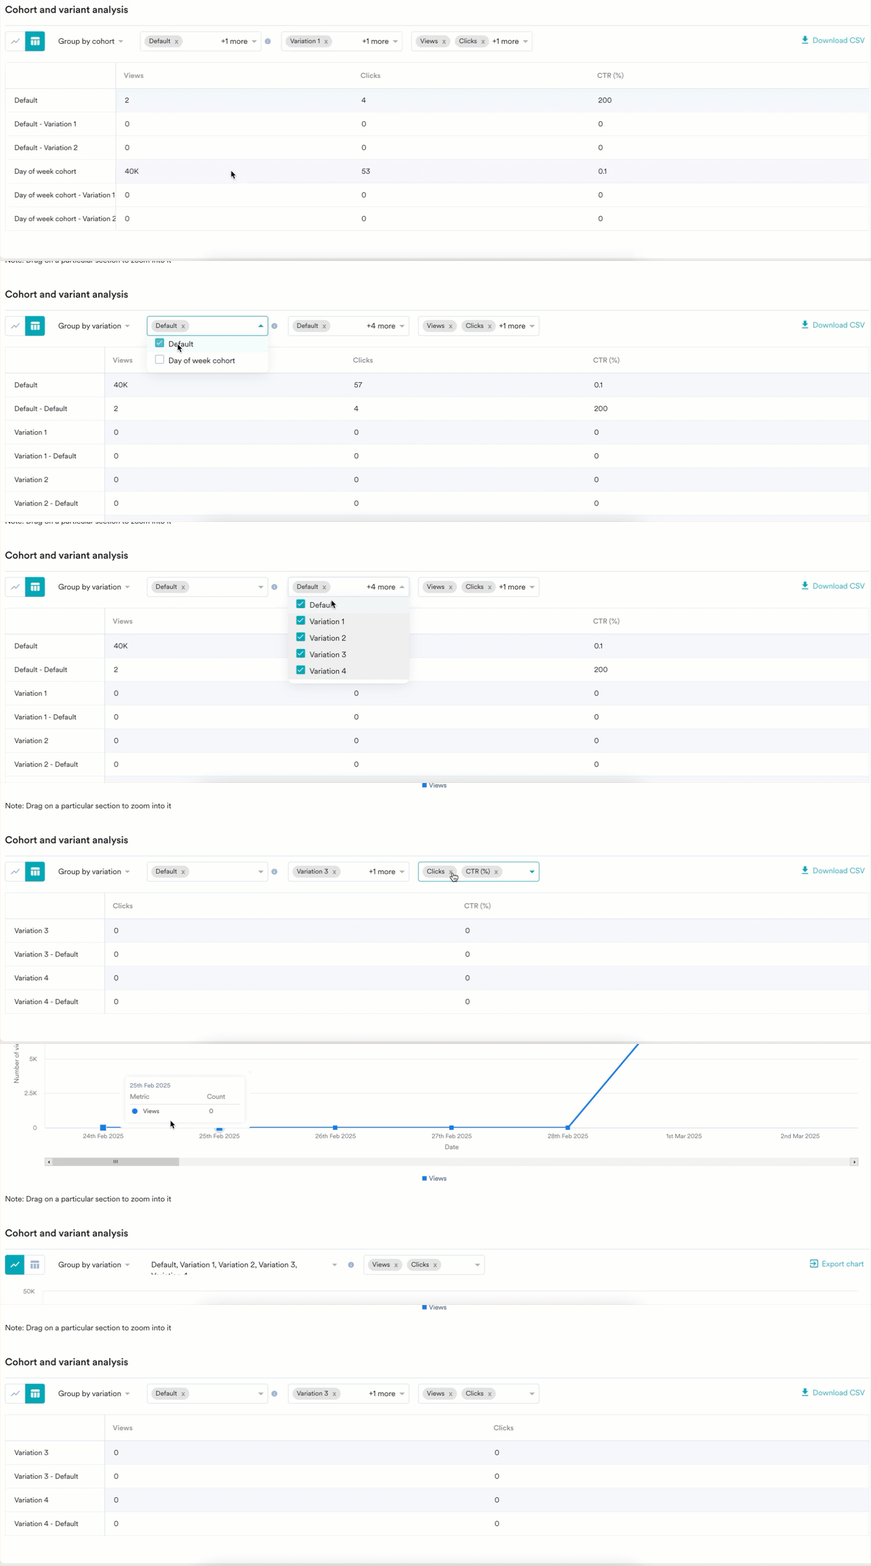
## Cohort and Variant Analysis
This section shows metrics for any variant of the cohorts created for your landing page.
You can perform the following actions in the table view:
* View all the metrics in a tabular format. The metrics are presented by dates.
* You can export the table. To do so, click **Download CSV** in the upper-right corner.
## Cohort and Variant Analysis
This section shows metrics for any variant of the cohorts created for your landing page.
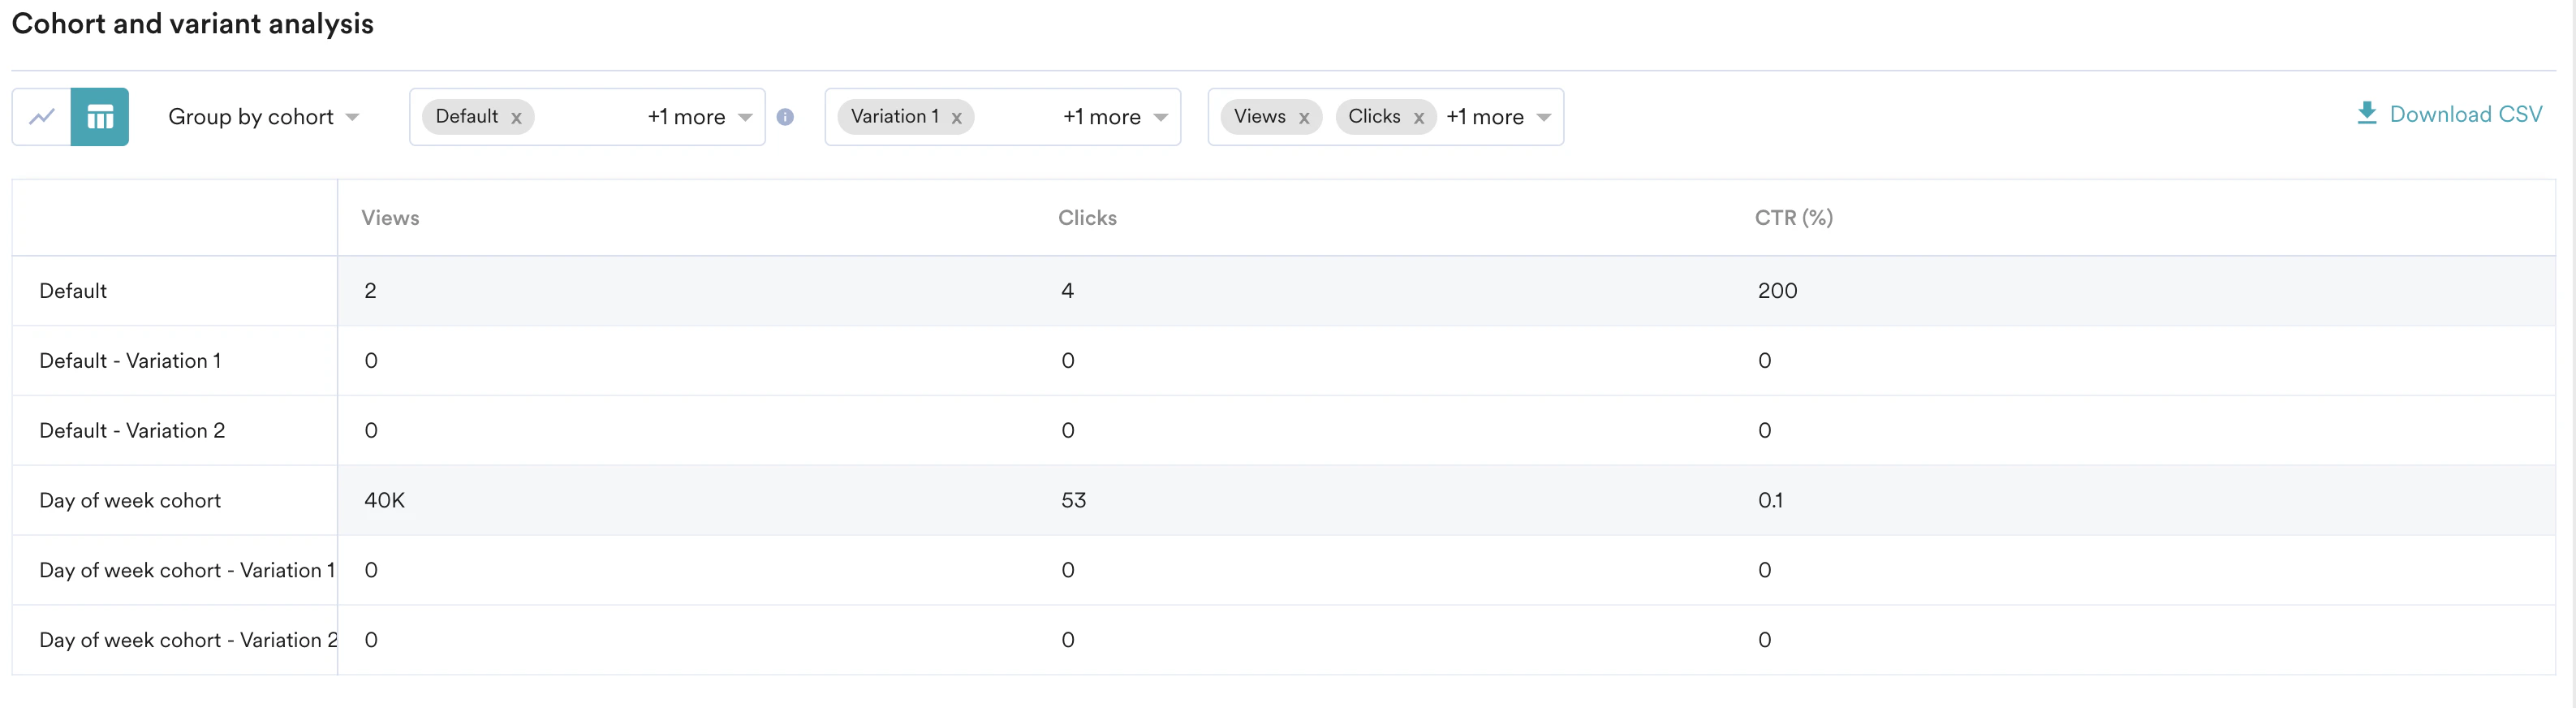 You can perform the following actions:
* Switch between table and chart views.
* Group the data by cohort or variants. These will be displayed on the rows.
* Select the desired metrics to view. These will be displayed on the columns.
* Download the chart and tables by clicking **Export chart** or **Download CSV,** respectively, in the upper-right corner.
You can perform the following actions:
* Switch between table and chart views.
* Group the data by cohort or variants. These will be displayed on the rows.
* Select the desired metrics to view. These will be displayed on the columns.
* Download the chart and tables by clicking **Export chart** or **Download CSV,** respectively, in the upper-right corner.