> ## Documentation Index
> Fetch the complete documentation index at: https://moengage.com/docs/llms.txt
> Use this file to discover all available pages before exploring further.
# Analyze the Volume of Data Exports
> Calculate and monitor your MoEngage data export volume. Track event counts exported via Streams or Data Warehouse Exports to manage monthly usage.
# Introduction
In this article, you will learn how to calculate/analyze the volume of events that were exported from your MoEngage App using either [Streams](https://www.moengage.com/docs/api/data/moengage-streams) or [Data Warehouse Exports](/user-guide/data/exports/events/data-warehouse). This can help you track the amount of data that you are receiving and your monthly export volume usage.
# Total Volume of Events Exported
Please contact your MoEngage Customer Success Manager for the total volume of events being exported.
# Calculate the Volume of Individual Events
In case you want a detailed event-wise breakdown of the total volume, you can calculate it. However, this is currently a manual process. Note that there can be some discrepancies between the number of events shown on the MoEngage Dashboard and the actual number of events received by you.
## Step 1: Get the List of Events Being Exported
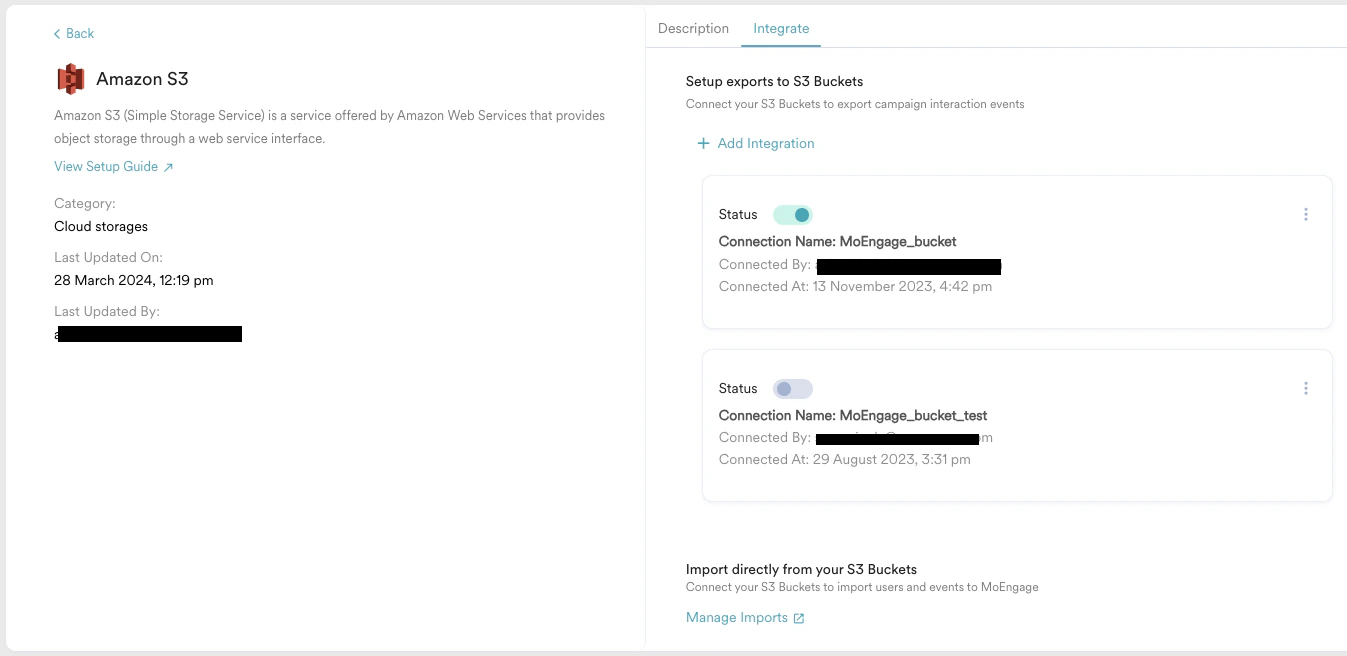
If you have set up automated exports through the App Marketplace, you can view all your exports on the **Integrate** tab on the Partner page. The following is an example for [S3 Exports](https://moengage.com/docs/user-guide/data/exports/events/data-warehouse/s3-exports):
1. On your MoEngage Dashboard go to **App Marketplace** > **Amazon S3** > **Integrate**.
2. View the list of integrations you have currently active:
3. Click the three dots on the integration card, and click **Edit**.
4. Under **Export Details**, look at the **Select events** option:
1. All Events: If you have selected *All events*, getting a breakdown for each event might be a more time-consuming task.
2. Selected events: If you have selected a few events you want to export, make a list of these events. You will need this list later.
If you have set up Streams for your account, you can speak to your Customer Success Manager for the latest configuration.
## Step 2: Analyze the Volume of Each Event Exported
With MoEngage Analytics, you can obtain a comprehensive breakdown of the total count for each event. As and when MoEngage receives an event, it is forwarded to your destination without any modifications. This ensures that the volume of events displayed on the MoEngage Dashboard accurately corresponds to the volume of events received by you.
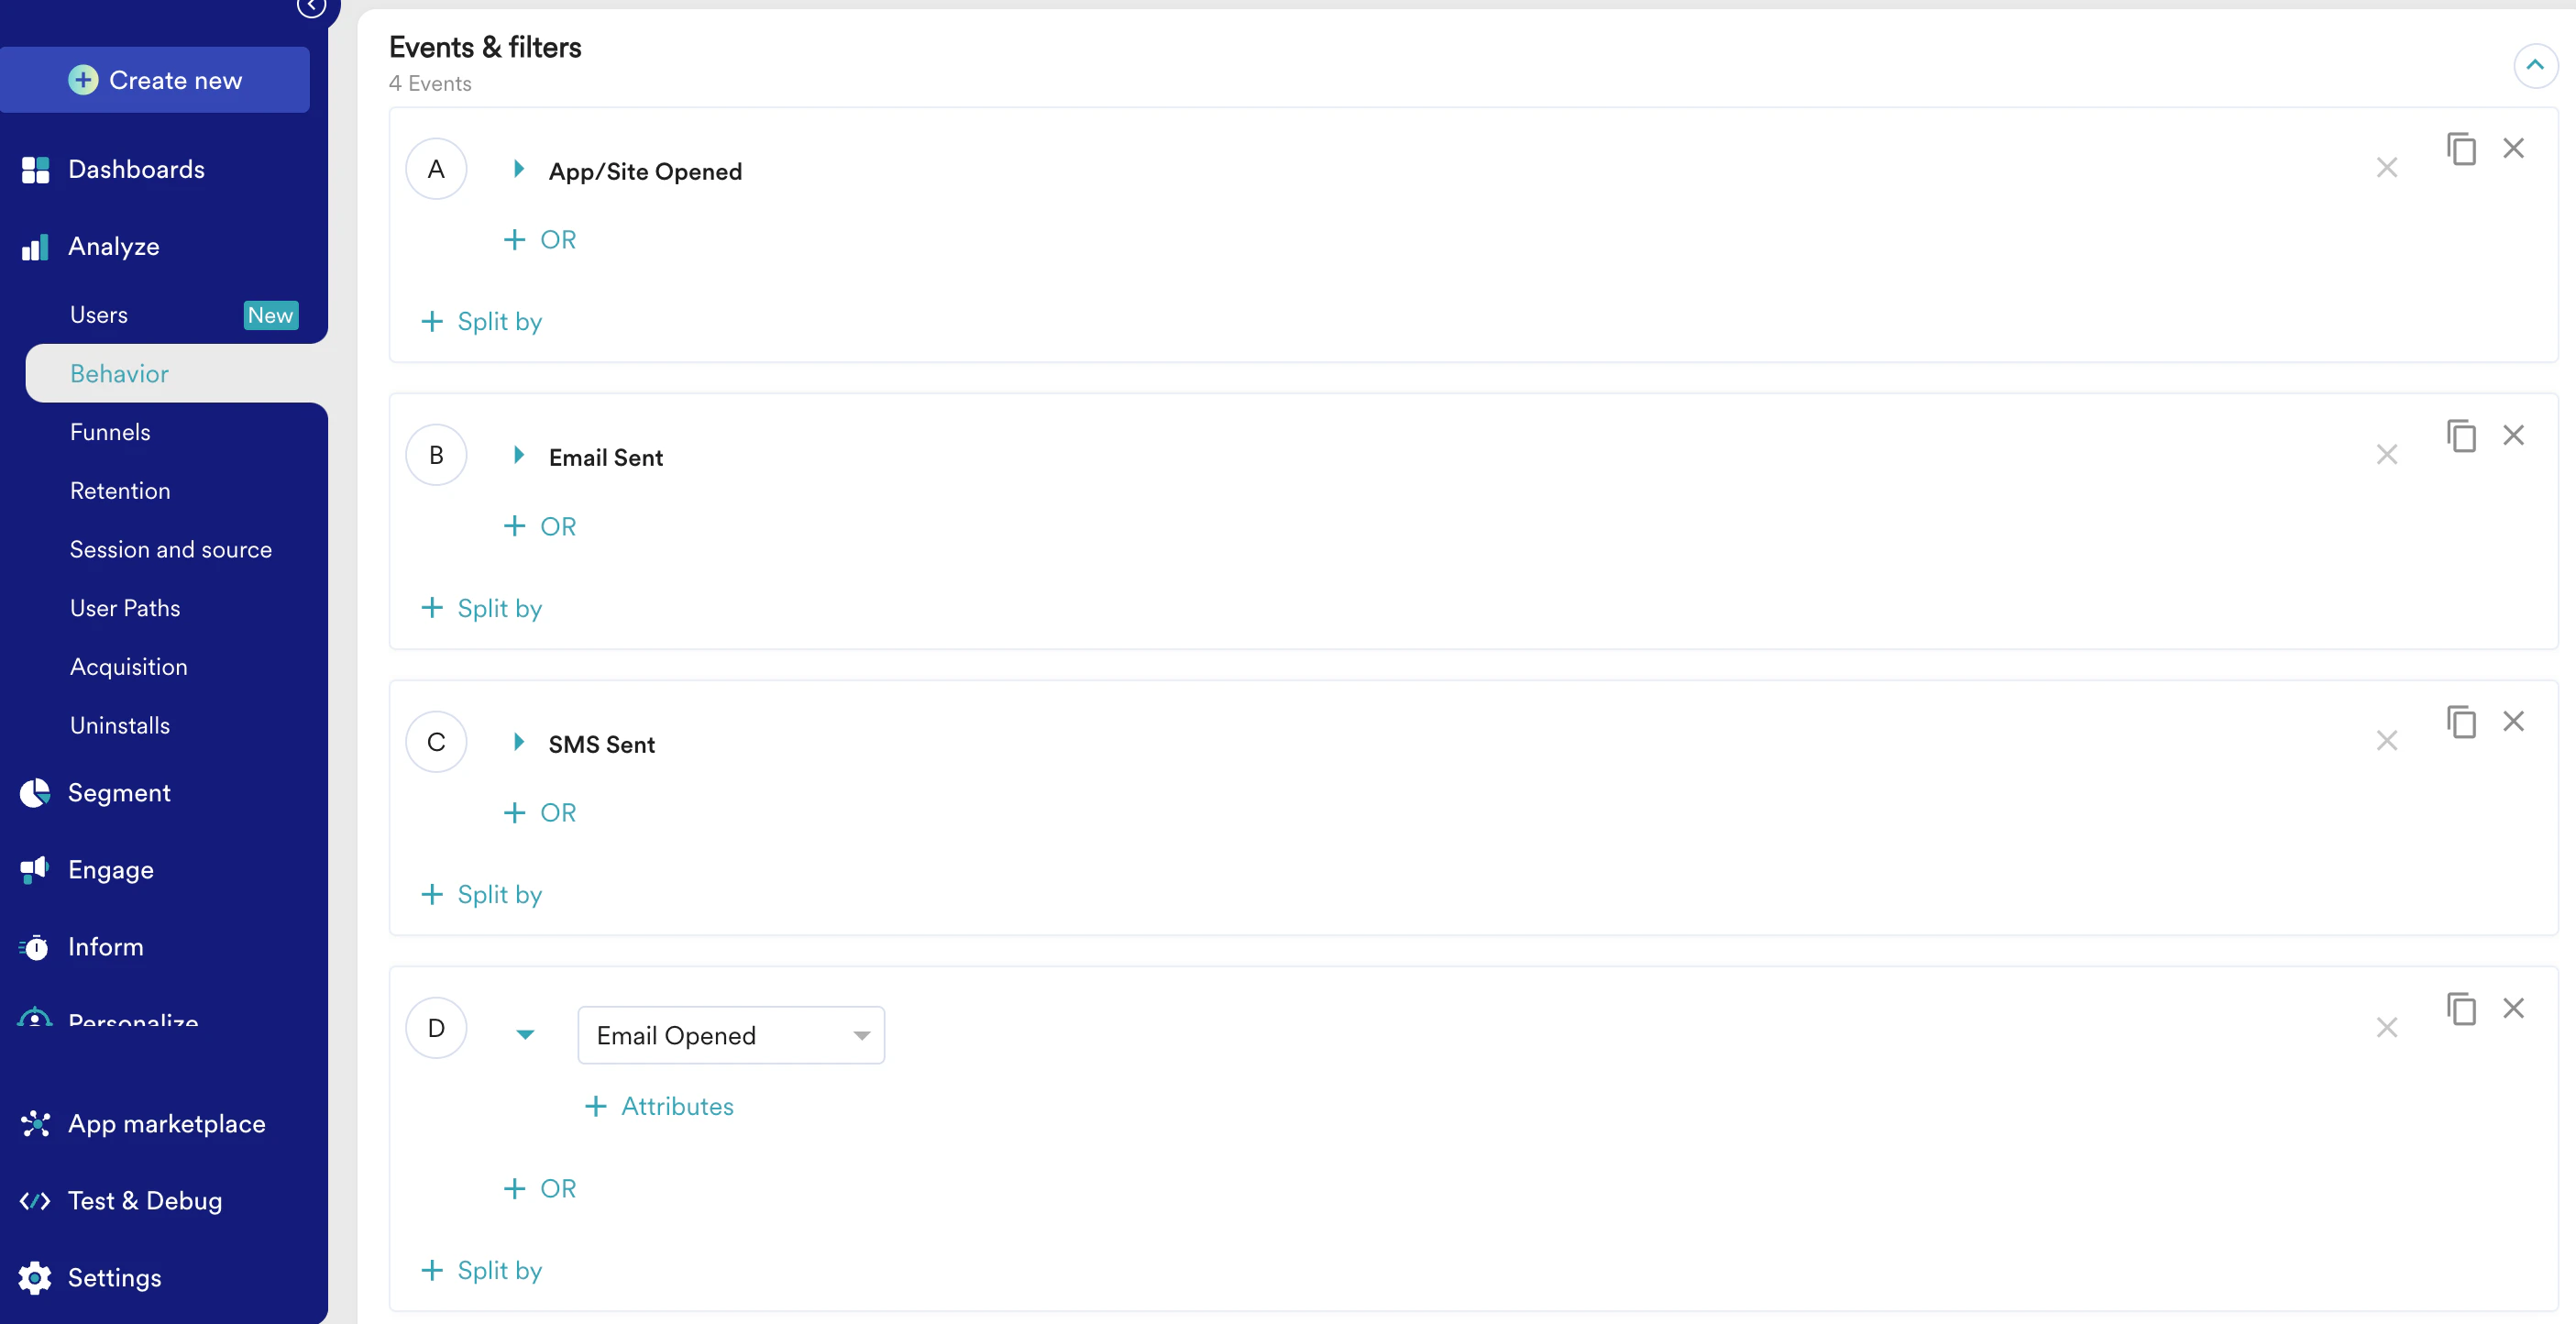
1. On your MoEngage Dashboard go to **Analyze** > **Behavior**.
2. Select your events from the list of events being exported. Click **+ Add Event** to add multiple events. A breakdown of 10 events at a time will be provided:
3. Under **Filter Users**, select **All Users**.
4. Under **Behavior Options**, select **Total Events**.
5. Set the duration as the duration you want to check. Typically, this is a window of 30 days.
6. Click **Apply** when ready to see your report.
7. After your results are loaded, look at the Behavior Table:
8. If your second column is not "Sum", you can click the down arrow next to the column and select "Sum". This should show the total number of events that have occurred in the selected period.
9. Click **Download CSV** to export this report.
10. Repeat this process for all the events you are exporting. We suggest that you monitor only events that highly impact your analysis such as "Email Sent", "Email Opened", and so on.
The report on the MoEngage Dashboard is in the App Timezone. MoEngage Automated Data Exports happen in the UTC Timezone. Please account for this difference when you are generating reports at your end.
 3. Click the three dots on the integration card, and click **Edit**.
4. Under **Export Details**, look at the **Select events** option:
1. All Events: If you have selected *All events*, getting a breakdown for each event might be a more time-consuming task.
2. Selected events: If you have selected a few events you want to export, make a list of these events. You will need this list later.
3. Click the three dots on the integration card, and click **Edit**.
4. Under **Export Details**, look at the **Select events** option:
1. All Events: If you have selected *All events*, getting a breakdown for each event might be a more time-consuming task.
2. Selected events: If you have selected a few events you want to export, make a list of these events. You will need this list later.
 3. Under **Filter Users**, select **All Users**.
4. Under **Behavior Options**, select **Total Events**.
5. Set the duration as the duration you want to check. Typically, this is a window of 30 days.
6. Click **Apply** when ready to see your report.
7. After your results are loaded, look at the Behavior Table:
3. Under **Filter Users**, select **All Users**.
4. Under **Behavior Options**, select **Total Events**.
5. Set the duration as the duration you want to check. Typically, this is a window of 30 days.
6. Click **Apply** when ready to see your report.
7. After your results are loaded, look at the Behavior Table: 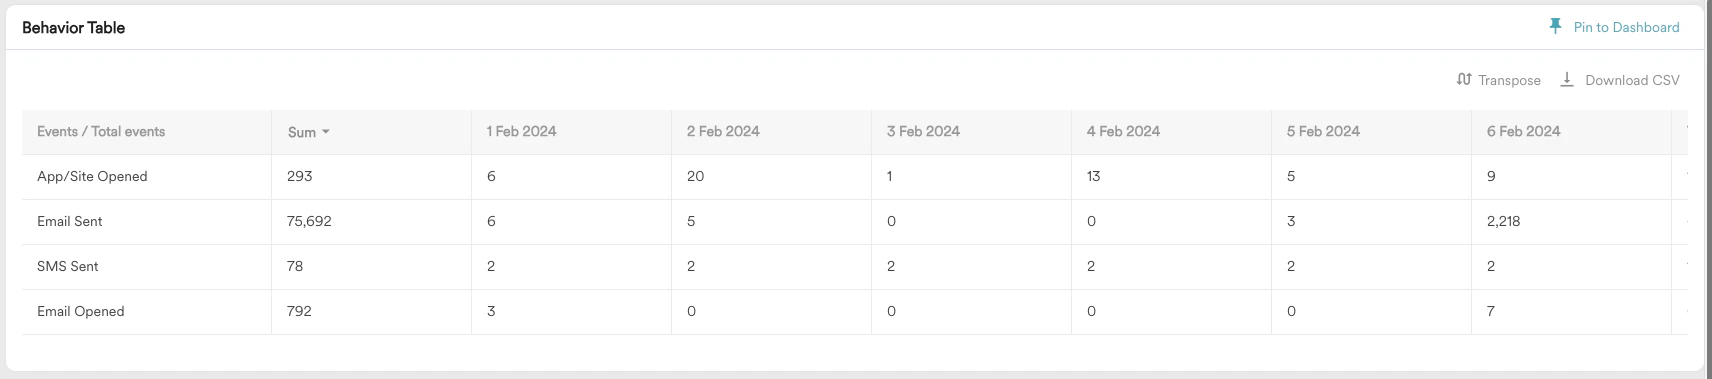 8. If your second column is not "Sum", you can click the down arrow next to the column and select "Sum". This should show the total number of events that have occurred in the selected period.
9. Click **Download CSV** to export this report.
10. Repeat this process for all the events you are exporting. We suggest that you monitor only events that highly impact your analysis such as "Email Sent", "Email Opened", and so on.
8. If your second column is not "Sum", you can click the down arrow next to the column and select "Sum". This should show the total number of events that have occurred in the selected period.
9. Click **Download CSV** to export this report.
10. Repeat this process for all the events you are exporting. We suggest that you monitor only events that highly impact your analysis such as "Email Sent", "Email Opened", and so on.