> ## Documentation Index
> Fetch the complete documentation index at: https://moengage.com/docs/llms.txt
> Use this file to discover all available pages before exploring further.
# Experience Analytics
> Review impressions, clicks, and conversion data for your MoEngage Personalize experiences using the updated analytics dashboard interface.
Experience analytics provide important information regarding how the Experience performed regarding impressions, clicks, and conversions. This information helps you improve the performance and value of your business metrics.
# Access the Experience Analytics Page
To access the Experience Analytics page, perform the following steps:
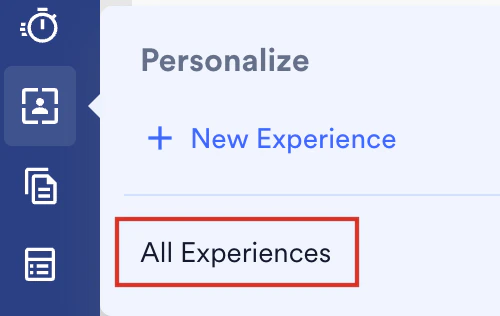
1. On the sidebar menu in MoEngage, hover over the Personalize menu item  . The **Personalize** menu appears.
2. Click **All Experiences**.
. The **Personalize** menu appears.
2. Click **All Experiences**.
 3. Click the desired experience for which you wish to see the analytics information.\
The following sections are available on the new screen:
* [Experience Details](#experience-details)
* [Analytics](#analytics)
* [Experience performance stats](/docs/user-guide/personalize/client-side-personalization/client-side-personalization/experience-analytics)
* [Audience/Variation performance](/docs/user-guide/personalize/client-side-personalization/client-side-personalization/experience-analytics)
* [Conversion goal performance](/docs/user-guide/personalize/client-side-personalization/client-side-personalization/experience-analytics)
* [Click Analysis](#Click-Analysis)
* [Info](#info)
## Experience Details
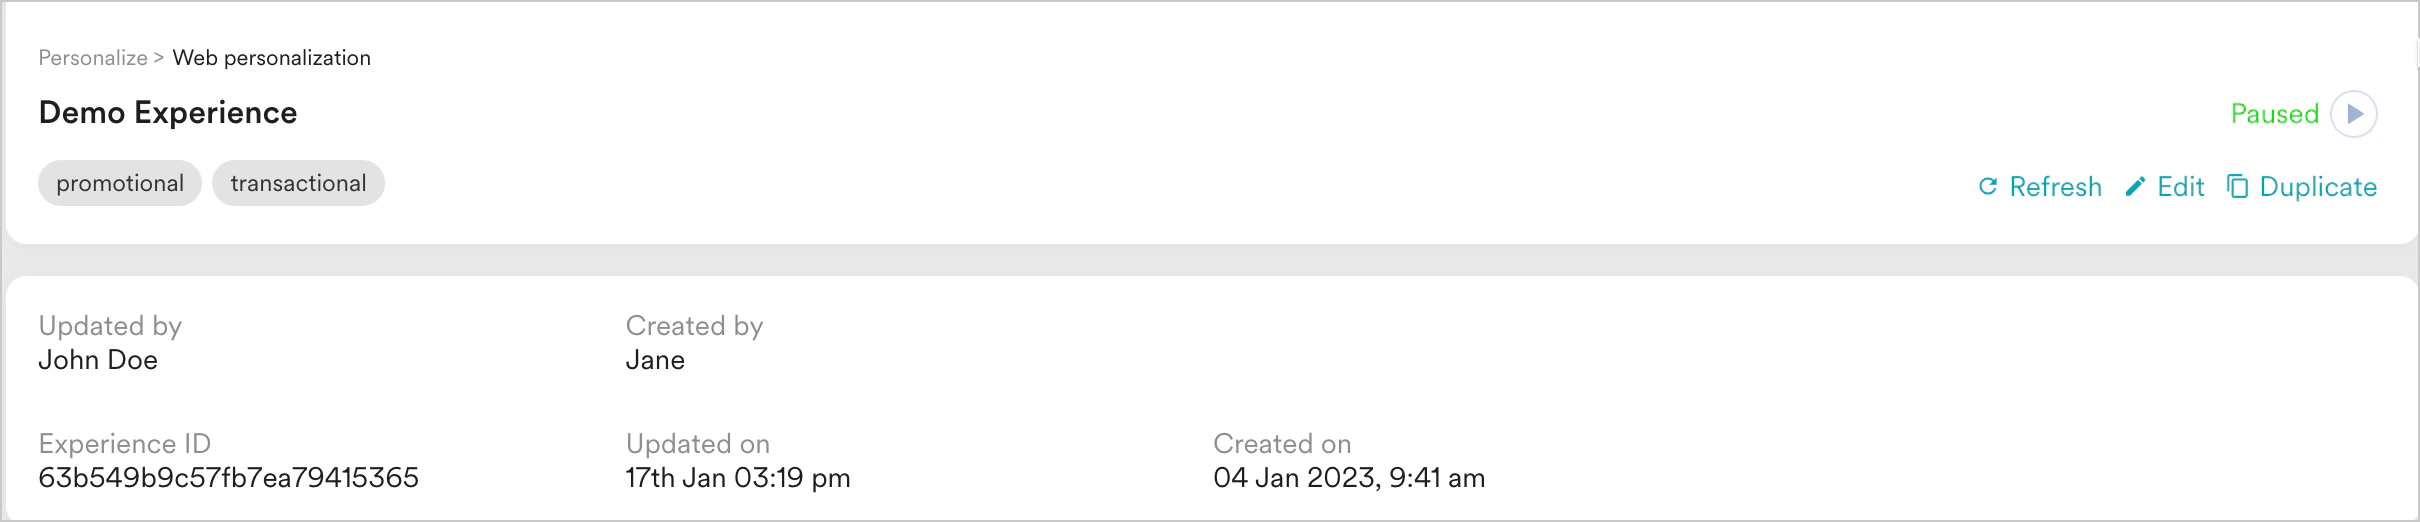
This section contains the following information:
* Experience Type and name
* Experience ID
* Experience creation and updation period
* Users who created and updated the Experience
* Experience status (*Active*, *Expired*, *Paused*, and **Scheduled)**
* Option to **refresh/edit/duplicate/pause/resume** the campaign
#
3. Click the desired experience for which you wish to see the analytics information.\
The following sections are available on the new screen:
* [Experience Details](#experience-details)
* [Analytics](#analytics)
* [Experience performance stats](/docs/user-guide/personalize/client-side-personalization/client-side-personalization/experience-analytics)
* [Audience/Variation performance](/docs/user-guide/personalize/client-side-personalization/client-side-personalization/experience-analytics)
* [Conversion goal performance](/docs/user-guide/personalize/client-side-personalization/client-side-personalization/experience-analytics)
* [Click Analysis](#Click-Analysis)
* [Info](#info)
## Experience Details
This section contains the following information:
* Experience Type and name
* Experience ID
* Experience creation and updation period
* Users who created and updated the Experience
* Experience status (*Active*, *Expired*, *Paused*, and **Scheduled)**
* Option to **refresh/edit/duplicate/pause/resume** the campaign
#  ## Analytics
The following metrics in this section display the various statistics and revenue metrics tracked for the selected experience:
## Analytics
The following metrics in this section display the various statistics and revenue metrics tracked for the selected experience:
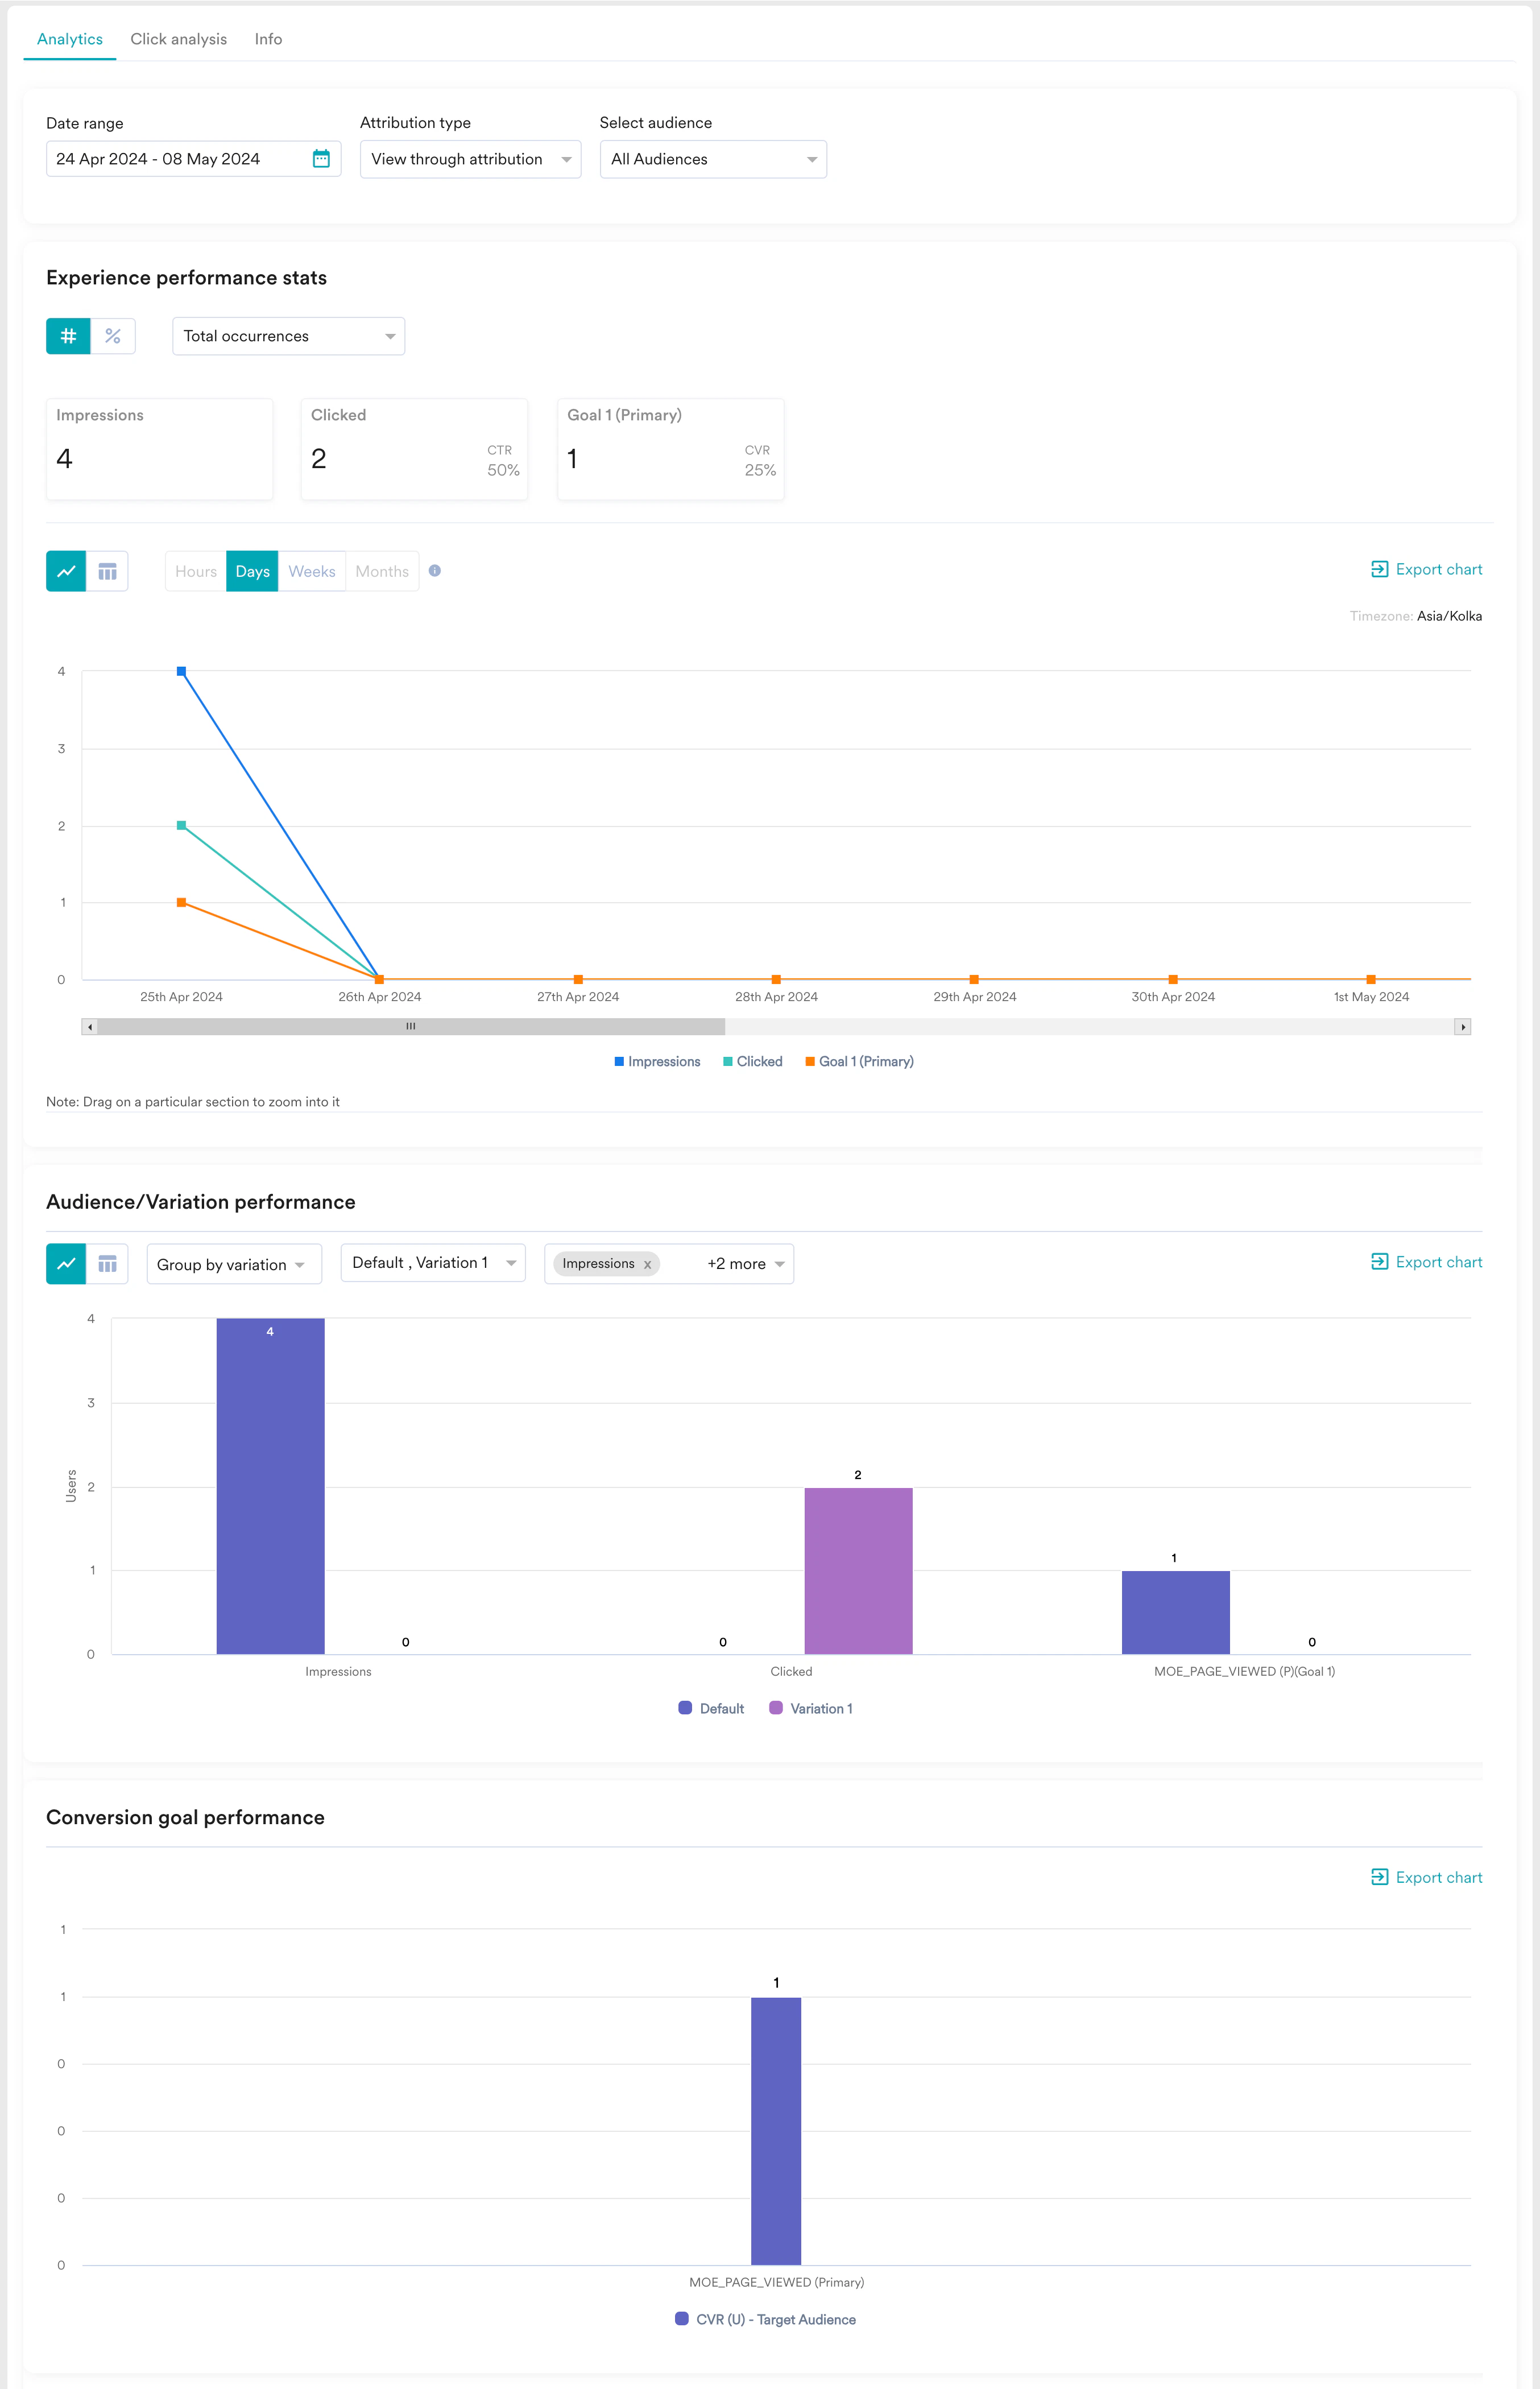 * **Date range** - The period for which the campaign will be tracked.
* **Attribution type** - Displays the campaign statistics based on the attribute selected from the dropdown. To attribute conversions to this campaign, MoEngage supports three different models as described below:
Click Through In-session View Through
The Click-Through Attribution is the number of conversion goals executed by users who clicked the CTA configured in the visual editor within the configured attribution window from the time of click. For example, if the user is delivered a web experience at 7 AM and clicks the CTA at 8 AM, and your Attribution window is 12 hours, the user conversion events until 8 pm are attributed to this experience in Click-Through Attribution.
The In-session attribution is based on In-session tracking. The in-session attribution is the number of conversion goals executed by users within 30 minutes after clicking the CTA configured in the visual editor. For example, If the user is delivered a web experience at 7 AM and clicks the CTA at 8 AM, and your Attribution window is 12 hours, the user conversion events till 8:30 am (within 30 minutes of starting the session) will be attributed to this experience in In-Session Attribution.
The View Through attribution is an Impression-based tracking method and is displayed by default when experience analytics is loaded. View-through attribution is the total number of conversion goals executed by users who were delivered a personalized web experience within the configured attribution window from the time of viewing the experience. This appears as a default filter in your Experience Performance. For example, If the user was delivered a web experience for a URL at 7 AM and the Attribution window for the experience was 12 hours, the user conversion events till 7 PM will be attributed to this experience using View-Through Attribution.
###
* **Select audience** - By default, MoEngage filters the Experience analytics for **All Users**. However, you can select your target audience from the dropdown that you configured while creating the Experience to examine the relevant analytics.
All the metrics are calculated and displayed in the App's Timezone.
### Experience Performance Stats
Experience performance provides the impact of your experience on your users and enables you to examine more concise data by selecting a certain Time Scale (in Hours, Days, Weeks, and Months) within the chosen period.
You can also switch between the graphical and tabular representation of the campaign statistics.
**Actions that can be performed in the stats section:**
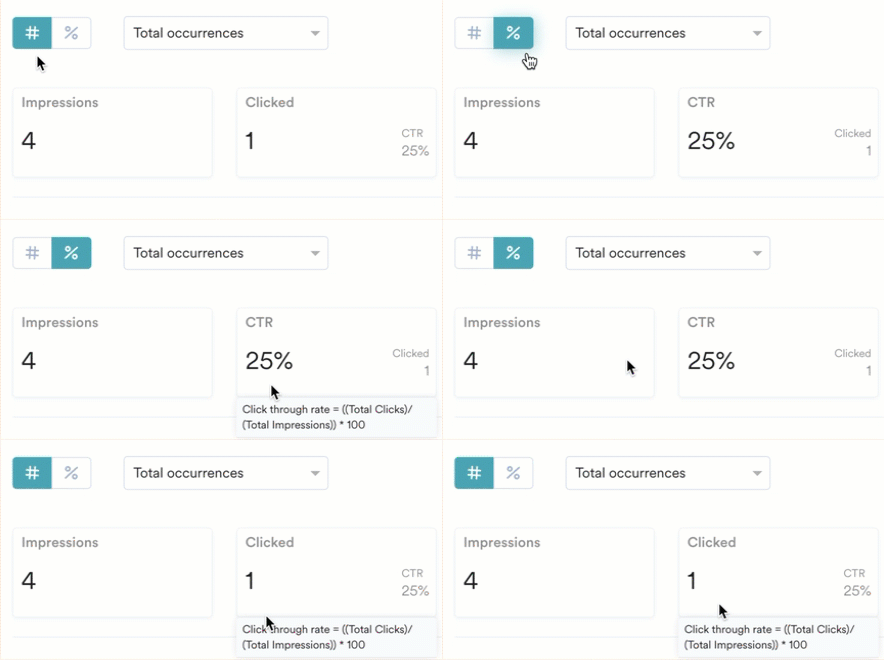
* Choose the *number view* *(#)* or the *percentage view* *(%)* to see the stats as numbers or percentage values.
* **Date range** - The period for which the campaign will be tracked.
* **Attribution type** - Displays the campaign statistics based on the attribute selected from the dropdown. To attribute conversions to this campaign, MoEngage supports three different models as described below:
Click Through In-session View Through
The Click-Through Attribution is the number of conversion goals executed by users who clicked the CTA configured in the visual editor within the configured attribution window from the time of click. For example, if the user is delivered a web experience at 7 AM and clicks the CTA at 8 AM, and your Attribution window is 12 hours, the user conversion events until 8 pm are attributed to this experience in Click-Through Attribution.
The In-session attribution is based on In-session tracking. The in-session attribution is the number of conversion goals executed by users within 30 minutes after clicking the CTA configured in the visual editor. For example, If the user is delivered a web experience at 7 AM and clicks the CTA at 8 AM, and your Attribution window is 12 hours, the user conversion events till 8:30 am (within 30 minutes of starting the session) will be attributed to this experience in In-Session Attribution.
The View Through attribution is an Impression-based tracking method and is displayed by default when experience analytics is loaded. View-through attribution is the total number of conversion goals executed by users who were delivered a personalized web experience within the configured attribution window from the time of viewing the experience. This appears as a default filter in your Experience Performance. For example, If the user was delivered a web experience for a URL at 7 AM and the Attribution window for the experience was 12 hours, the user conversion events till 7 PM will be attributed to this experience using View-Through Attribution.
###
* **Select audience** - By default, MoEngage filters the Experience analytics for **All Users**. However, you can select your target audience from the dropdown that you configured while creating the Experience to examine the relevant analytics.
All the metrics are calculated and displayed in the App's Timezone.
### Experience Performance Stats
Experience performance provides the impact of your experience on your users and enables you to examine more concise data by selecting a certain Time Scale (in Hours, Days, Weeks, and Months) within the chosen period.
You can also switch between the graphical and tabular representation of the campaign statistics.
**Actions that can be performed in the stats section:**
* Choose the *number view* *(#)* or the *percentage view* *(%)* to see the stats as numbers or percentage values.
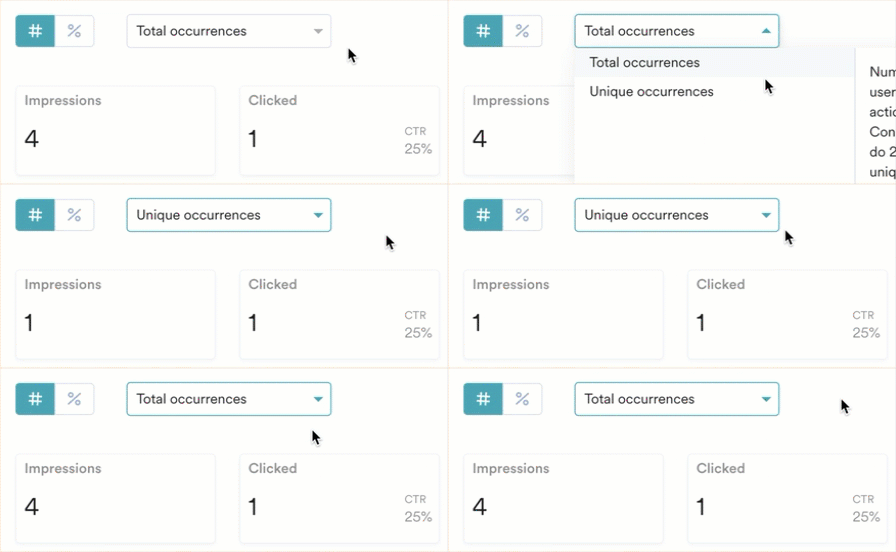
 * View the unique or total occurrences of stats by selecting *Unique or Total in the dropdown* at the top of the section.
 The following stats are available:
| | |
| ------------------------ | ------------------------------------------------------------------------------------------------------------------------------------------------------------------------------------------------------------------------------------------------------------------------------------------------------------------------------------------------------------------------------------------------------------------------------------------------------------------------------------------------------------------------------------------------------------------------------------------------------------------------------------------------------------------------------------------------------------------------------------------------------------------------------ |
| Metric | Description |
| Impressions | This metric represents the number of times users in the target audience have received the personalized variations configured by the marketer. Higher impressions represent a higher reach of your experiences. |
| Clicked | This metric represents the total number of clicks on the target element by the users after receiving the personalized variation. |
| Conversions | This metric displays the number of times users converted from each personalized variation. For active experiences, conversions represent the number of unique users converted per instance of an active experience. For example: - - - If a user receives one personalized variation on Day X and another on Day Y and converts once on both days, the conversions are counted as two (instead of being counted as one in the previous version.) - If a user receives one personalized variation on Day X and converts twice from the same variation, conversions will be counted as 1. - If a user receives two personalized variations of the same experience on Day X and converts for both, conversions will be counted as 2. |
| Click Through Rate (CTR) | The percentage ratio of total clicks to the total number of impressions delivered. Click through rate = ((Total clicks) / (Total Impressions)) \* 100 |
| Conversion Rate (CVR) | The percentage ratio of total conversions for the primary goal to the total number of impressions delivered. **Primary Goal Conversions** are the total number of primary conversion goal events within the attribution window (configurable) from the time user received the notification. \*\*Conversion Rate -\*\*The percentage ratio of users who have performed the conversion event. The conversion count is tracked as Unique. The conversion rate for the various attribution types are listed below: - - - View through attribution CVR = ((Unique conversions) / (Total impressions)) \* 100 - Click through attribution CVR - ((Unique conversions) / (Total clicks)) \* 100 - In-session attribution - ((Unique conversions) / (Total clicks)) \* 100 |
##
## Audience/Variation Performance
You can see the breakdown of performance metrics (Impressions, Clicks, Conversions, Conversion goals) across each audience and variation, allowing you to assess and compare the effectiveness of the various audience and variation combinations. You can choose the metrics for which you wish to see the comparison in the metrics dropdown and filter using the following mechanisms:
* **Group by audience** - Lists performance of the metrics selected for each variation grouped by the audience. Hover over the bar graph to understand how each variation has performed for the specified metric in an audience.
* **Group by variation -** Lists performance of each metric in all audiences grouped by the variation. Hover over the bar chart to understand how each audience has performed for the specific metric in a variation.
## Conversion Goals Performance
You will be able to see this section when you have set more than one conversion goal for your experience. The section compares the performance of goals set by the marketer for the experience.
**Total Conversions:** Will show all goal events for the respective goals i.e. if a user made a purchase twice, it will be shown twice. It is the equivalent of conversion events covered in the sections above.
**Unique Conversions:** Goals are unique across the users converted per experience instance. It is the equivalent of the Conversions metric covered in the sections above.
**Revenue Metrics**
You will see three revenue metrics for your experience if they are enabled for the primary goal.
* **Total Revenue** is the sum of the total order value across conversion events attributed to the experience.
* **Average Order value** = (Total Revenue)/(Number of Conversion Events)
* **Average revenue per user** = (Total Revenue)/(Number of Unique Conversions)
These revenue metrics are tracked for all attribution types- View through, Click Through, and In-session attribution.
## Info
Contains information about the experience's audience, schedule, and conversion goals.
Audience Scheduling Conversion Goals
This section contains information about who is being targeted for the experience(defined in the first step of experience creation), such as:
* Target segment
* Segmentation filters and exclusions - user segments can be All users, users segmented based on a specific user property, affinity, behavior, or custom segments that employ complex queries with AND/OR conditions.
* In Session query parameters that were defined for the audience are shown.
This section contains information about the experience’s delivery schedule and delivery control (experience priority).
* Delivery Schedule: This section contains information about when the experience will be live. The following values are available: time selection, Start Date and Time, End Date and Time, and timezone information.
* Delivery Control: This section contains information about the priority of the experience.
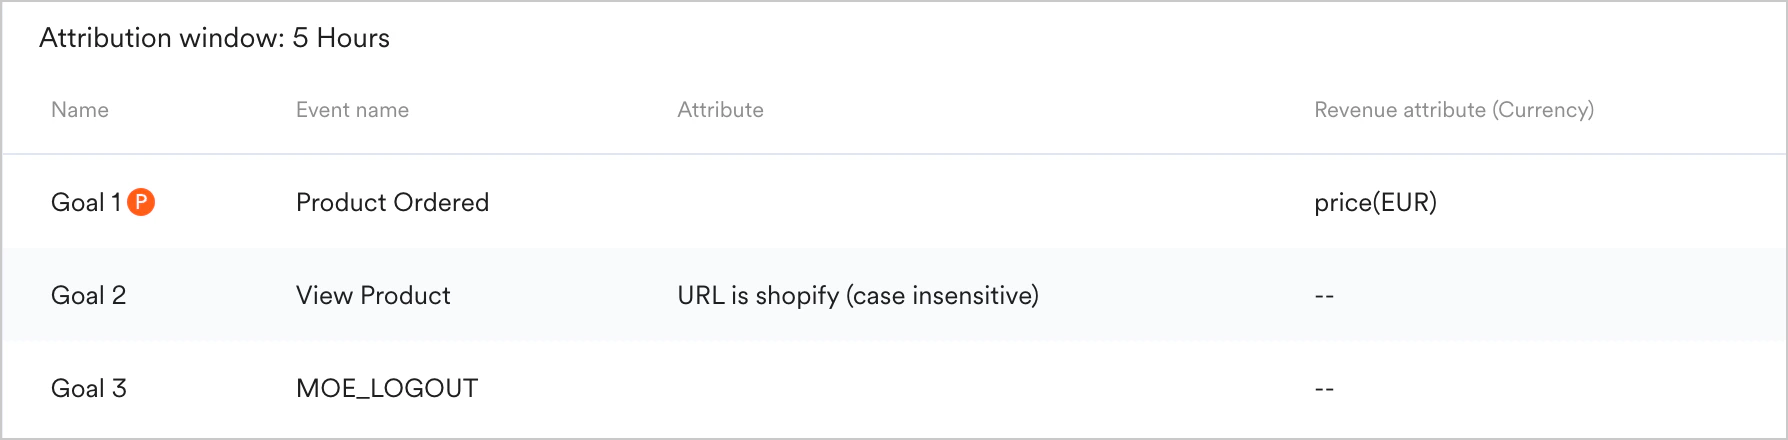
This section contains information about the conversion goals defined during step 3 of experience creation. The primary conversion goal is displayed with a '**P**' icon beside the goal name. The following information is available about each conversion goal:
| Field | Description |
| ------------------------------ | ------------------------------------------------------------------------------- |
| Goal Name | The Name of the goal set for the experience. |
| Event Name | The Event Name is based on which the experience goal is set. |
| Attribute Name | The Attribute Name is based on which the experience goal is set. |
| Attribute Value | The Attribute Value is based on which the experience goal is set. |
| Revenue Performance Info Value | |
| Event Name | The Event Name is based on which the experience revenue information is set. |
| Attribute Name | The Attribute Name is based on which the experience revenue information is set. |
| Currency | The Currency is used to calculate the experience revenue. |
The following stats are available:
| | |
| ------------------------ | ------------------------------------------------------------------------------------------------------------------------------------------------------------------------------------------------------------------------------------------------------------------------------------------------------------------------------------------------------------------------------------------------------------------------------------------------------------------------------------------------------------------------------------------------------------------------------------------------------------------------------------------------------------------------------------------------------------------------------------------------------------------------------ |
| Metric | Description |
| Impressions | This metric represents the number of times users in the target audience have received the personalized variations configured by the marketer. Higher impressions represent a higher reach of your experiences. |
| Clicked | This metric represents the total number of clicks on the target element by the users after receiving the personalized variation. |
| Conversions | This metric displays the number of times users converted from each personalized variation. For active experiences, conversions represent the number of unique users converted per instance of an active experience. For example: - - - If a user receives one personalized variation on Day X and another on Day Y and converts once on both days, the conversions are counted as two (instead of being counted as one in the previous version.) - If a user receives one personalized variation on Day X and converts twice from the same variation, conversions will be counted as 1. - If a user receives two personalized variations of the same experience on Day X and converts for both, conversions will be counted as 2. |
| Click Through Rate (CTR) | The percentage ratio of total clicks to the total number of impressions delivered. Click through rate = ((Total clicks) / (Total Impressions)) \* 100 |
| Conversion Rate (CVR) | The percentage ratio of total conversions for the primary goal to the total number of impressions delivered. **Primary Goal Conversions** are the total number of primary conversion goal events within the attribution window (configurable) from the time user received the notification. \*\*Conversion Rate -\*\*The percentage ratio of users who have performed the conversion event. The conversion count is tracked as Unique. The conversion rate for the various attribution types are listed below: - - - View through attribution CVR = ((Unique conversions) / (Total impressions)) \* 100 - Click through attribution CVR - ((Unique conversions) / (Total clicks)) \* 100 - In-session attribution - ((Unique conversions) / (Total clicks)) \* 100 |
##
## Audience/Variation Performance
You can see the breakdown of performance metrics (Impressions, Clicks, Conversions, Conversion goals) across each audience and variation, allowing you to assess and compare the effectiveness of the various audience and variation combinations. You can choose the metrics for which you wish to see the comparison in the metrics dropdown and filter using the following mechanisms:
* **Group by audience** - Lists performance of the metrics selected for each variation grouped by the audience. Hover over the bar graph to understand how each variation has performed for the specified metric in an audience.
* **Group by variation -** Lists performance of each metric in all audiences grouped by the variation. Hover over the bar chart to understand how each audience has performed for the specific metric in a variation.
## Conversion Goals Performance
You will be able to see this section when you have set more than one conversion goal for your experience. The section compares the performance of goals set by the marketer for the experience.
**Total Conversions:** Will show all goal events for the respective goals i.e. if a user made a purchase twice, it will be shown twice. It is the equivalent of conversion events covered in the sections above.
**Unique Conversions:** Goals are unique across the users converted per experience instance. It is the equivalent of the Conversions metric covered in the sections above.
**Revenue Metrics**
You will see three revenue metrics for your experience if they are enabled for the primary goal.
* **Total Revenue** is the sum of the total order value across conversion events attributed to the experience.
* **Average Order value** = (Total Revenue)/(Number of Conversion Events)
* **Average revenue per user** = (Total Revenue)/(Number of Unique Conversions)
These revenue metrics are tracked for all attribution types- View through, Click Through, and In-session attribution.
## Info
Contains information about the experience's audience, schedule, and conversion goals.
Audience Scheduling Conversion Goals
This section contains information about who is being targeted for the experience(defined in the first step of experience creation), such as:
* Target segment
* Segmentation filters and exclusions - user segments can be All users, users segmented based on a specific user property, affinity, behavior, or custom segments that employ complex queries with AND/OR conditions.
* In Session query parameters that were defined for the audience are shown.
This section contains information about the experience’s delivery schedule and delivery control (experience priority).
* Delivery Schedule: This section contains information about when the experience will be live. The following values are available: time selection, Start Date and Time, End Date and Time, and timezone information.
* Delivery Control: This section contains information about the priority of the experience.
This section contains information about the conversion goals defined during step 3 of experience creation. The primary conversion goal is displayed with a '**P**' icon beside the goal name. The following information is available about each conversion goal:
| Field | Description |
| ------------------------------ | ------------------------------------------------------------------------------- |
| Goal Name | The Name of the goal set for the experience. |
| Event Name | The Event Name is based on which the experience goal is set. |
| Attribute Name | The Attribute Name is based on which the experience goal is set. |
| Attribute Value | The Attribute Value is based on which the experience goal is set. |
| Revenue Performance Info Value | |
| Event Name | The Event Name is based on which the experience revenue information is set. |
| Attribute Name | The Attribute Name is based on which the experience revenue information is set. |
| Currency | The Currency is used to calculate the experience revenue. |