- All the metrics are calculated and displayed in the App’s Timezone.
- Connector Campaigns created in the older UI will have the analytics and info sections shown as per the older campaign analytics and info UI. For more information on the older UI, refer to Connector Campaign Analytics.
- You can view Connector analytics and info in the MoEngage Go mobile app. Monitor performance stats, track conversions, and review campaign details right from your phone. For more information, refer to MoEngage Go.
Overview
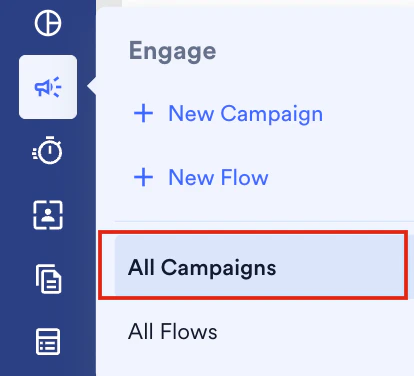
Navigation:- On the sidebar menu in MoEngage, hover over the Engage icon
 . The Engage menu appears.
 - Click All Campaigns.
- Choose Connector in the Select Channel dropdown
- Click the connector campaign for which you wish to see the analytics information.
- Campaign Details - contains information about the campaign and its status. For more information, refer to Campaign Details.
- Analytics - contains information about the various metrics that are tracked for the campaign and has the following sections:
- Info- contains information about the campaign’s target segment, content, preview, and delivery schedule. For more information, refer to Campaign Info.
Campaign Details
This section contains the following information:- Campaign type
- Campaign ID
- Campaign creation and updation details
- Team information
- Approver’s list/ Approved by/ Rejected by (if Campaign Approval Flow - CAF is enabled)
- Campaign status - A campaign can have the following states: Active, Expired, Not Sent, Paused, Scheduled, Sending, Sent, and Stopped. If CAF is enabled, two more states are possible for campaign status: Under_Review_ and Rejected.

Campaign Analytics
The analytics section contains information about the performance stats and revenue metrics.Campaign Performance Stats
Campaign performance provides the impact of your connector campaigns. Actions that can be performed in the stats section- Choose the number view or the percentage view to see the stats as numbers or percentage values.
- View the unique or total occurrences of stats by selecting Unique or Total in the dropdown at the top of the section.
- Pin metrics - you can pin the metrics you want to see using the Pin metrics dropdown at the top right corner. You can pin up to five metrics. The selected metric pins are available in the Pinned Metrics section. Click _Show all metrics_to see all the metrics being tracked for the campaign and Hide unpinned metrics to see only the pinned metrics for the campaign.
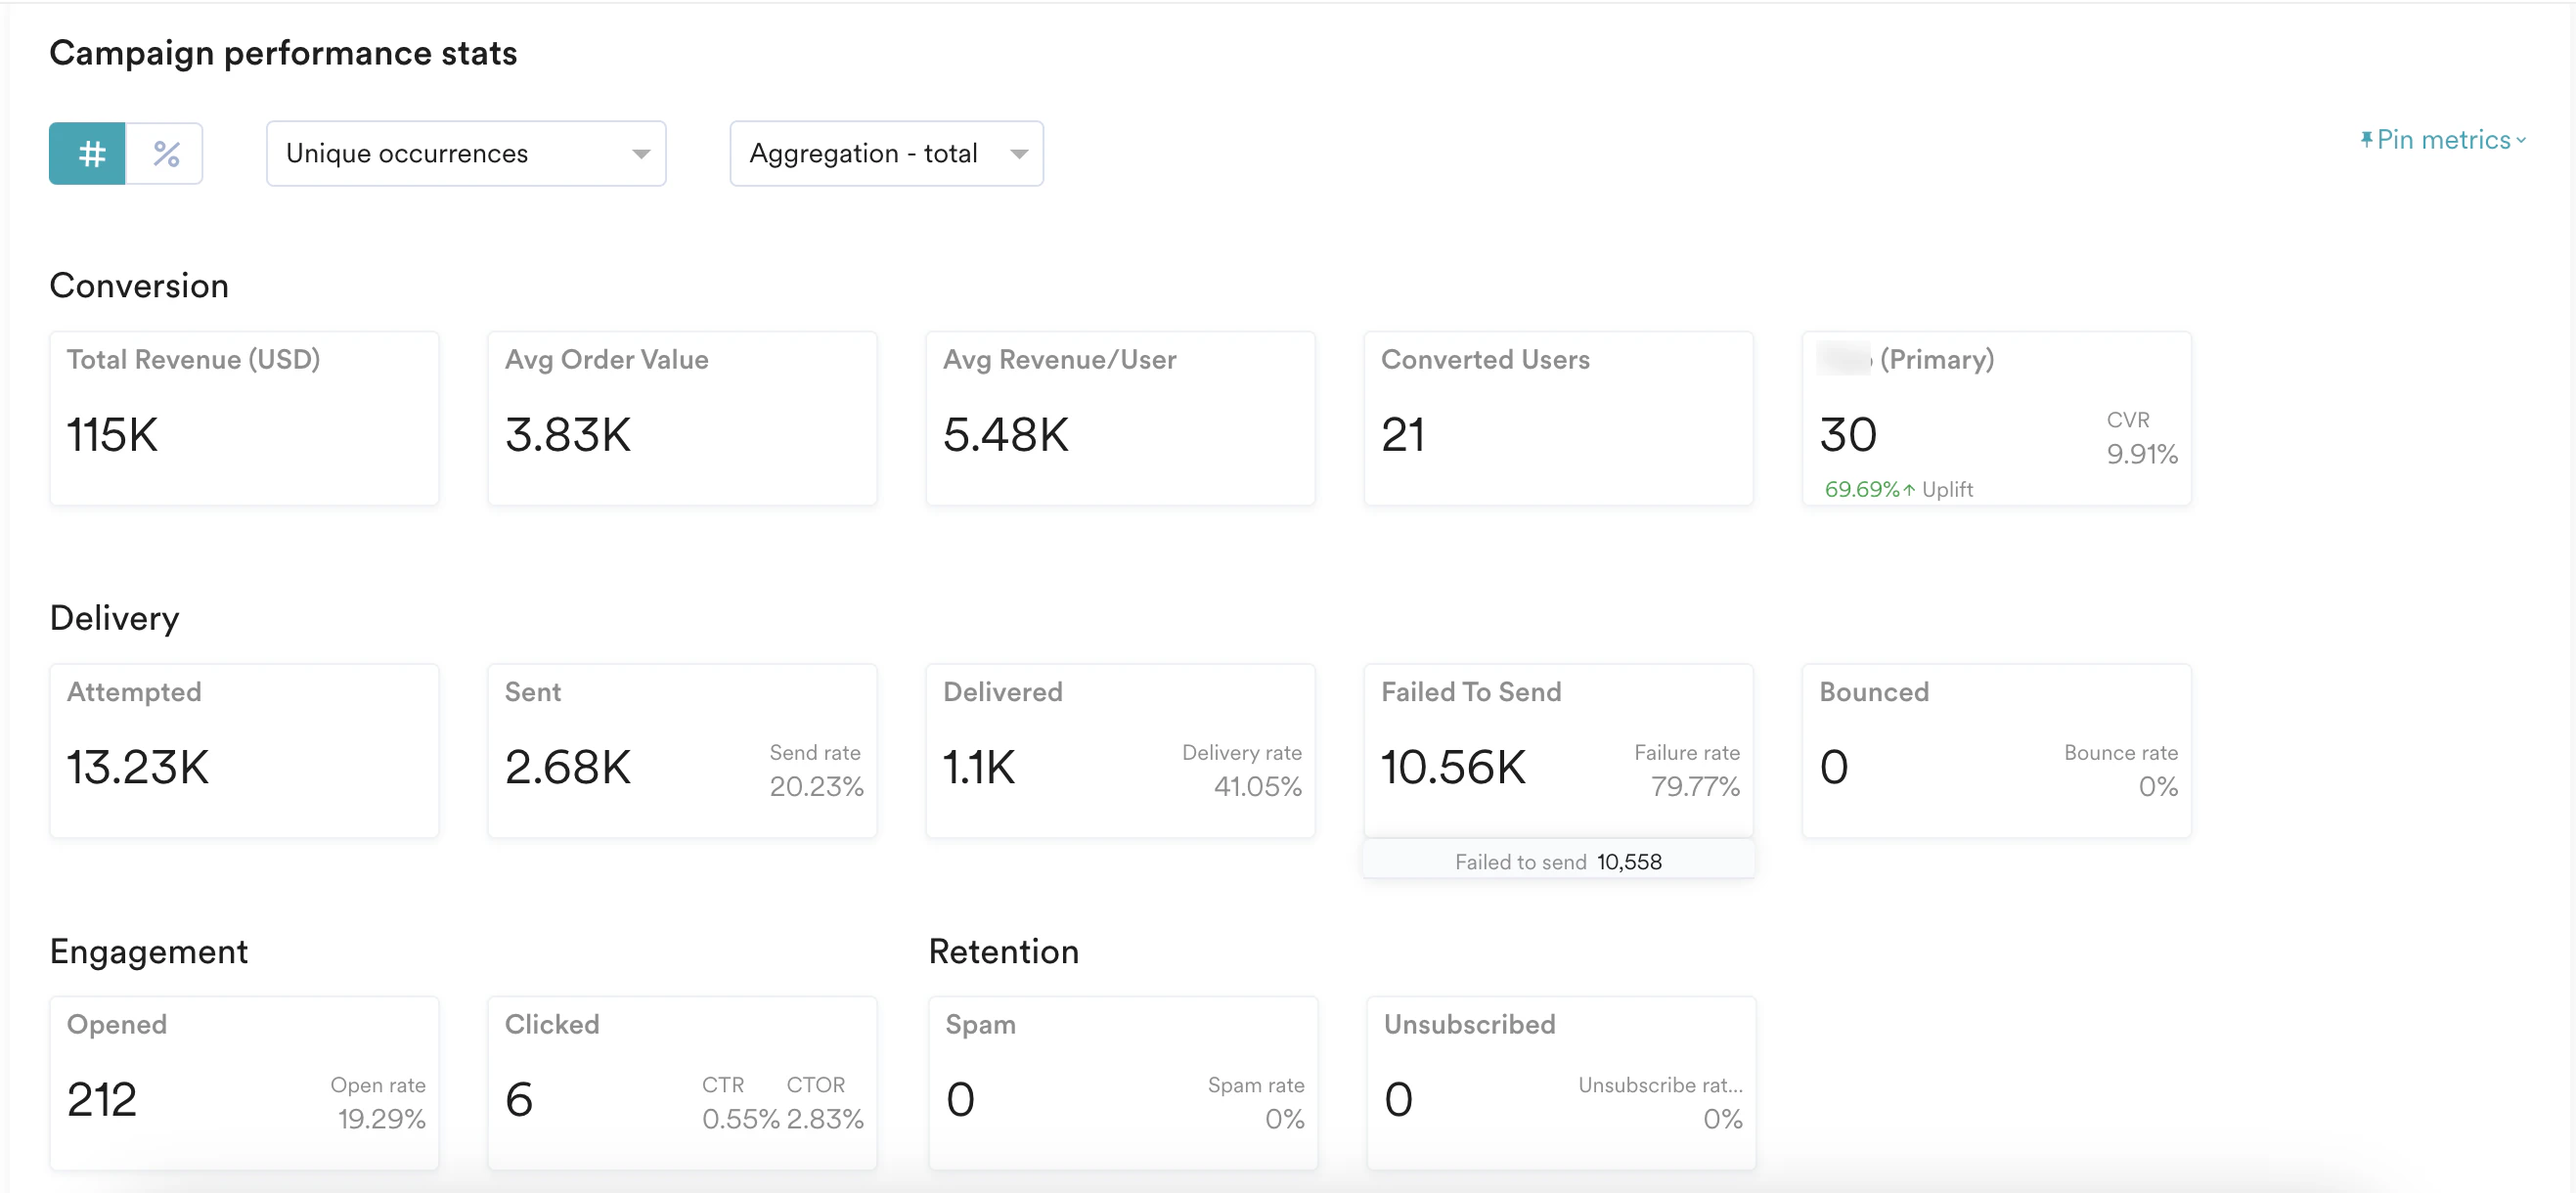
- Conversion Metrics- These metrics pertain to the conversion goals set for the campaign. The higher these metrics, the more effective your campaign! The conversion metrics tracked for your connector campaigns are shown in the table below.
Metric Description Converted Users This metric shows the number of unique users who have completed the primary conversion. Converted Users were previously called Conversions. This metric displays the number of times users converted from each campaign. For campaigns having only one recurrence, converted users represent unique users who have accomplished the primary conversion goal event at least once within the attribution window. For active campaigns, converted users represent the number of unique users converted per instance of an active campaign. A high number of converted users indicate that your campaign is effective in driving the business goals.
Example- If a user receives one Campaign Instance on Day X and another on Day Y and converts once on both days, the converted users are counted as two (instead of being counted as one in the previous version.)
- If a user receives one campaign instance on Day X and converts twice from the same campaign, converted users will be counted as 1.
- If a user receives two campaign instances of the same campaign on Day X and converts for both of them, converted users will be counted as 2.
Event (Primary) This metric shows the total number of primary conversion goal events within the attribution window (configurable) from the time user received the notification. You can also view the uplift percentage in the event primary card. For more information, refer to Uplift in Campaigns.Event (Primary) - The conversions for active campaigns are several conversion events from all campaign notifications. The metric is the cumulative primary conversion events after the start of the first campaign. Example Suppose a user receives a connector campaign for a product purchase. If the user made two purchases, then the conversion events are two. Conversion Rate(CVR) This metric shows the percentage ratio of users who have performed the conversion event. The conversion count is tracked as Unique. Higher conversion events indicate higher effectiveness of your campaign in driving the business goals. CVR = ((Unique conversions) / (Total sent)) * 100 Revenue Metrics Your campaign has three revenue metrics if they are enabled for the primary goal. - Total Campaign Revenue is the sum of the total order value across conversion events attributed to the campaign.
- Average Order value = (Total Revenue/ Number of conversion events)
- Average Revenue per user = (Total Revenue/ Number of unique conversions)
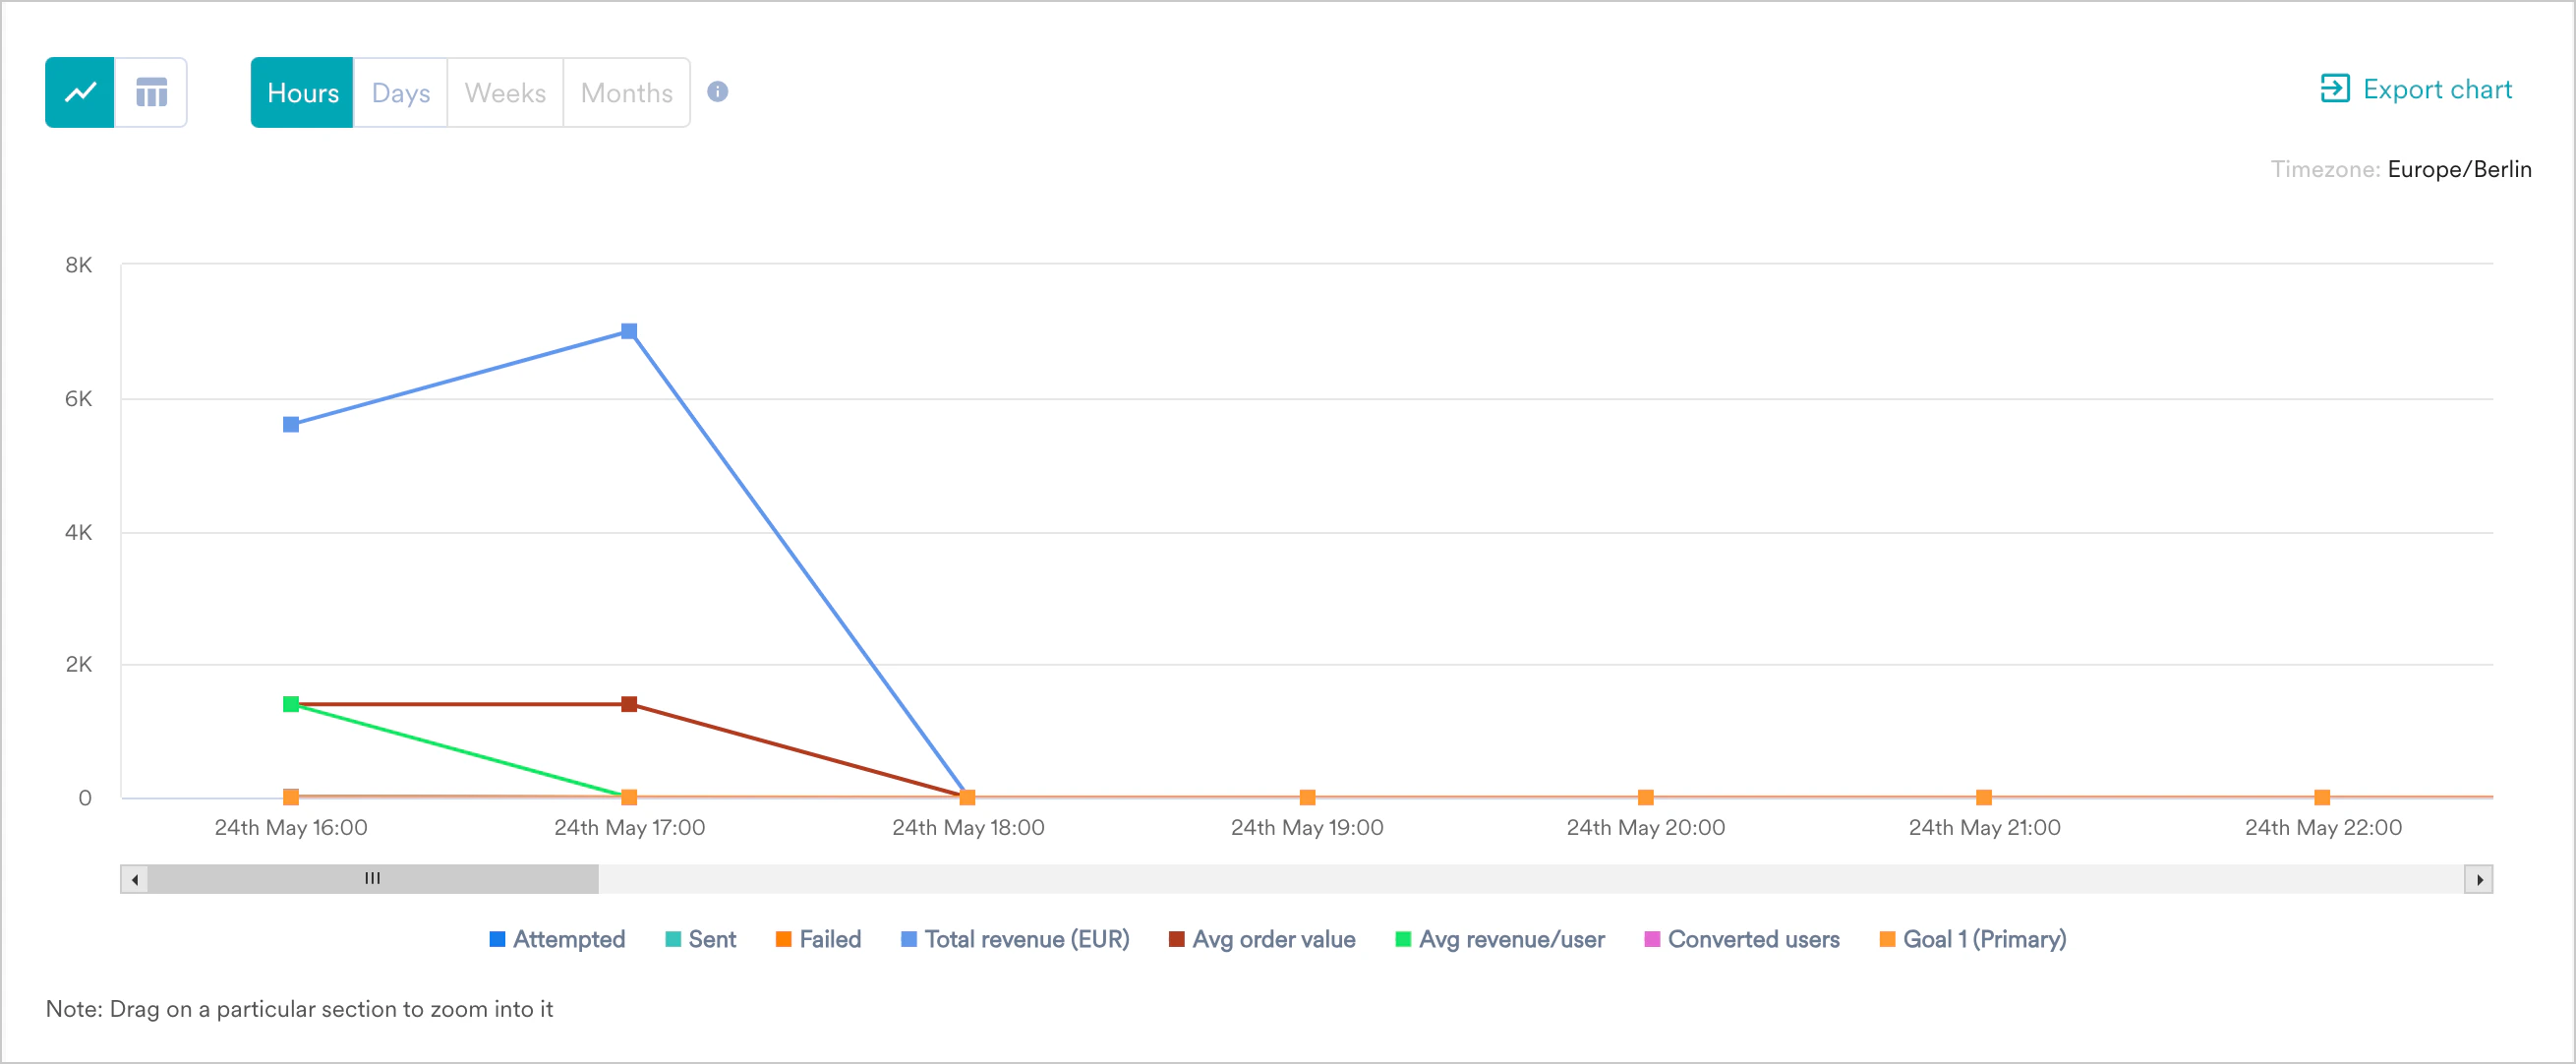
If your revenue attribute is inside an object array, MoEngage’s calculation may not match what you expect. For more information, refer to Revenue Tracking with object attributes.
- Delivery Metrics- The delivery metrics tracked for your connector campaigns are described in the table below.
- The table shown below summarizes how delivery metrics are marked according to the response from the request URL. Requests are not re-tried for connector campaigns.
Conversion Goals Performance
You will be able to see this section when you have set more than one conversion goal for your campaigns. The section compares the performance of goals set by the marketer for the campaign. Total Conversions: Shows all goal events for the respective goals, i.e., if a user made a purchase twice, it will be shown twice. It is the equivalent of conversion events covered in the sections above. Unique Conversions: Goals are unique across the users converted per campaign instance. It is the equivalent of the Conversions metric covered in the sections above. You can view the uplift percentage in the tabular view of Conversion Goals performance. For more information, refer to Uplift in Campaigns.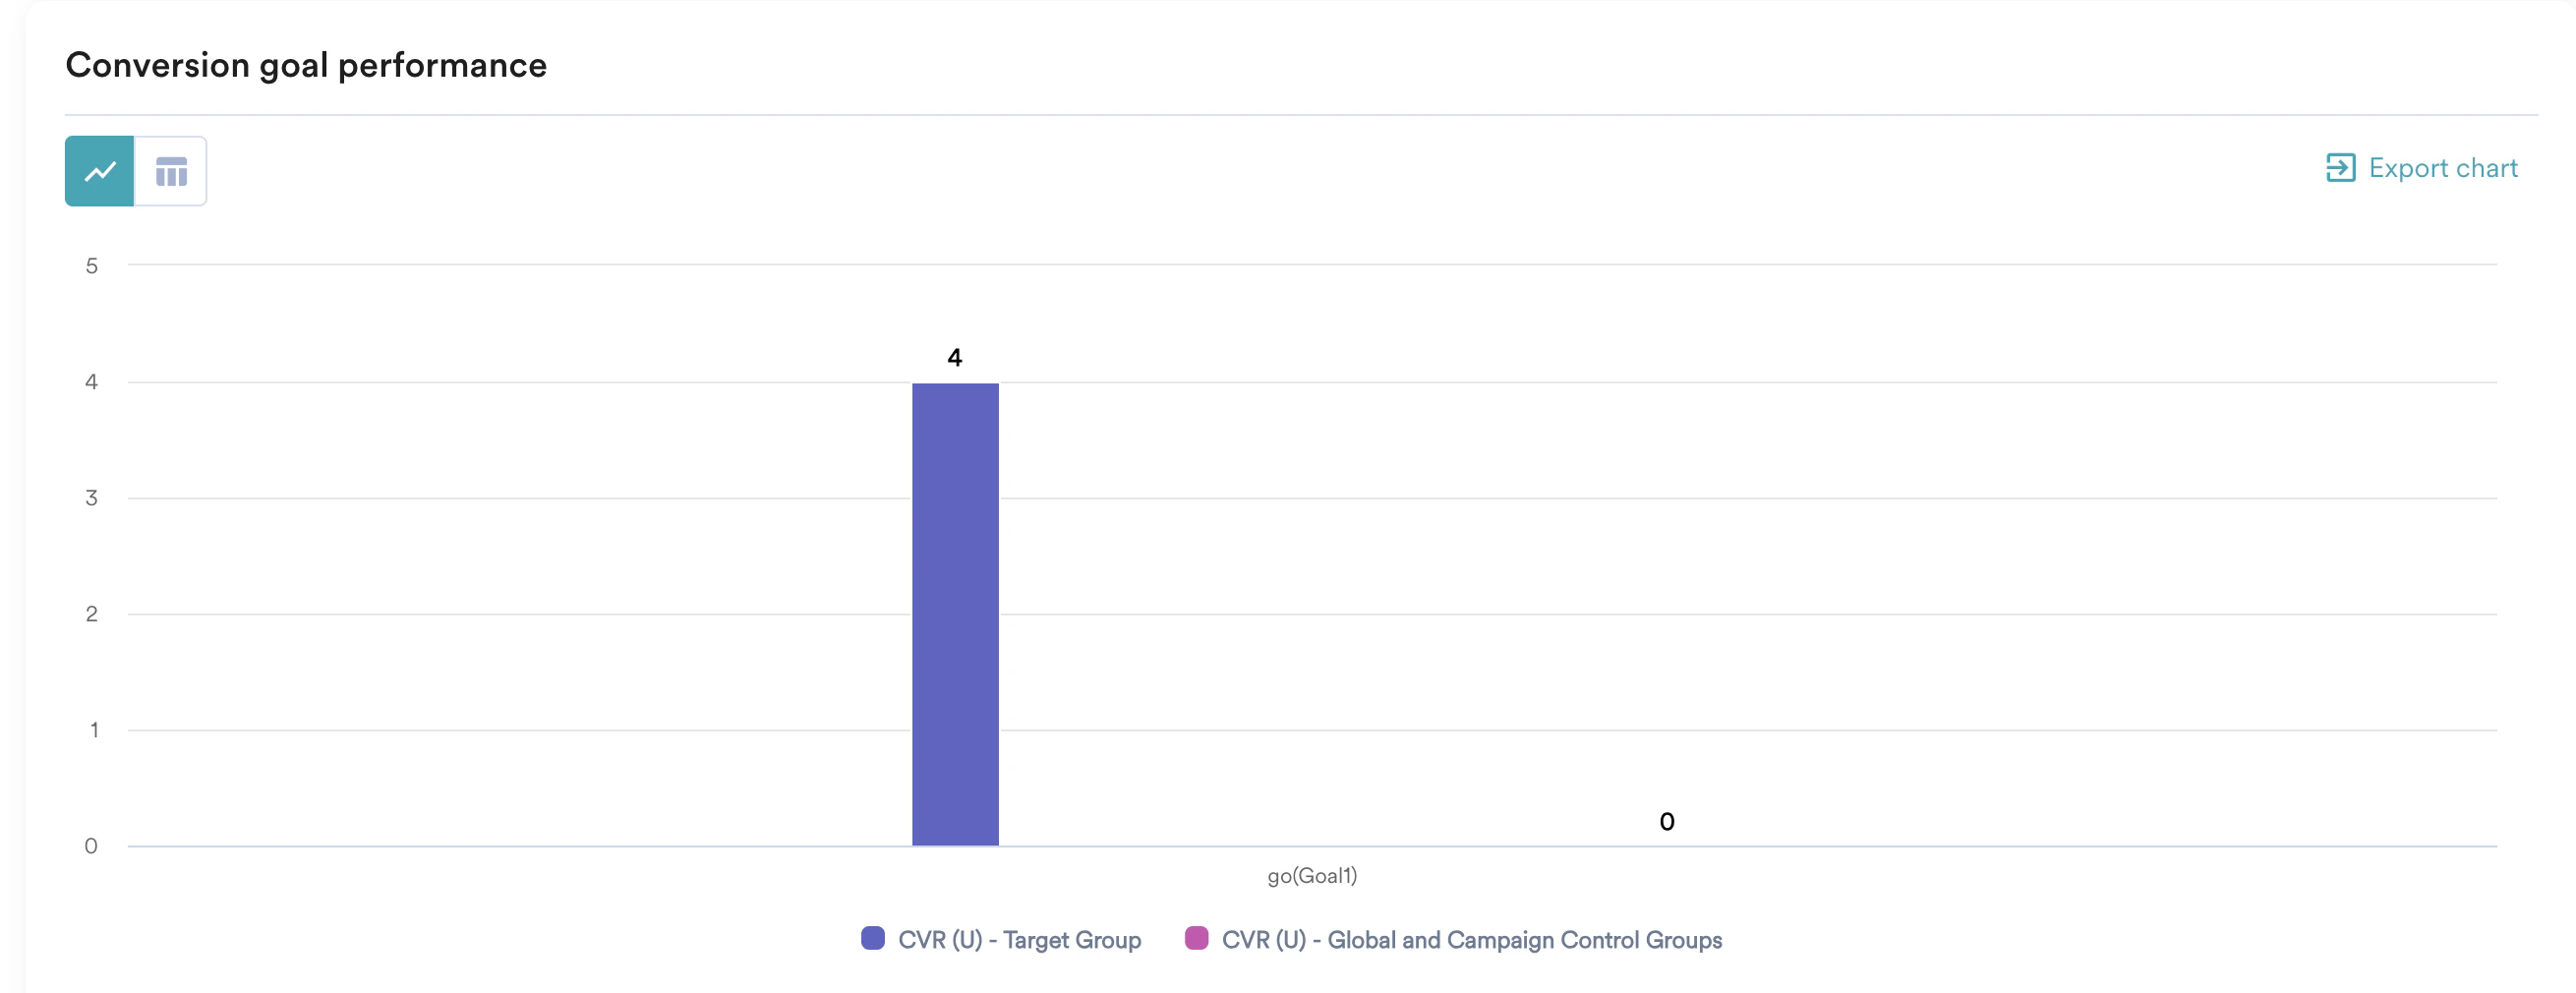
Campaign Delivery
The campaign delivery stats section helps you understand the delivery funnel and the number of users that were removed in each funnel stage. The various delivery funnel stages are explained in the table below:Error breakdown
This section describes the various campaign delivery failures and their reasons. Errors are categorized under the following heads:- Failed to Send errors - these errors happen when the request has not been sent, and they could happen due to one of these reasons:
- users who have been removed as they were part of the campaign’s control group
- users who were removed from the campaign owing to a Frequency Capping limit breach
- users for whom the request URL returned a response other than 200
- users being excluded because they had already reached the campaign’s Limit Message configuration within the defined rolling window. For more information, refer to Limit Messages for Periodic and Triggered Campaigns.
- users for whom personalization attributes were not available and thus were dropped from the campaign. Click See breakdown in the Name column for Personalization errors to get a detailed view of the number of users for whom personalization has failed and their reasons.
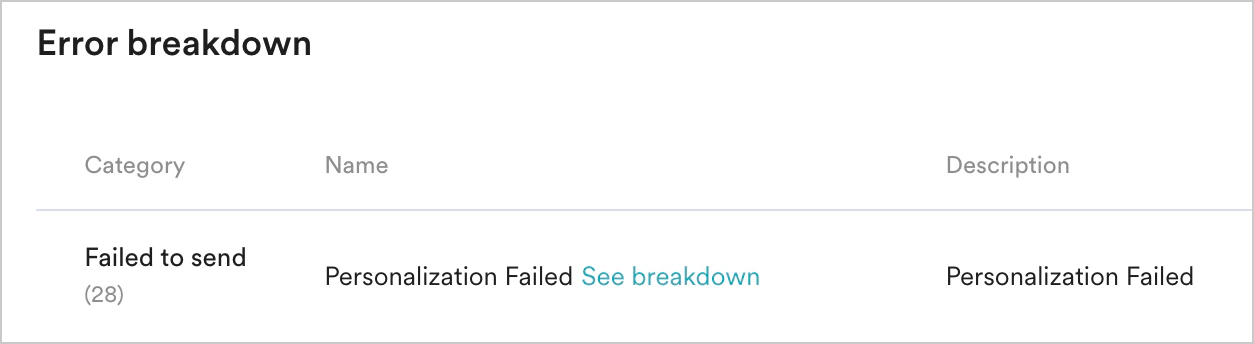
The number of failures listed in the Personalization Failed category under Failed to Send denotes the unique number of users for whom personalization has failed. In some cases. this might differ from the count shown in the Personalization failure analysis UI as multiple failures can happen for the same user and they might be counted under each of the failure categories shown in the UI. For example, if a user were to have a user attribute and event attribute failure, they would be counted for the number of failures in both these sections in the analysis screen while they would be counted as one in the Personalization Failed section.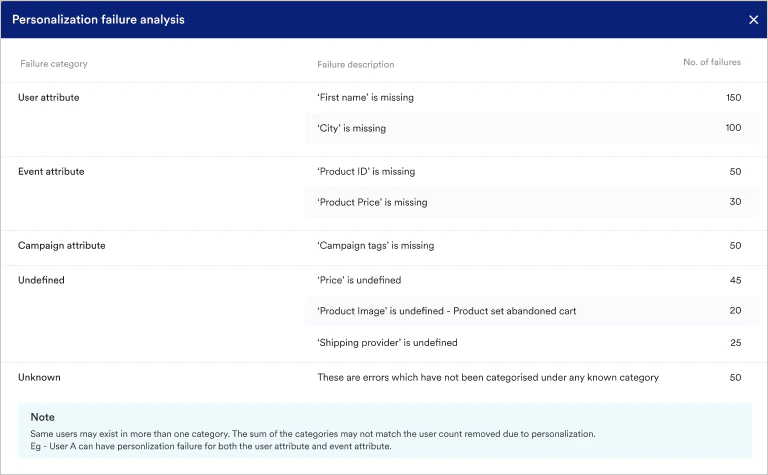
Campaign Info
You can view the information about the campaign sent using the Campaign Info tab.- Timeline
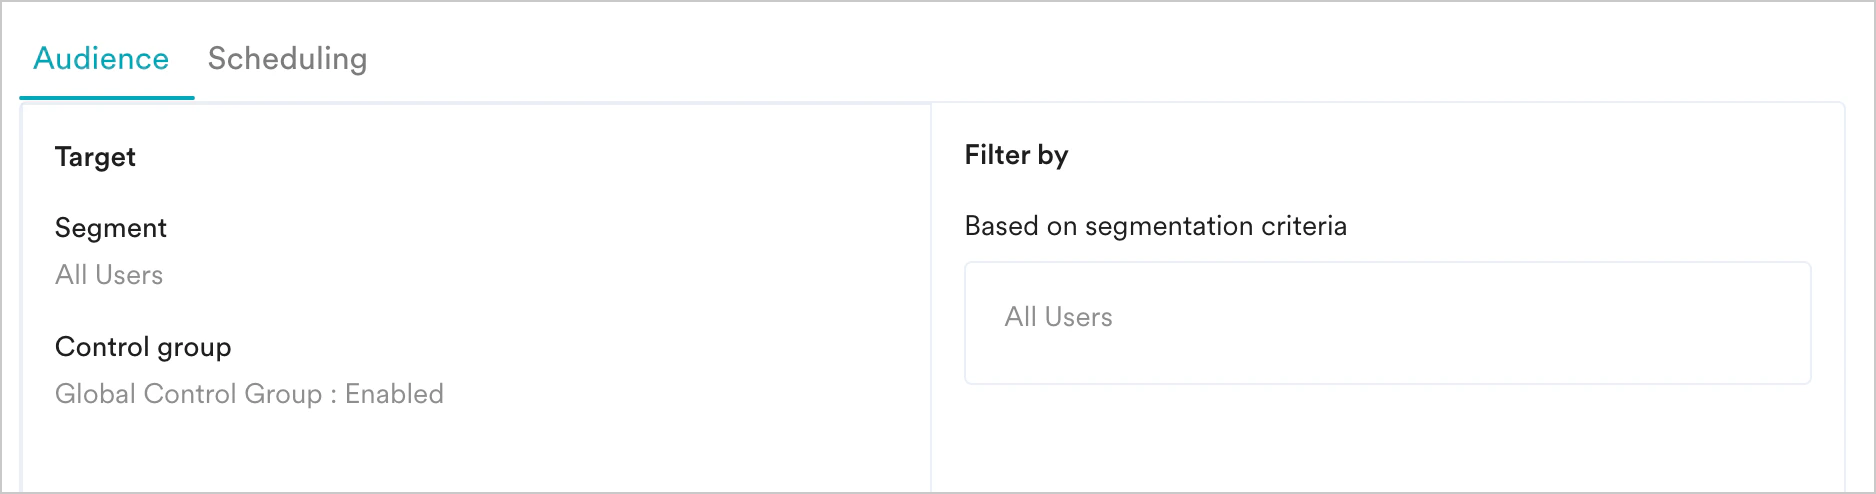
- Audience
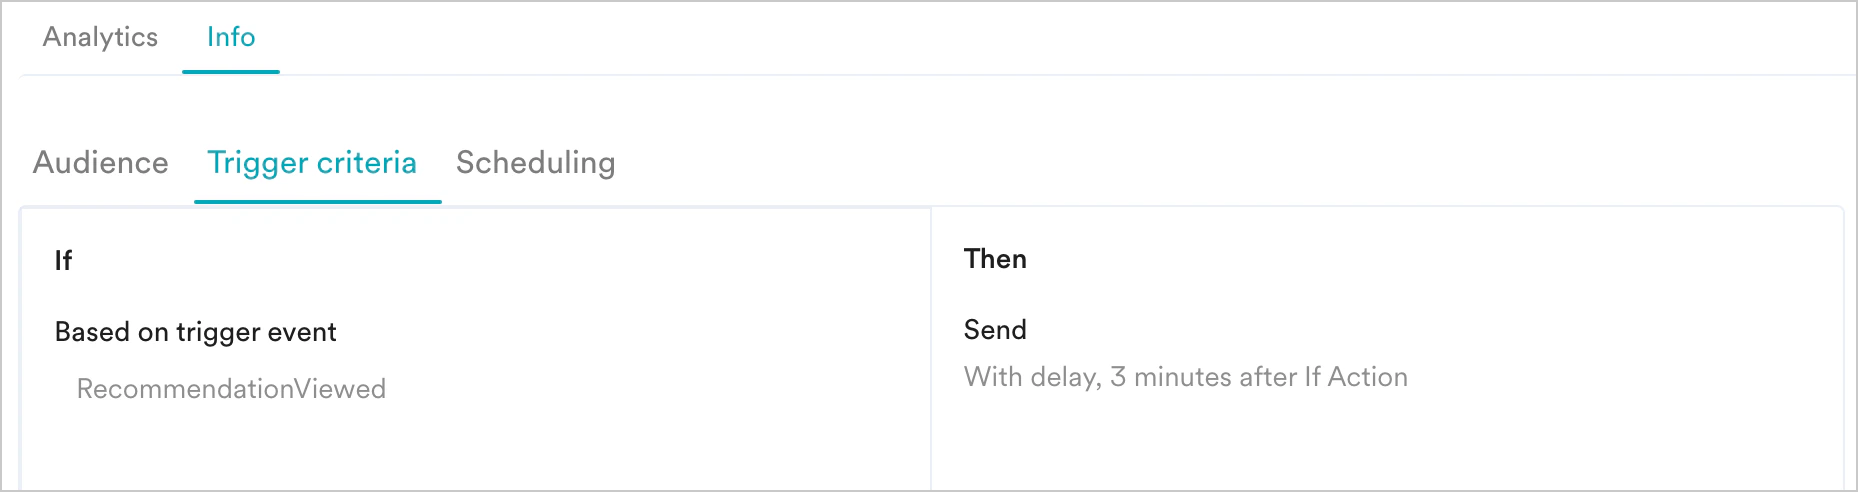
- Trigger criteria
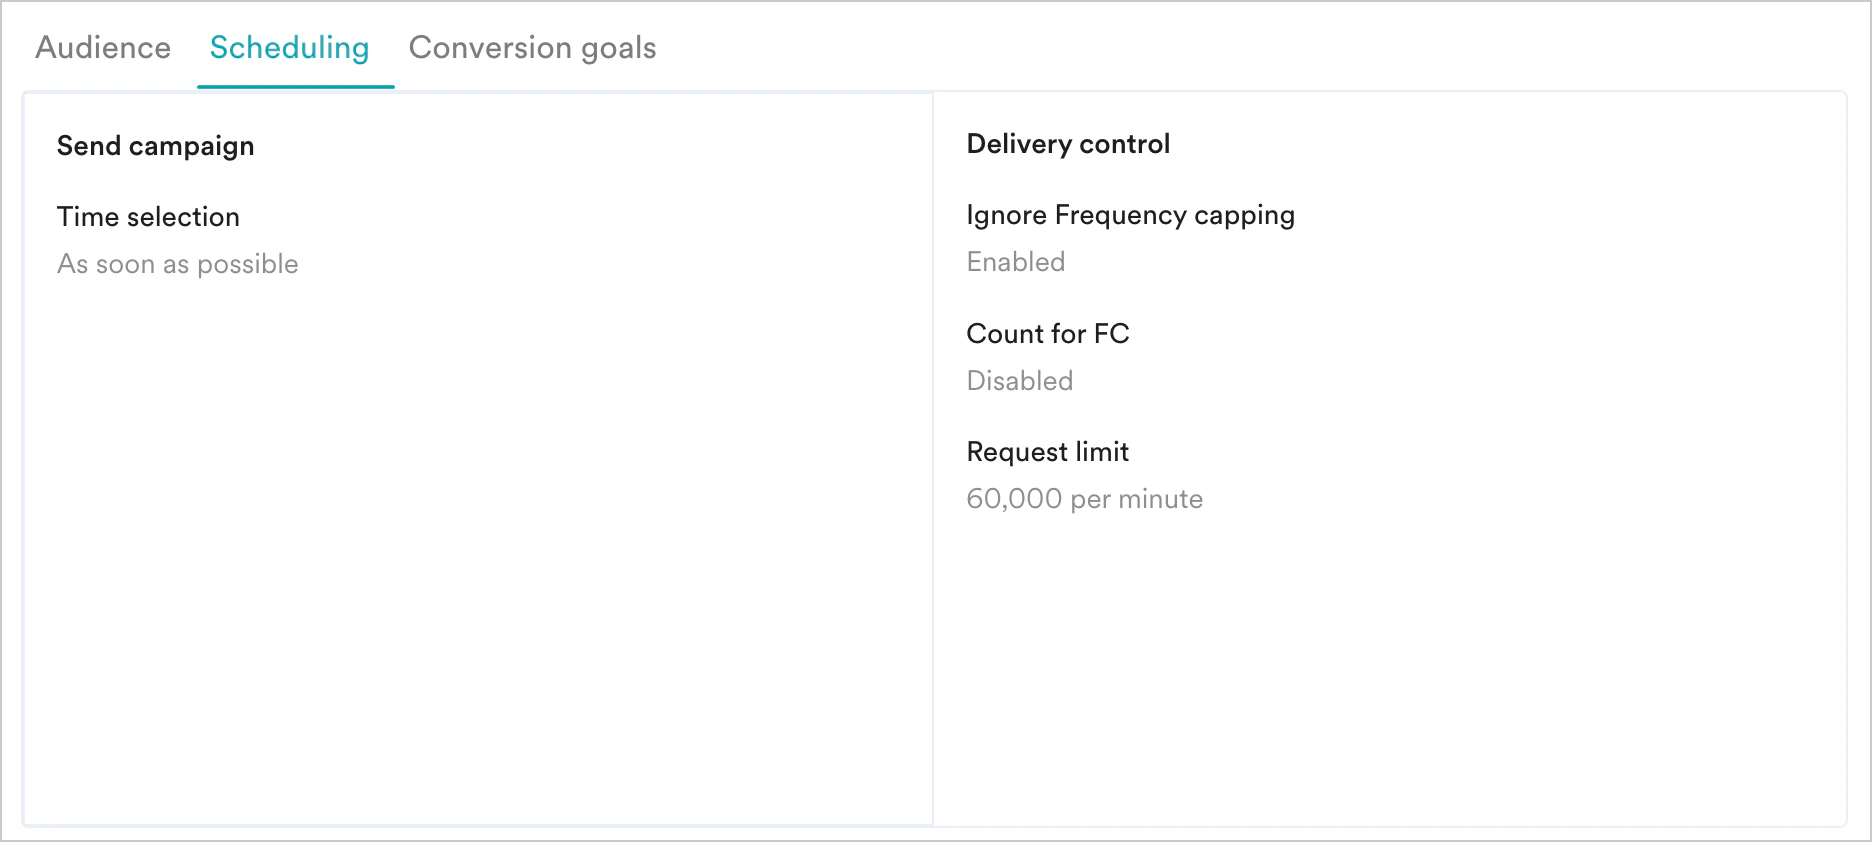
- Scheduling
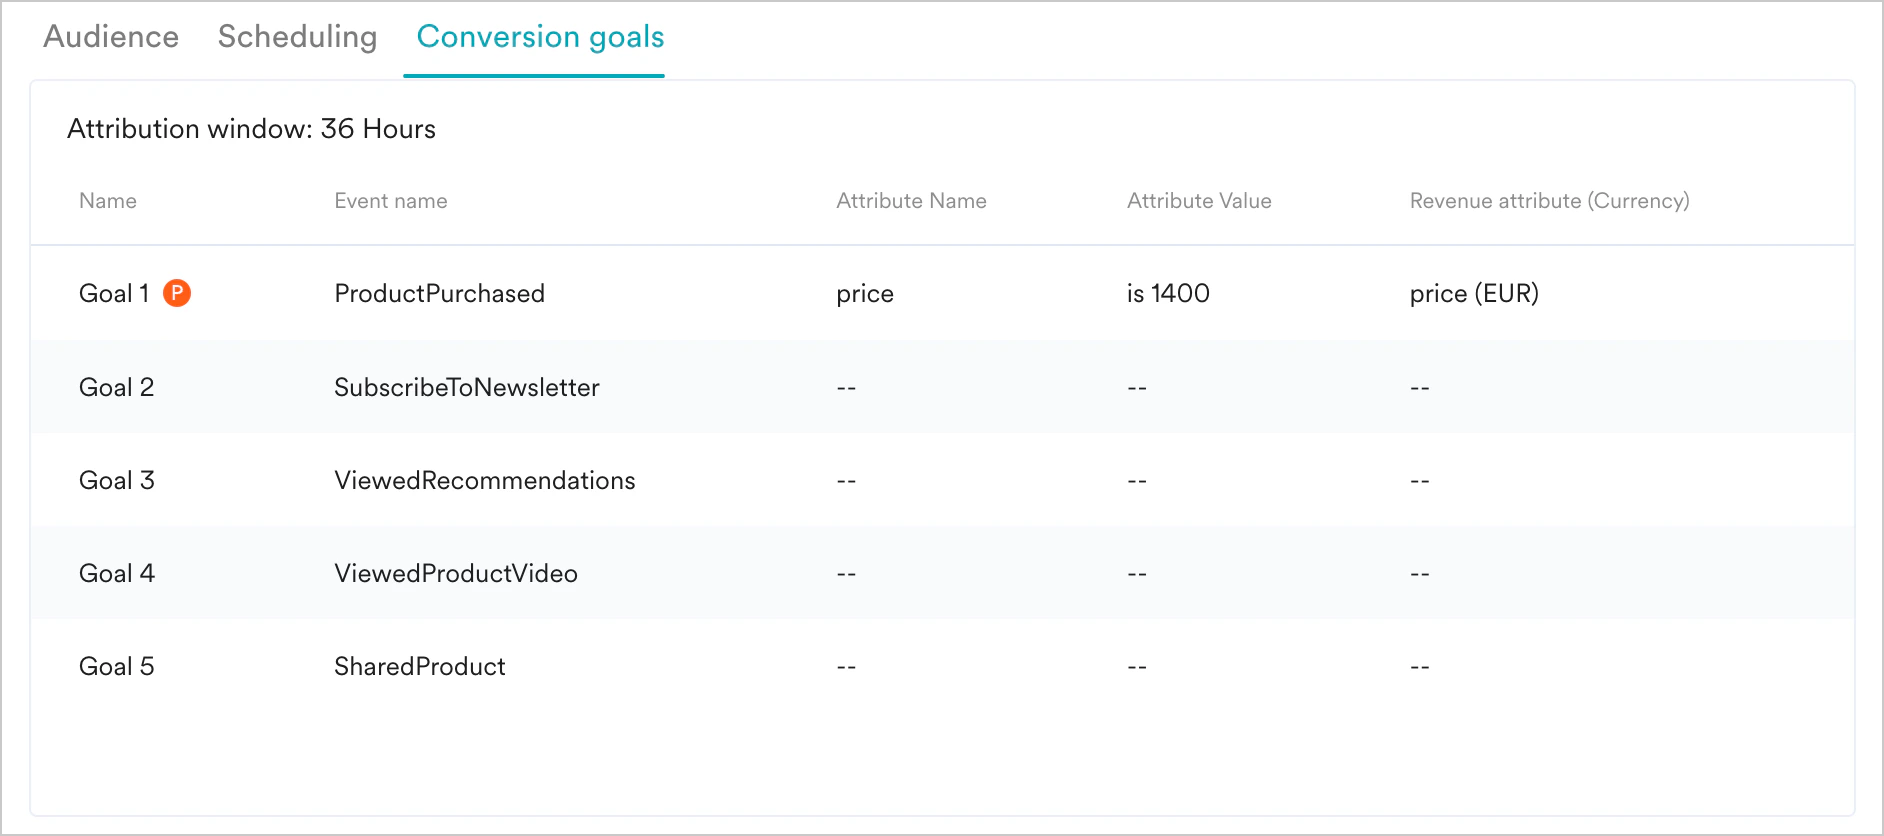
- Conversion Goals
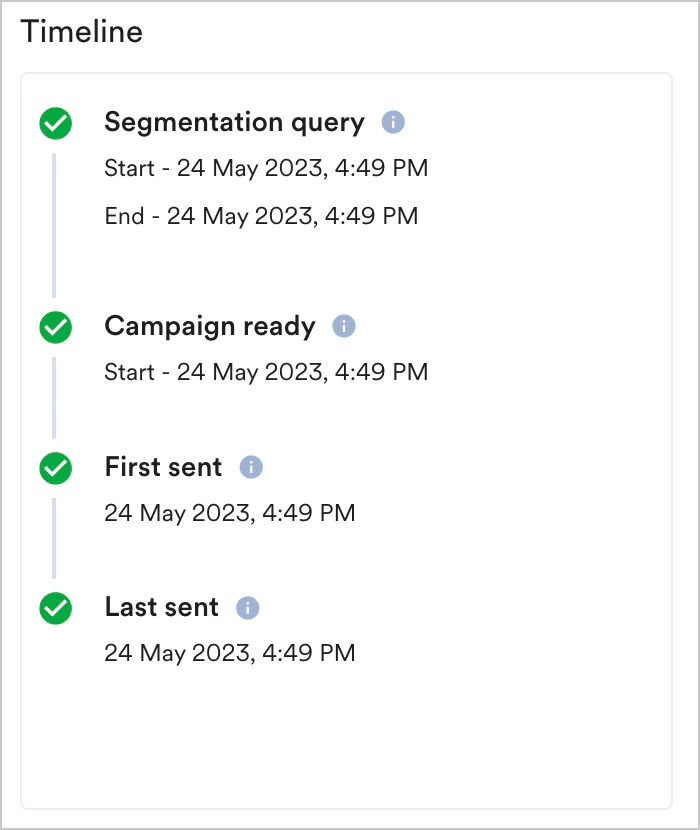
Timeline indicates the time taken for various stages in publishing the campaign and gives a view of the current state of the campaign. This section is available for One Time and Periodic campaigns and contains information about the following:
- Segmentation Query - contains information about when the segmentation query was started and when it was completed.
- Campaign ready - contains information about when the campaign was ready to be sent out from MoEngage post the required internal processing. For ASAP campaigns, this time will represent the campaign sending time.
- First sent - contains information about when the first batch of connector requests was sent from MoEngage and when the first connector request was sent.
-
Last sent - contains information about when the last message was sent for the campaign.
Content
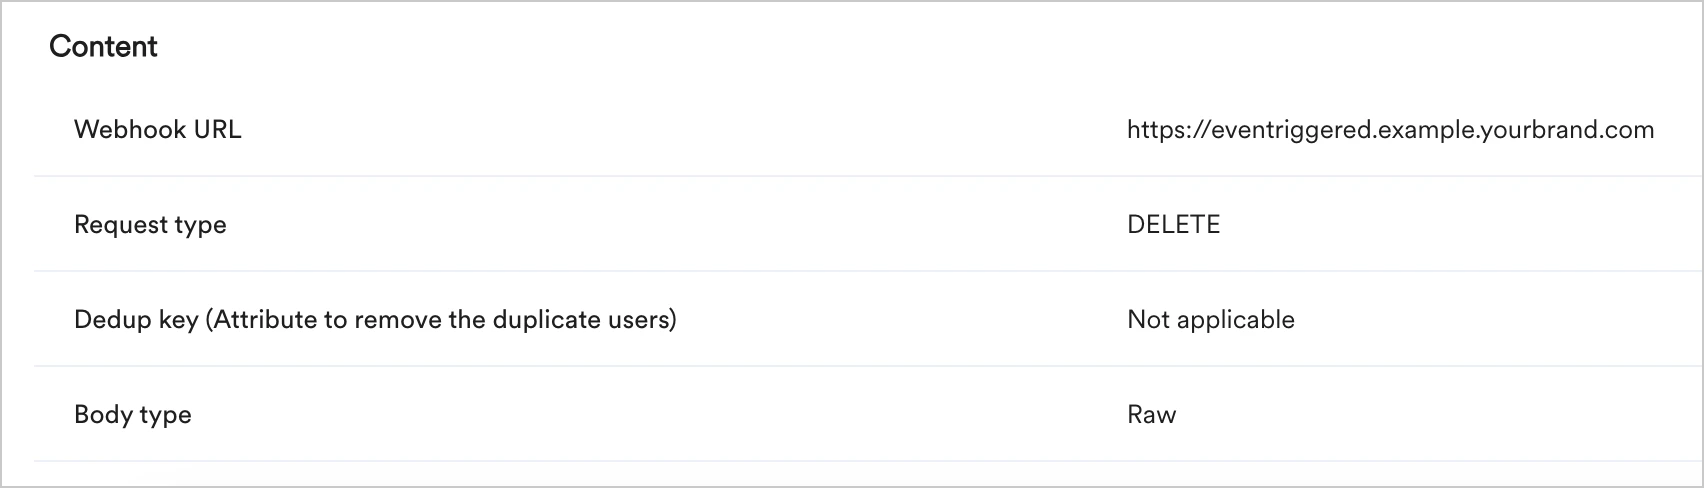
You can preview the information added in the content step of campaign creation in this section.