RFM (Recency, Frequency, and Monetary) Model provides auto-segmentation and buckets users into categories such as Loyal, Promising, At Risk, etc. based on their behavior. These auto segments can be used in multiple different ways such as user analysis, churn analysis, and campaign effectiveness. RFM can also be used for predictive segmentation, customers who are more likely to respond to promotions, and also for future personalization. RFM analysis is a widely used marketing model for behavior-based customer segmentation. This was primarily used in the retail industry and made its way into digital marketing. It groups customers based on their transaction history – how recently, how often, and how much did they buy. RFM Analysis can be used to answer questions like -Documentation Index
Fetch the complete documentation index at: https://moengage.com/docs/llms.txt
Use this file to discover all available pages before exploring further.
- Who are your loyal customers?
- Which are the customers who are most likely to churn?
- Which customers are purchasing the most on your platform?
- Which are the customers who can be turned into the best customers with little effort?
- Which customers are most likely to engage with your campaigns?
RFM Segments Overview
What is RFM Analysis
RFM analysis is a customer behavior segmentation method that uses customers’ past interactions such as a visit to the platform or purchase of an item and based on these interactions divides customers into different RFM groups.The Factors for RFM Analysis
The primary factors are R, F, and M for this model, which are explained below-R is RECENCY - Time since the last visit to the app/site or time since the last purchase.
F is FREQUENCY - The total number of times a user has visited the app/site or the total number of purchases
M is MONETARY - Total money spent by a user or total time spent watching content
How RFM is calculated
Value for Recency, Frequency, and Monetary
Value for Recency, Frequency, and Monetary is the exact value for a specific user, for example, the recency value is 3 days ago, the frequency value is 5 times, and the purchase value is $1523.Scores for Recency, Frequency, and Monetary
MoEngage systems provide Recency, Frequency, and Monetary score to each user based on the value of recency, frequency, and monetary. The values are ranked from highest to lowest and a score has been provided based on the rank. A combination of all these scores is the final RFM score for a user. For example, consider the table given below. For users 1, 2, and 3 RFM is calculated. Recency value is ranked from highest to lowest and respective scores have been provided. The same procedure has been repeated with Frequency and Monetary scores. After getting the R score, the F score, and the M Score, the RFM score is calculated for a user.| User ID | R-Value | R Score | F Value | F Score | M Value | M Score | RFM Score |
| 1 | 1 day ago | 3 | 10 times | 3 | $1000 | 3 | 3.00 |
| 2 | 5 day ago | 2 | 4 times | 2 | $560 | 3 | 2.34 |
| 3 | 9 day ago | 2 | 1 time | 1 | $100 | 1 | 1.34 |
Segment Buckets for RFM Score
Users who are showing similar behavior on R, F, M, and RFM scores are grouped into the same RFM buckets or segments. These segments are named with respect to user behavior. The list of segments and the respective description is provided below:| RFM Bucket | Description |
|---|---|
| Champions | Users who have visited most recently, visited most frequently and spent the most. |
| Loyal Customers | Users who visited recently visited often and spent a great amount |
| Potential Loyalist | A recent user, who spent a good amount |
| Recent Users | Users visited most recently, but not often, and have not spent much |
| Promising | Average recency, frequency, and monetary scores |
| Needs Attention | Users have spent a good amount but long ago (not visited recently) |
| About To Sleep | Below-average recency, frequency, and monetary values |
| Price sensitive | Users visited most recently, and also often, but have not spent much |
| Can’t Lose Them | The user has spent a great amount and visited often but long ago (not visited recently) |
| Hibernating | The user’s last visit was long back, visits are not often, and has not spent much |
| Lost | Lowest recency, frequency, and monetary scores. |
Engagement Strategies for RFM Segments
The RFM segment predicts user behavior and accordingly, marketers can take action to make the best of these user segments. Here are some basic strategies to be used for different RFM Segments:| RFM Bucket | Engagement Strategy |
| Champions | Reward these users. They promote your products, they can be early adopters for your new launches. |
| Loyal Customers | These users are responsive to your promotions, and you can suggest to them higher-value products. Also, ask them for reviews. |
| Potential Loyalist | Engage them with long-term offers like loyalty programs or membership rewards. Suggest other categories of products to them. |
| Recent Users | For new users, make their onboarding experience smooth and provide assistance when needed. |
| Promising | Make them loyal by creating brand awareness and giving free trials. |
| Needs Attention | Need to bring back these customers, provide limited-period offers, and recommend products using purchase history. |
| About To Sleep | The user will be lost if not reactivated. Recommend them popular products and provide discounts for memberships. |
| Price sensitive | Users looking for the best deal, recommend them the highest rated products and send discount communications. |
| Can’t Lose Them | Listen to their feedback, suggest them newer products, and make them stick to your platform. |
| Hibernating | Recommend products for other categories and provide personalized offers. |
| Lost | Make your presence known through different campaigns. |
RFM Events
By default App/Site Open is selected as Recency event, Frequency event is selected as ‘Same as Recency Event’. Monetary event & Revenu Attribute is default set to the Conversion Goal Event and Revenu Attribute defined in MoEngage Dashboard > Settings > APP > General. Users can change these Recency, Frequency, and Monetary events and apply desired filters for the selected events. This helps run RFM analysis on a specific category, specific business unit, product, or service. Accounts do have an identifier (event attribute) for different currencies. This identifier has to be used to filter the monetary events. Needless to say, Recency and frequency events should also be of that specific market or category, or business unit for which the monetary event is being analyzed.
RFM Model & Duration of Analysis
MoEngage dashboard provided RF (Recency & Frequency), RM (Recency & Monetary), and FM (Frequency & Monetary) analysis model other than the default RFM model. Users can select a desired time duration for the RFM model analysis. The recommended analysis period is 30 days - the more the data the better. Individual users can decide the RFM model analysis duration based on their customer acquisition, activation, and retention period. RFM duration should cover all of these customer lifecycle phases if possible. In the case of retail & e-commerce, 3 month time period is an industry-standard for RFM model analysis.RFM analysis can be performed on all data that is present in MoEngage Analytics. In most cases, the data retention is 1 year or 2 years.
Understanding Charts & Tables
RFM Models
The chart represents the different RFM segments, their respective user count, and segment size as a percentage of total users in the selected time duration. The size of the segment on the chart is proportional to the user count. On chart hover, it also displays the Recency, Frequency, and Monetary score and value range (low - high) for the respective RFM segment. Chart images can be downloaded in png format for further use.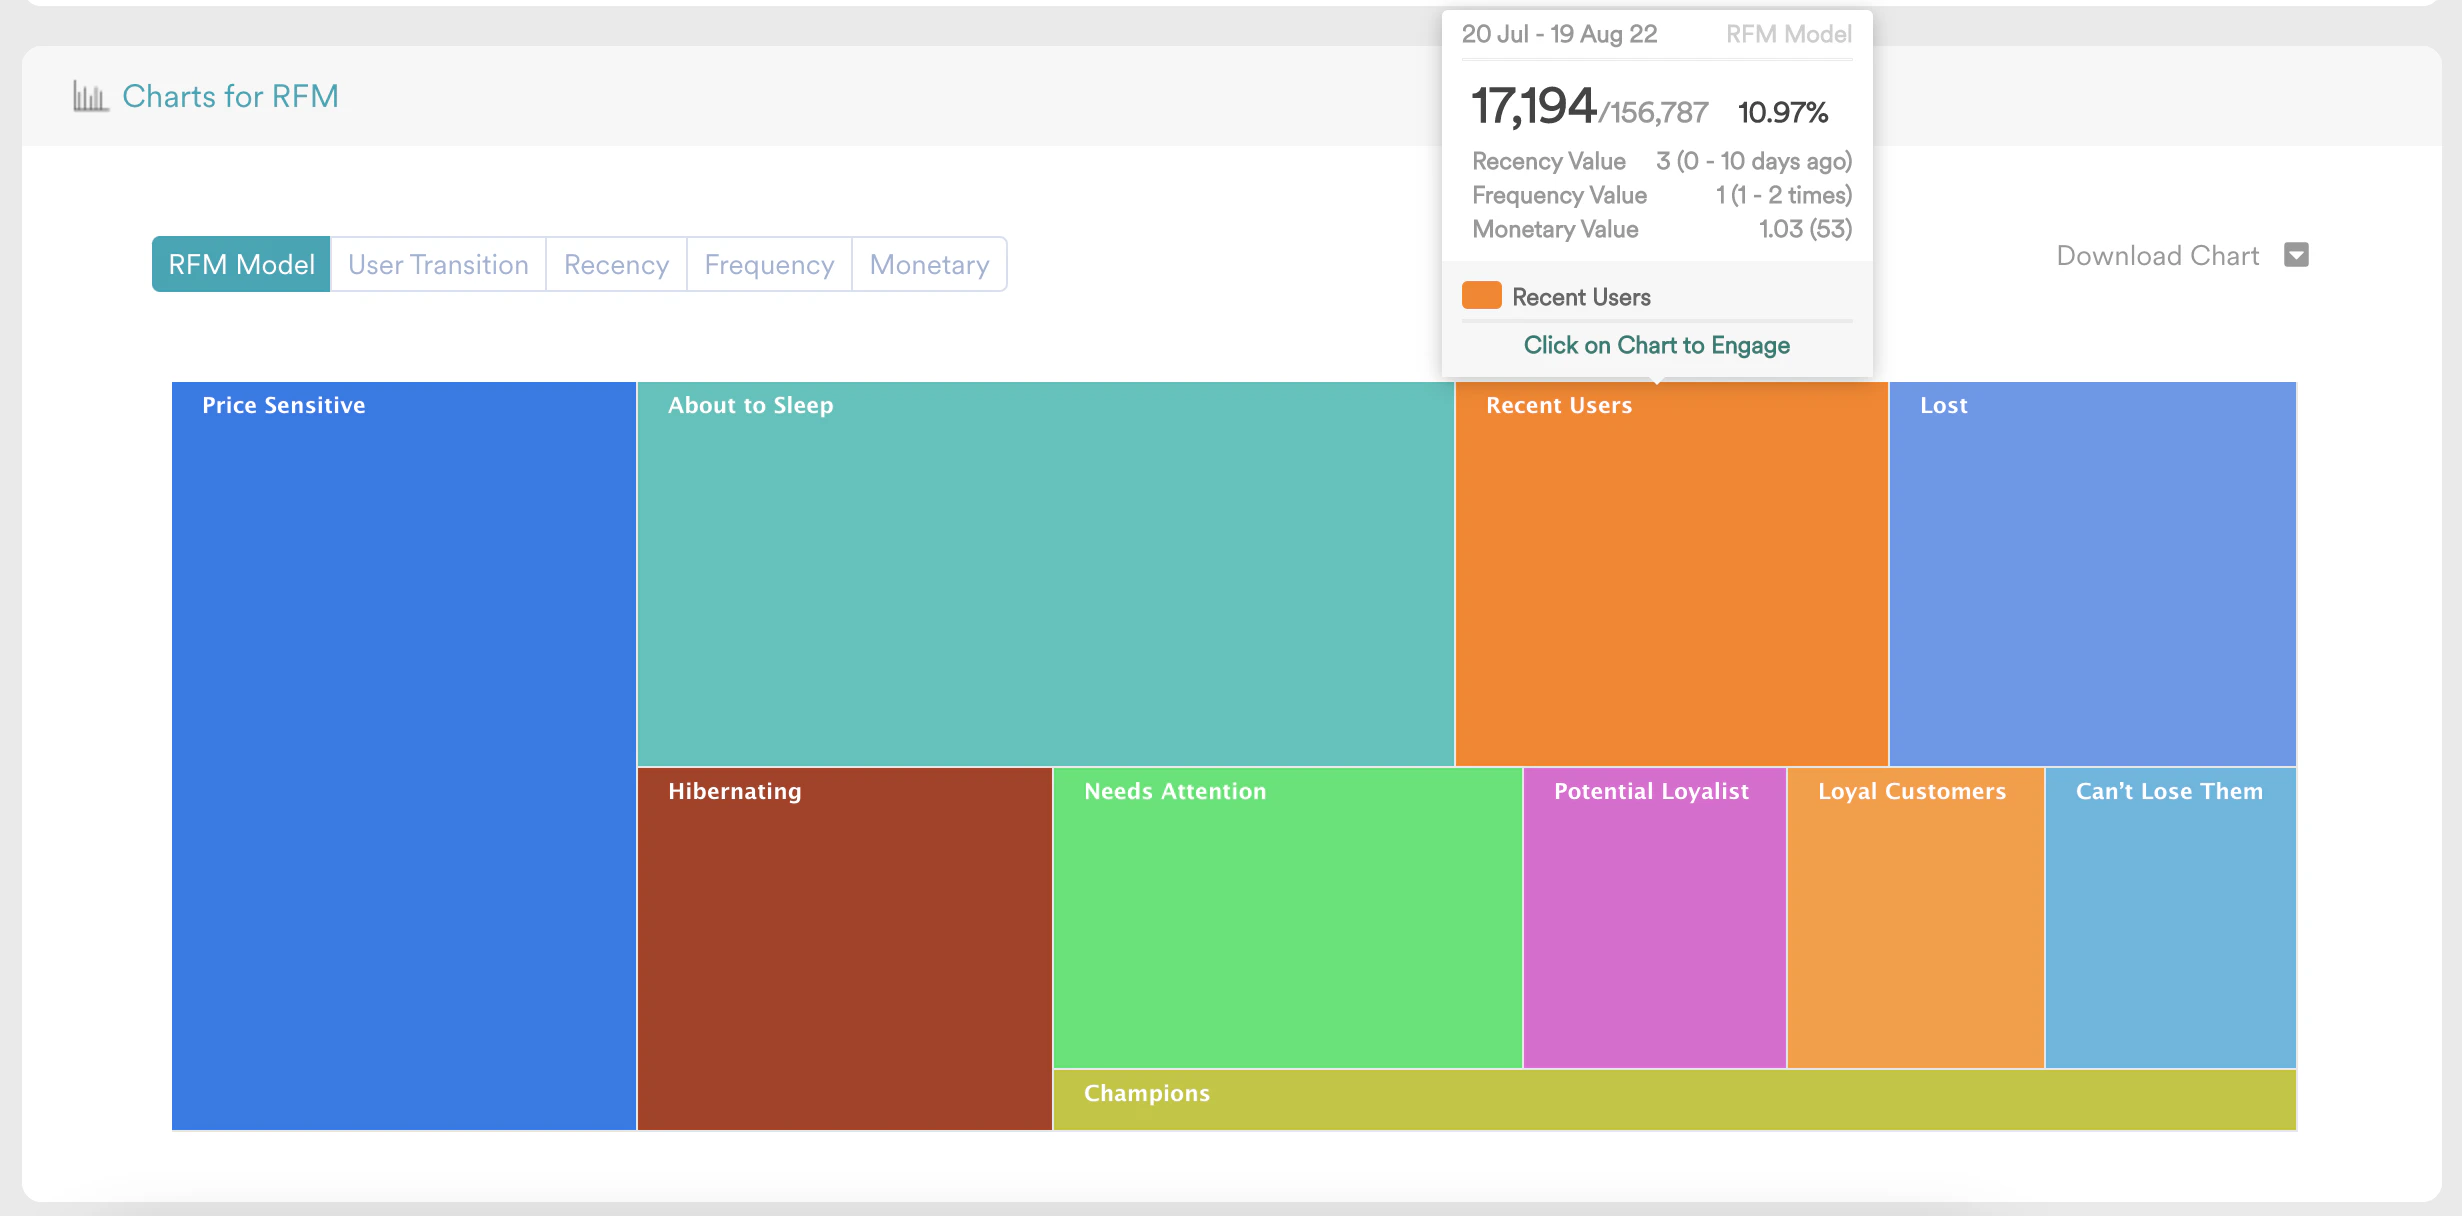
RFM Table
The table represents the same data shown in the chart, in tabular format. the table shows the RFM Segment Name, Recency Score, Recency Value Range, Frequency Score, Frequency Value Range, Monetary Score, Monetary Value Range, User Count, and Percentage of Users. Table data can be downloaded in CSV format for any further use.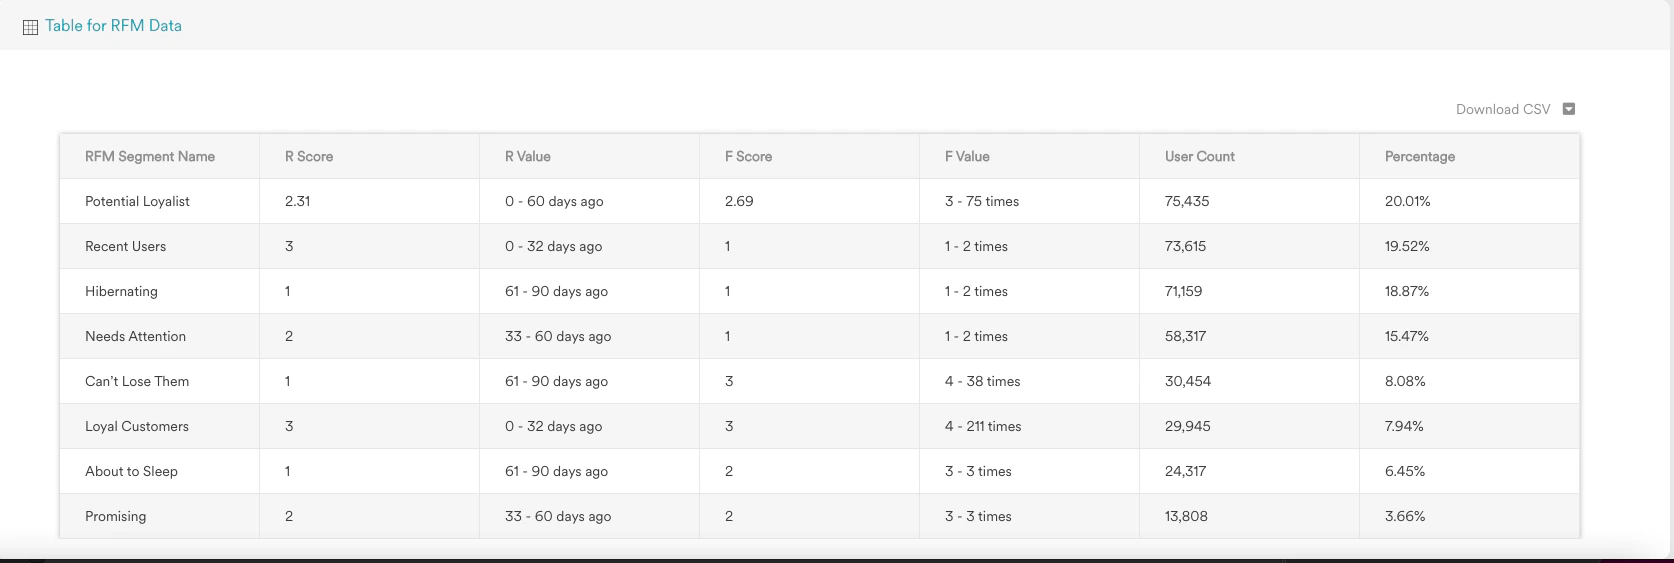
RFM Transition
RFM transition represents the count of users, of RFM Segments from Period 1, moving into RFM Segments of Period 2, over the Transition Duration. Transition Duration is the time period over which users migrate from one RFM segment to another RFM segment. The time duration of the origin RFM & destination RFM remains the same. Period 2 is what users select on the Date Range field, let’s say it is x days. Hence Period 1 will also be x days. The chronology here is - Period 1: Transition Duration: Period 2.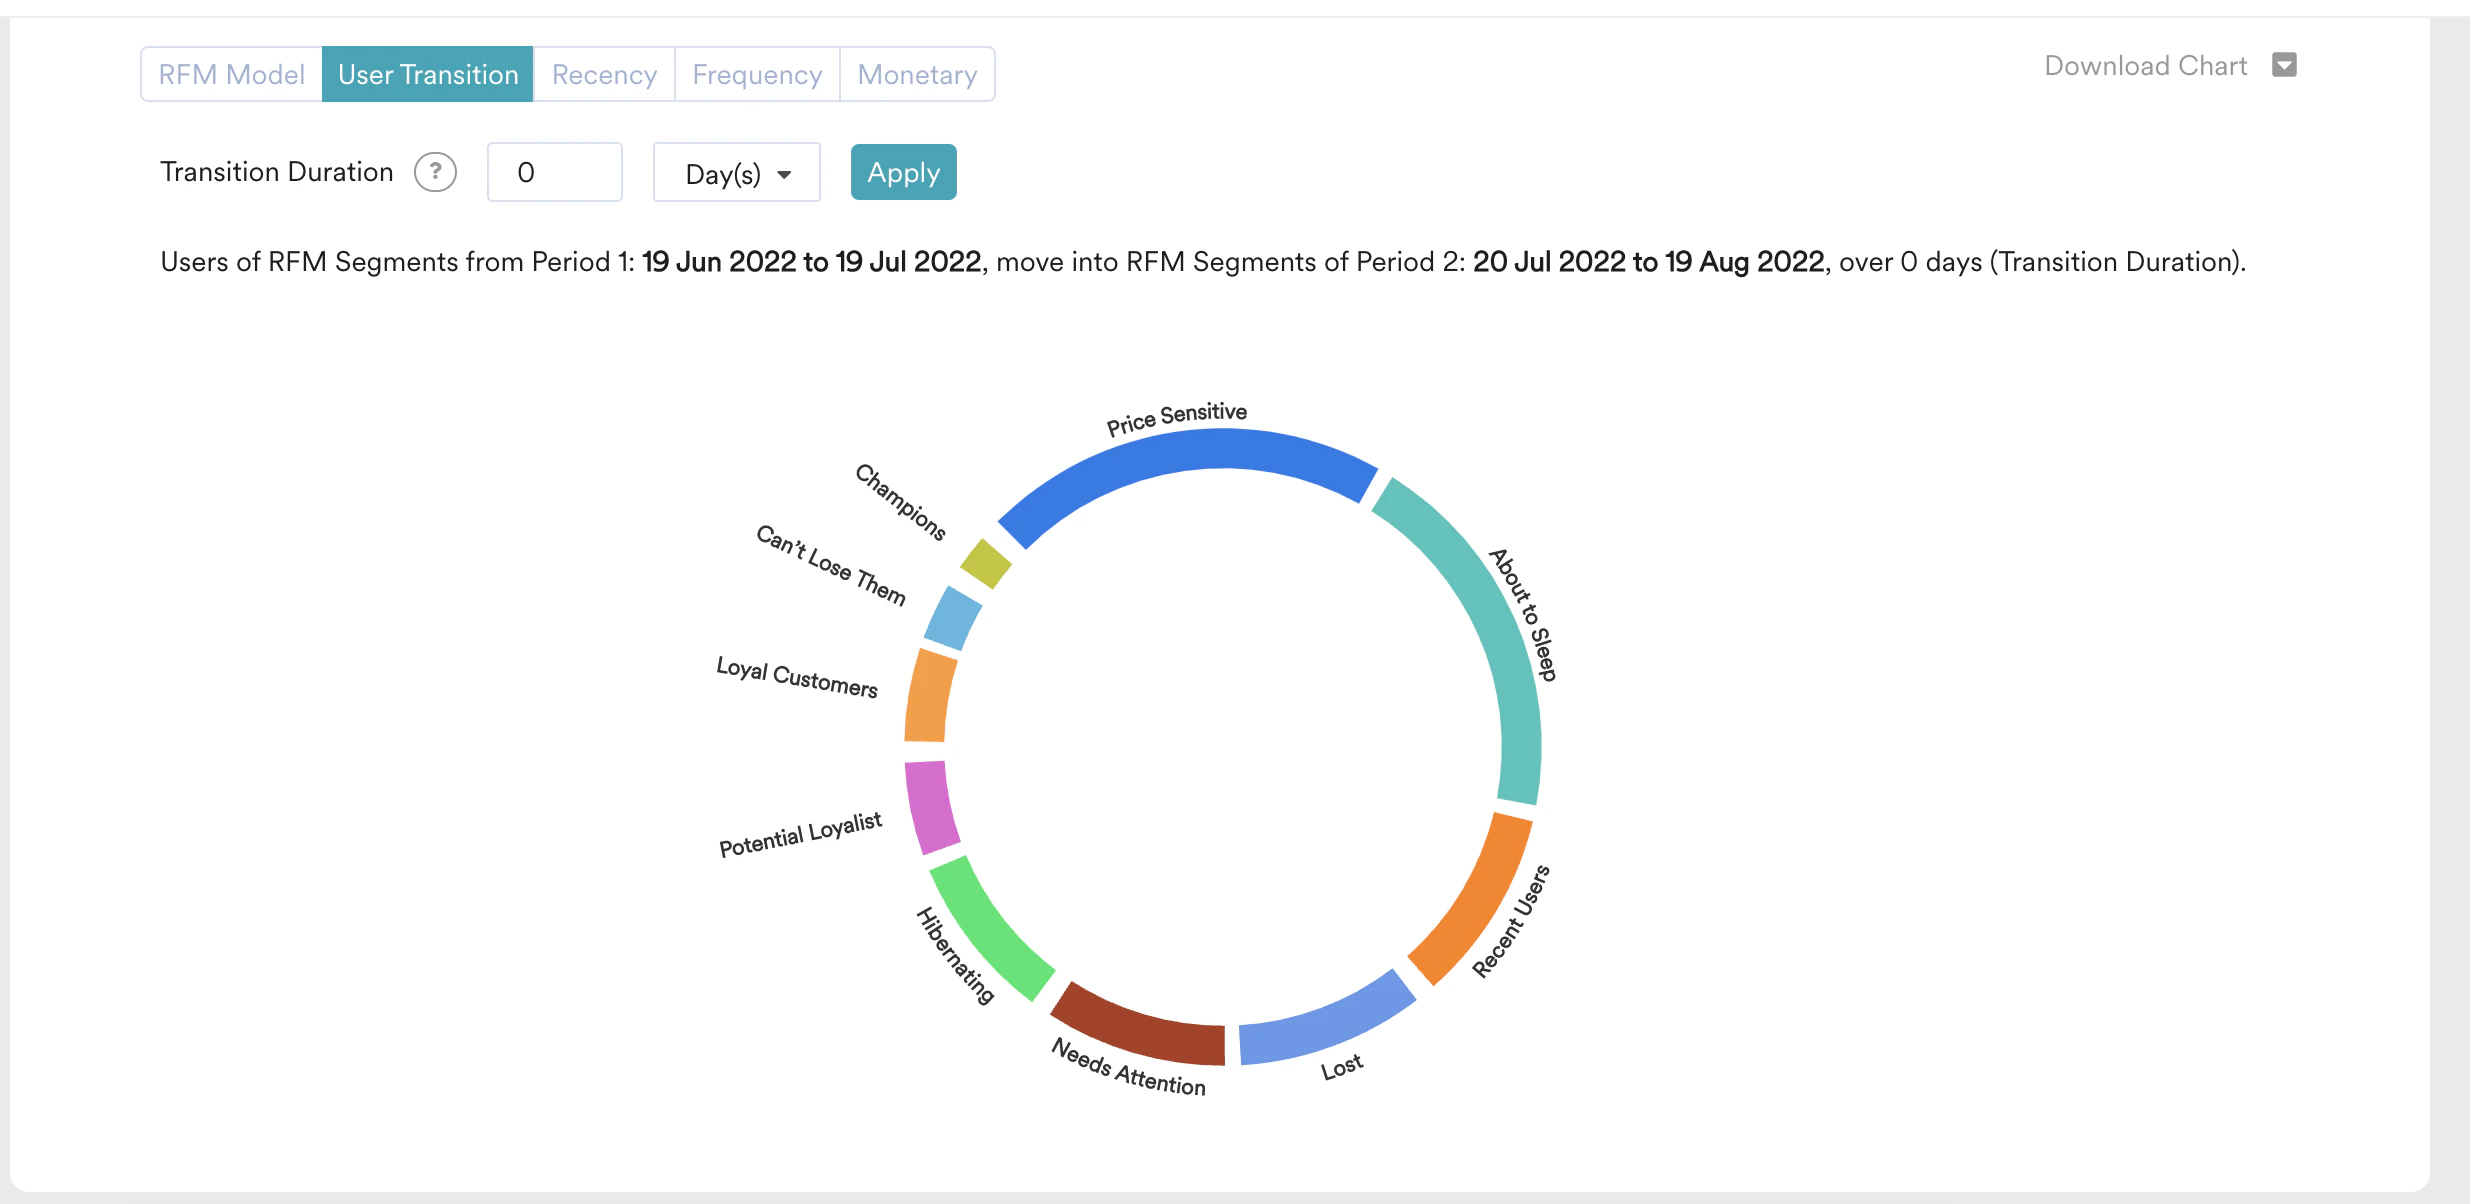
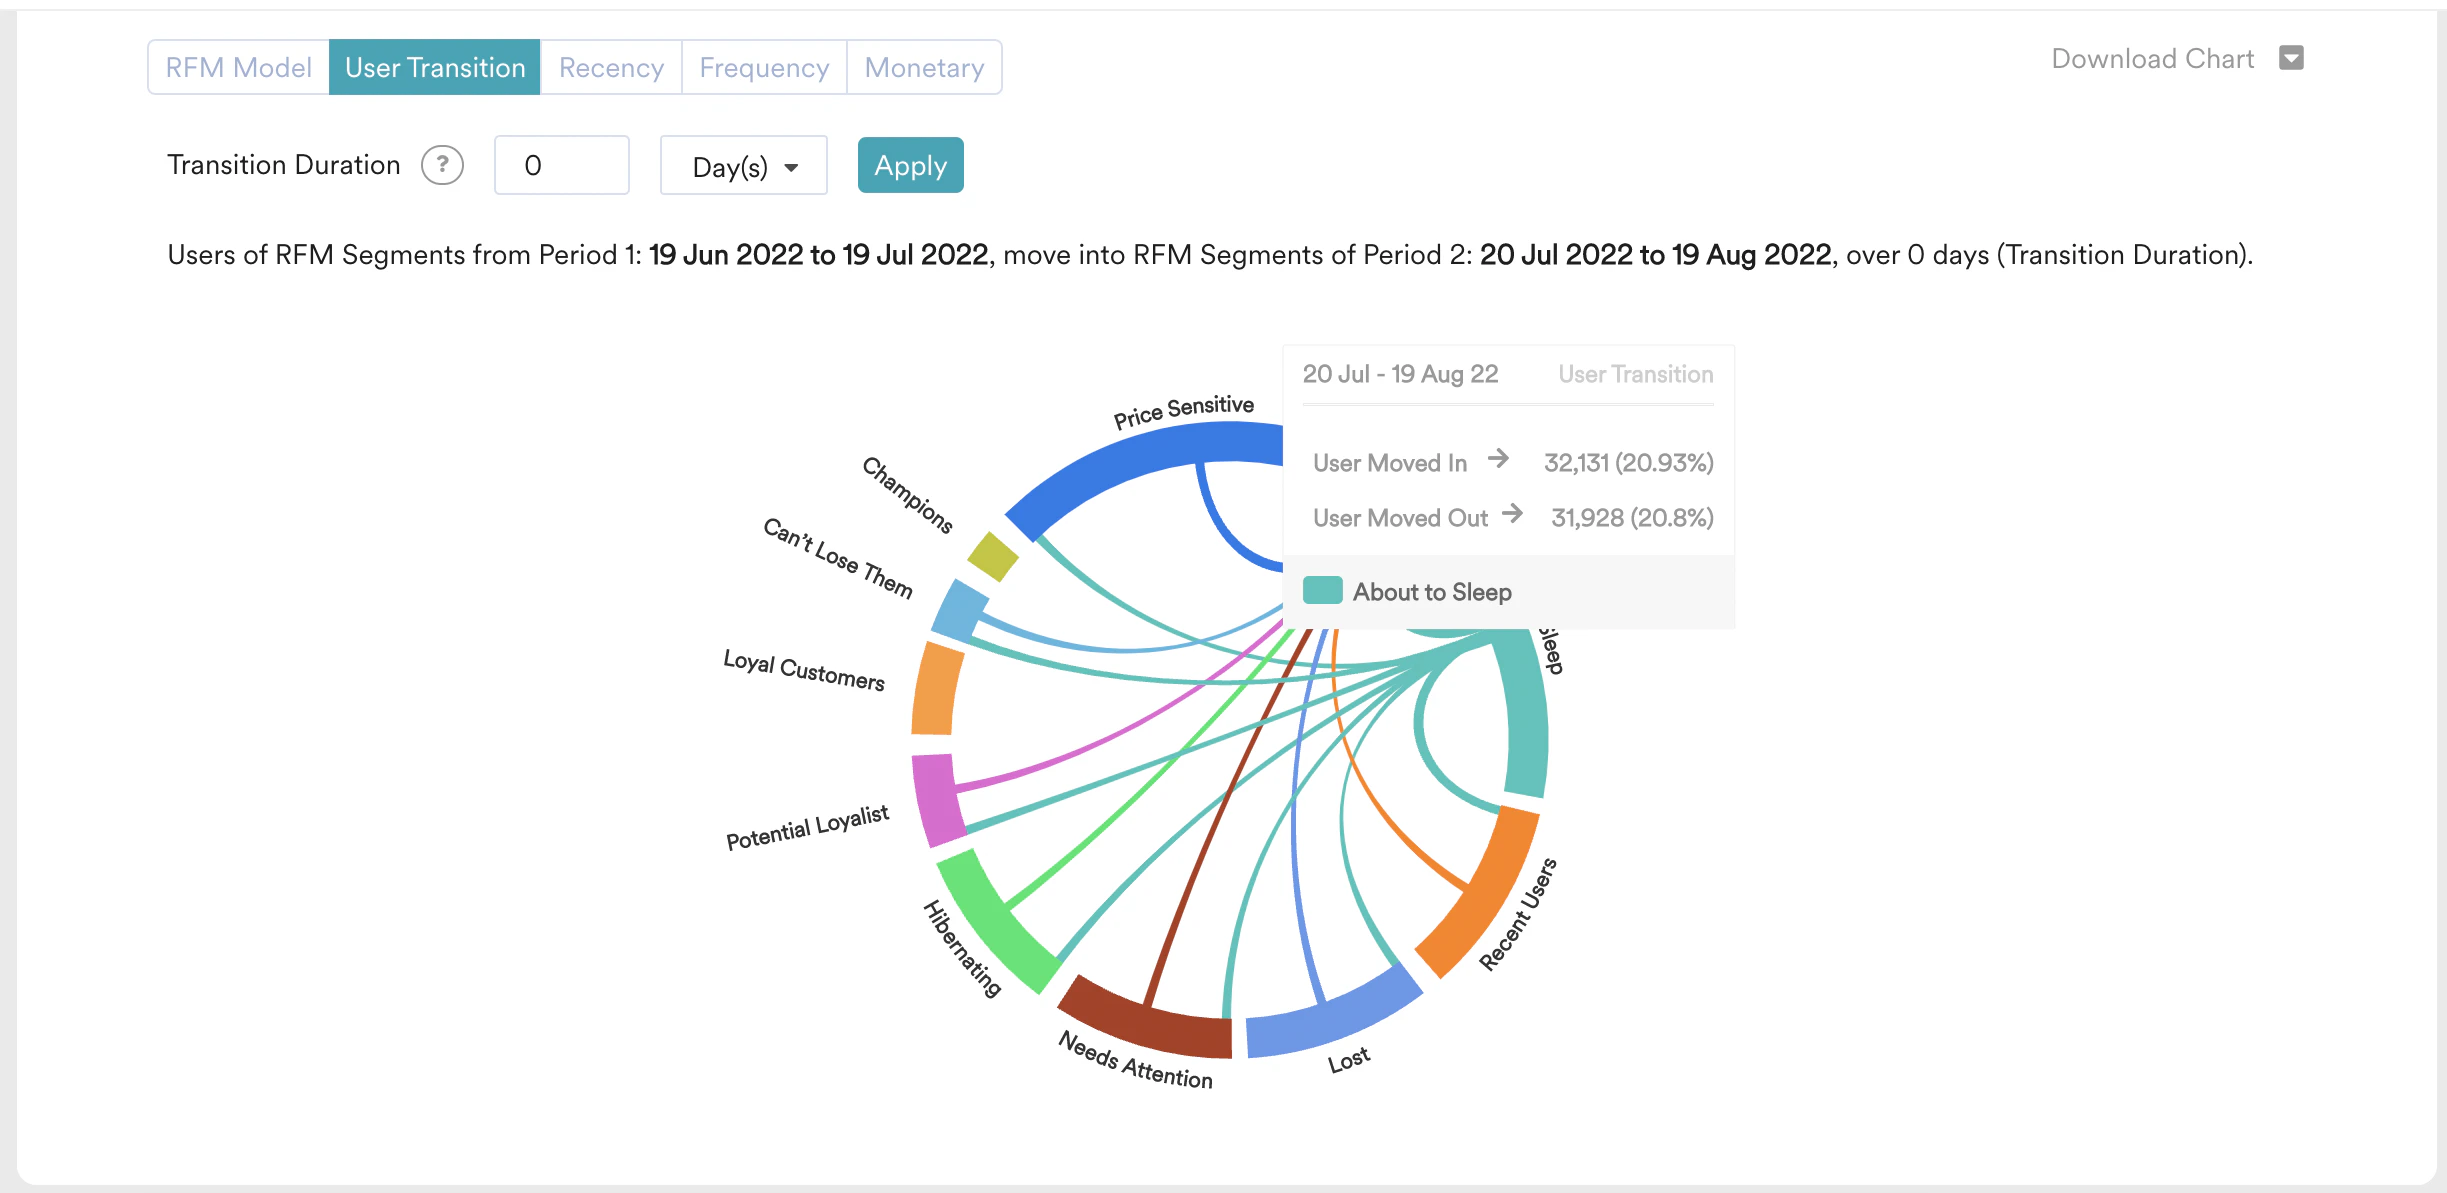
a. Total number is users who got into that segment and number of moved-in users as a percentage of overall user migration.
b. Total number of users moved out of that segment and number of moved-out users as a percentage of overall user migration.
a. Total number is users moved from a specific segment of period 1 RFM to a specific segment of period 2 RFM.
b. It also displays the number of moved-out users as a percentage of overall user migration.
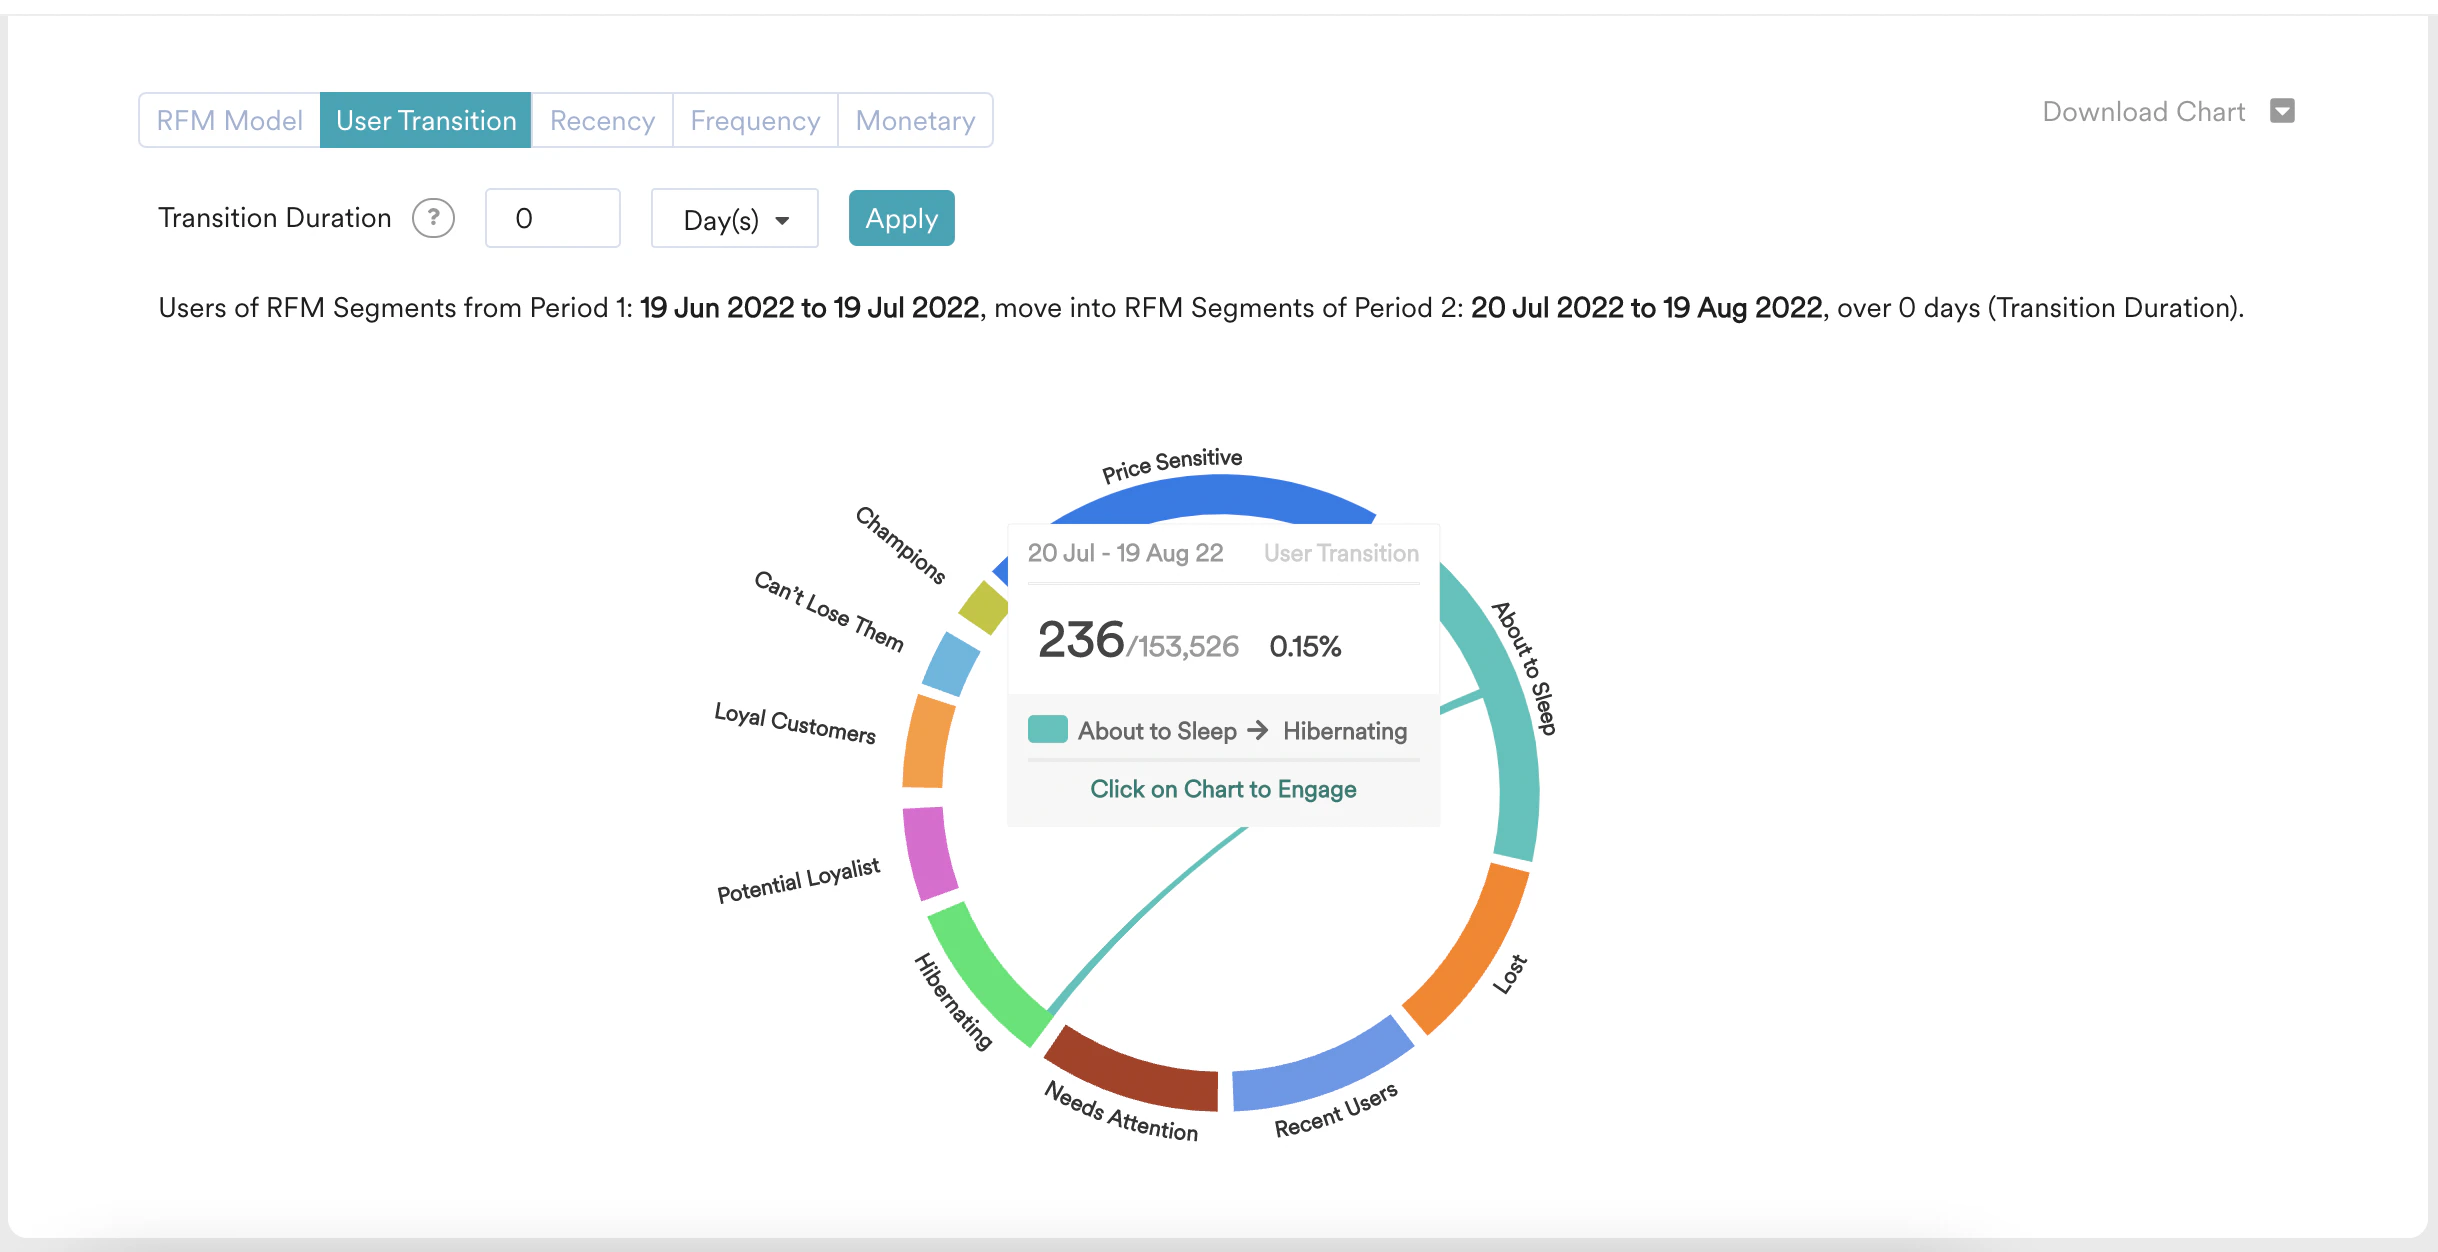
their respective user migration count, and percentage with respect to overall user migration.

Actionable Analytics on RFM
Users are able to create a custom segment or a campaign from RFM Chart or User Transition chart. Clicking on the chart area of the RFM segment or User Transition chord shows a popup, which let the user create a custom segment or campaign.
RFM Distribution
RFM Distribution charts show the distribution of users on Recency, Frequency, and Monetary parameters. Recency Distribution is a distribution of time, from the last visit to the app or time since the last purchase. Frequency Distribution is a distribution of the number of times, users have visited the app or users made purchases. Monetary Distribution is a distribution of revenue generated by reach users.