

Availability of this feature depends on your MoEngage plan and may require a paid add-on. To check what’s available for your plan, refer to Plans and Pricing. To get this feature, contact your MoEngage Customer Success Manager (CSM) or the Support team.
Overview
Alerts let you monitor your analysis data without manually checking dashboards. You define a condition on a saved analysis, and MoEngage emails you when that condition is met — so you can respond to anomalies, drops, and spikes as soon as they happen. You can create alerts on the following analysis types:Applications
With alerts, you can:- Track behavior trends — get notified when total events, unique users, or unique sessions for a tracked event change significantly.
- Monitor retention — watch a specific retention day, such as D7, and get notified when retention moves up or down.
- Catch funnel drop-offs — alert on the number of users converting between any two steps of a funnel to spot regressions in the customer journey.
- Watch session and acquisition health — track session count, bounce rate, or revenue across sources and get notified when a key metric shifts.
Who Can Create Alerts
Users with the Admin, Manager, Marketer, or Analyst role can create and manage alerts. Developers can’t create or manage alerts. You can configure alert access for each role under Settings > Account > Team Management > Roles > OOB Alerts Management.Create an Alert
Creating an alert is a two-step process: Step 1: Create Analysis Step 2: Create a New AlertCreate Analysis
You can set an alert on any saved Behavior, Retention, Funnel, or Session and source analysis. The high-level flow is the same across analysis types:1
Build your analysis
From the left sidebar, go to Analyze and choose the analysis type you want to alert on — Behavior, Retention, Funnels, or Session and source. Configure events, filters, and options, then click Apply to view the chart.
2
Save to My Studio
Click the Save dropdown and select Save to My Studio.
You must save the analysis to My Studio before you can set an alert on it.
Example: Behavior Analysis
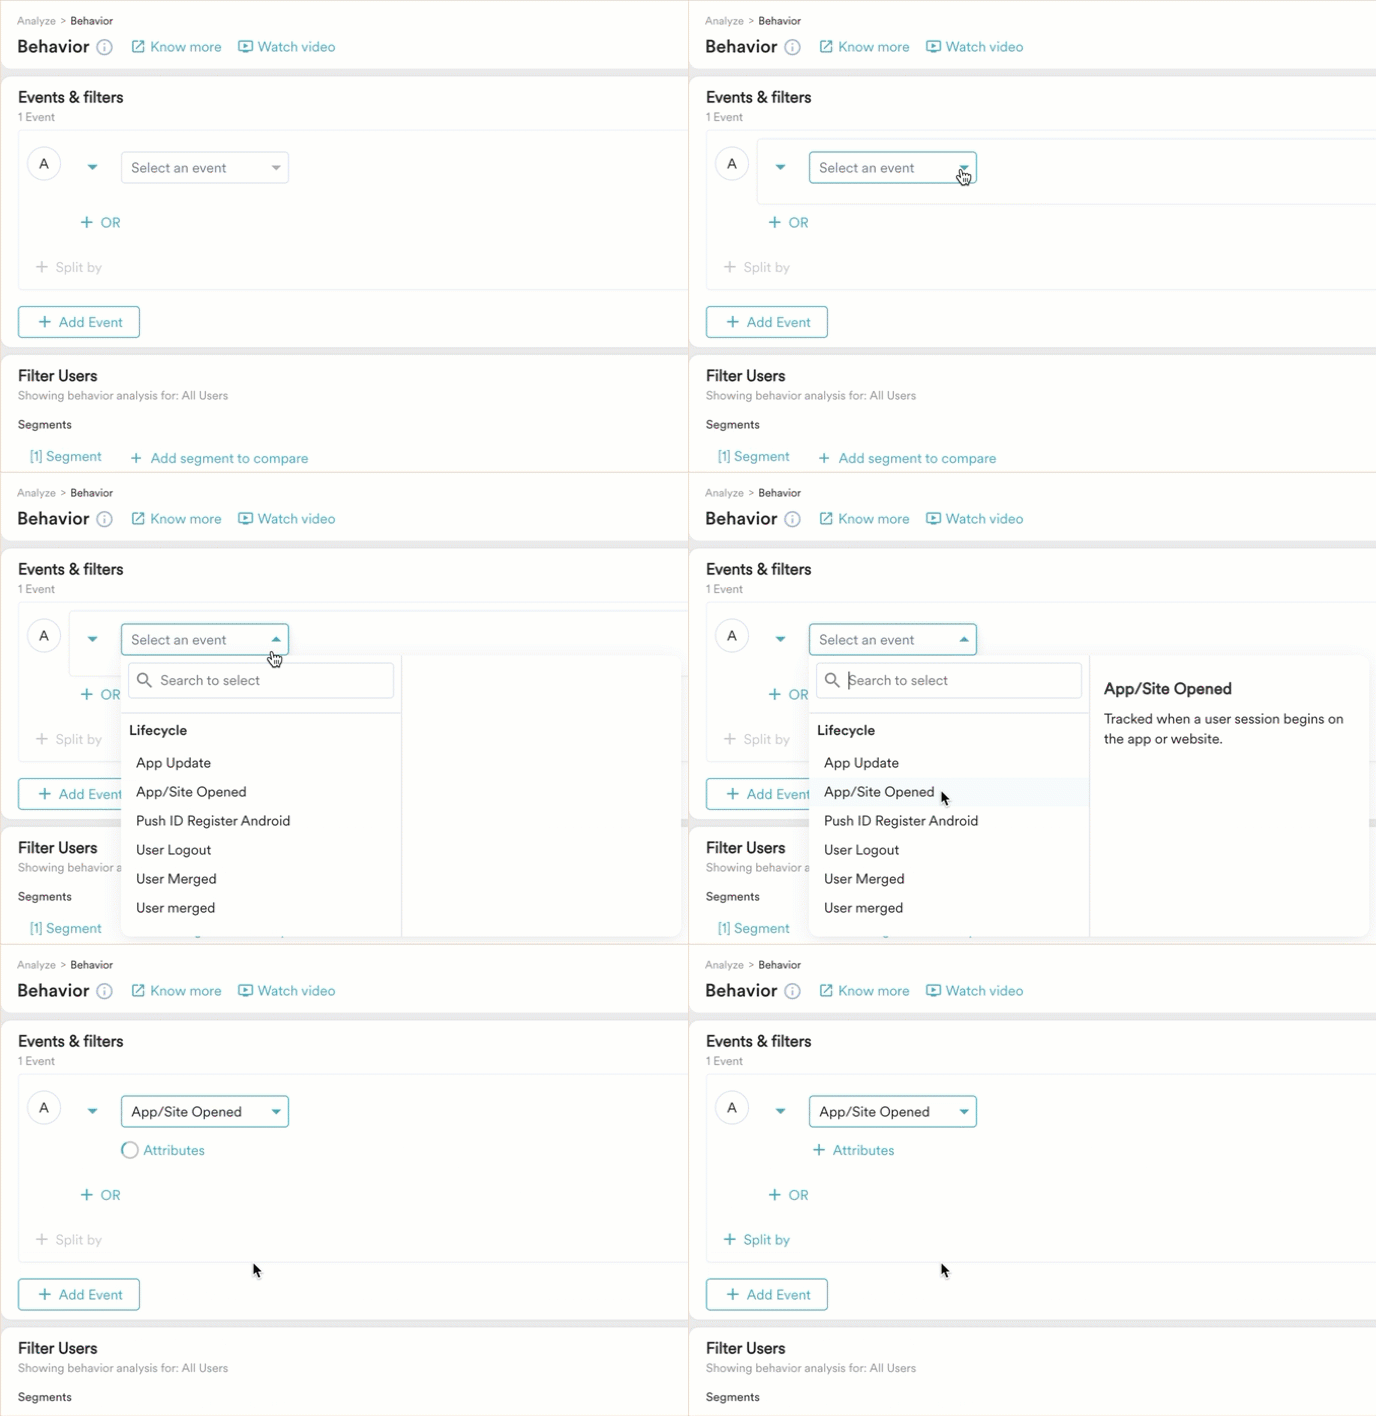
This walkthrough builds a Behavior analysis on the App/Site Opened event so you can alert when the app or site is opened more than 50 times.- In the left sidebar of your MoEngage dashboard, go to Analyze > Behavior.
-
In the Events & Filters section, click the dropdown and then select App/Site Opened.
Optional
You can add the following filters to your event:-
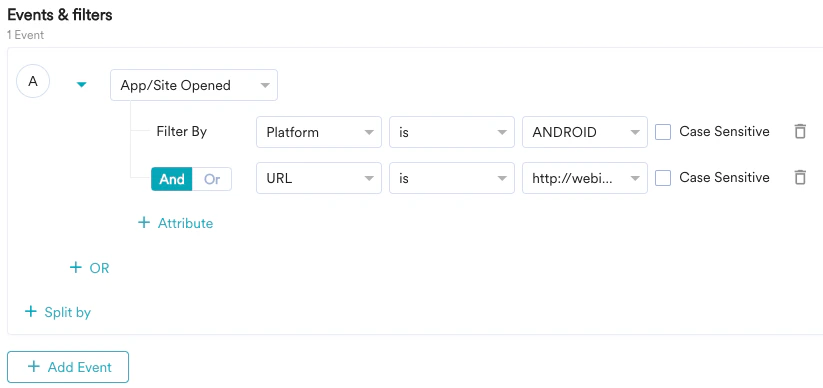
Add multiple attributes — Combine attributes on your event using the AND or OR logical operators. The analysis applies all attributes and displays the result.
-
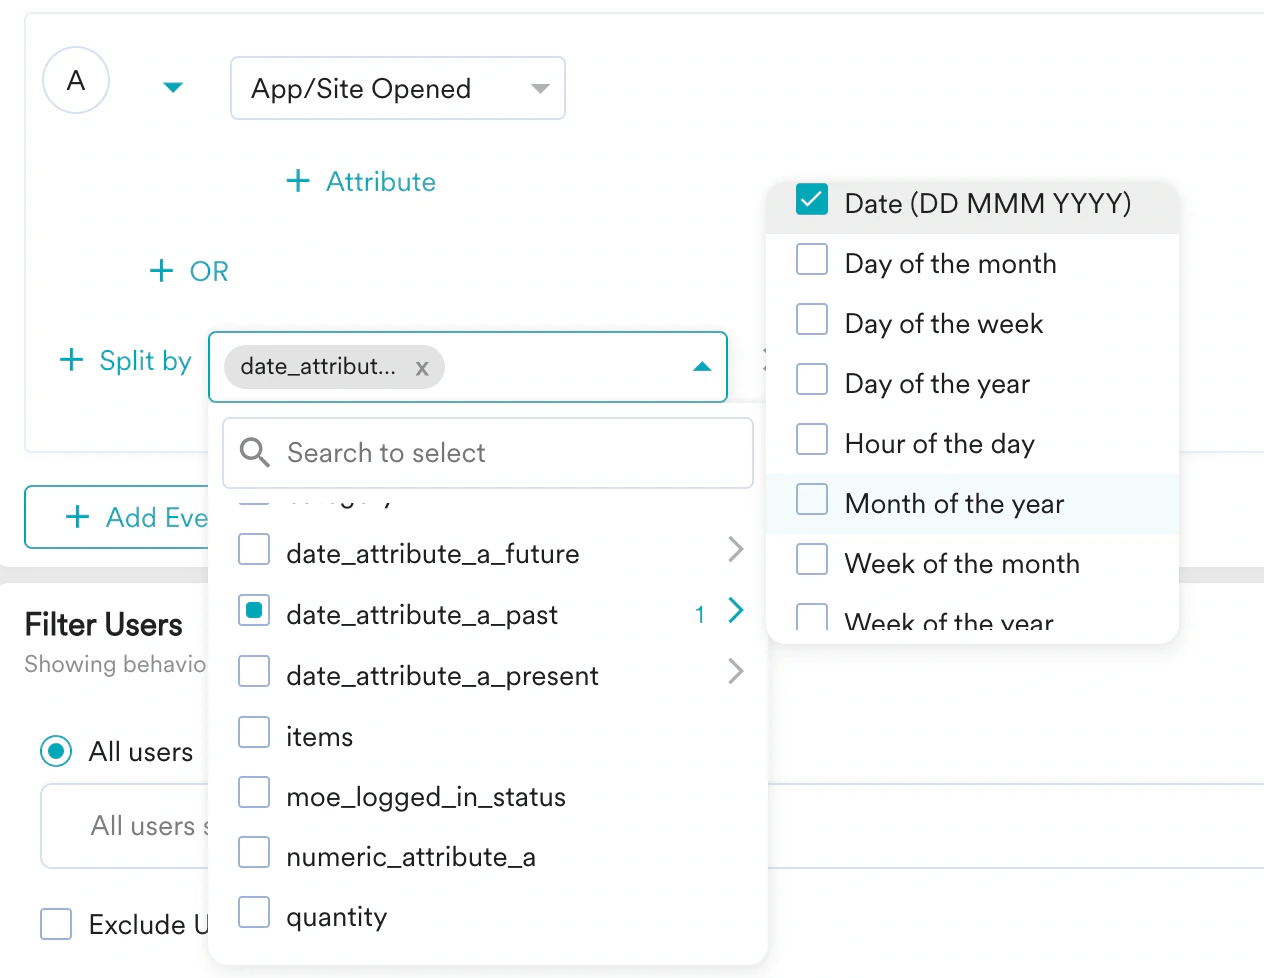
Split events — Use the Split by option to compare the selected attribute with another from the dropdown. To learn more, see Comparing Properties.
-
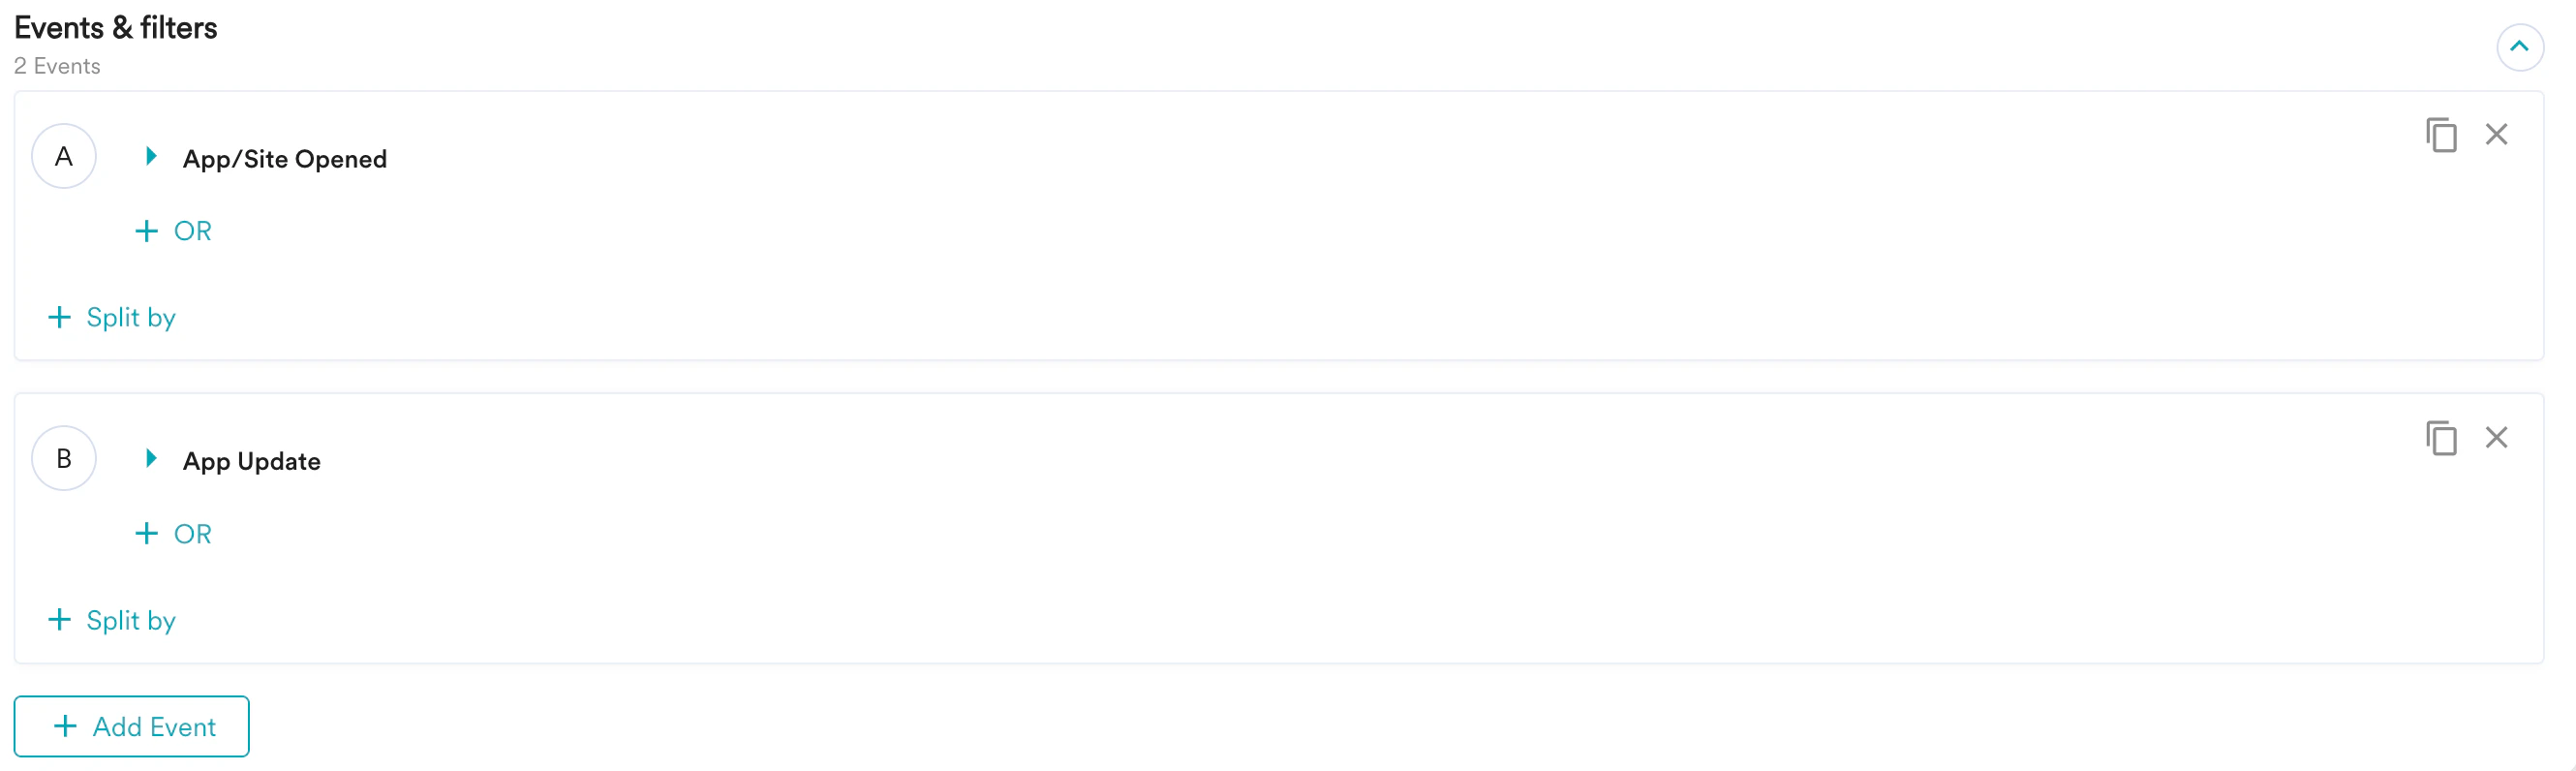
Add multiple events — Use the + Add Event button to add up to 10 events. The analysis runs all events and displays the result.
-
Add multiple attributes — Combine attributes on your event using the AND or OR logical operators. The analysis applies all attributes and displays the result.
-
Choose which users this analysis applies to. By default, the analysis runs on all users in the workspace. To narrow it down, use the Filter by users option.
To learn more, see Filter Users.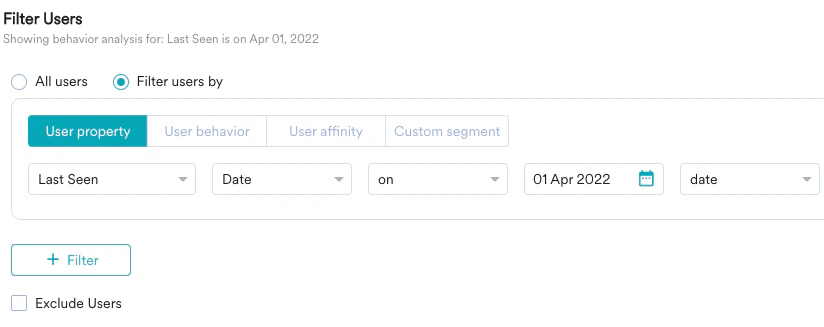
-
In the Behavior Options section, select an analysis type to calculate. You can create alerts on these analysis types:
- Total Events
- Unique Users
- Unique Sessions
- Aggregation
-
Total Events Per User

- Click Apply.
-
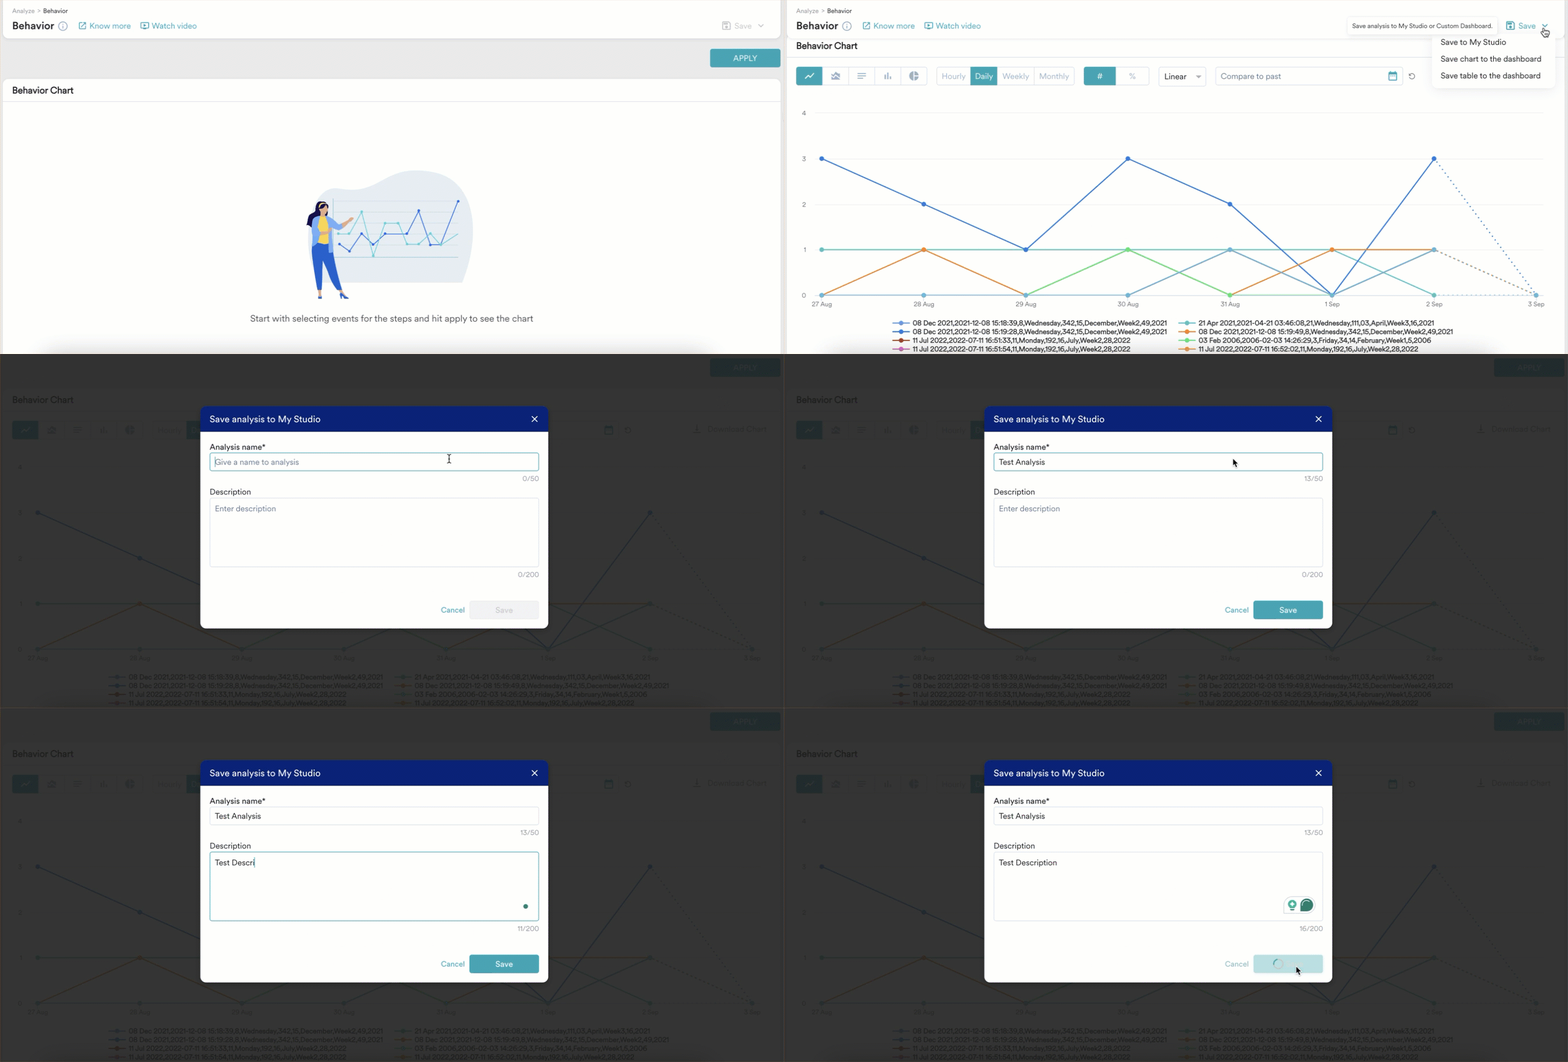
When the Behavior Chart appears, click the Save dropdown and select Save to My Studio.
Create a New Alert
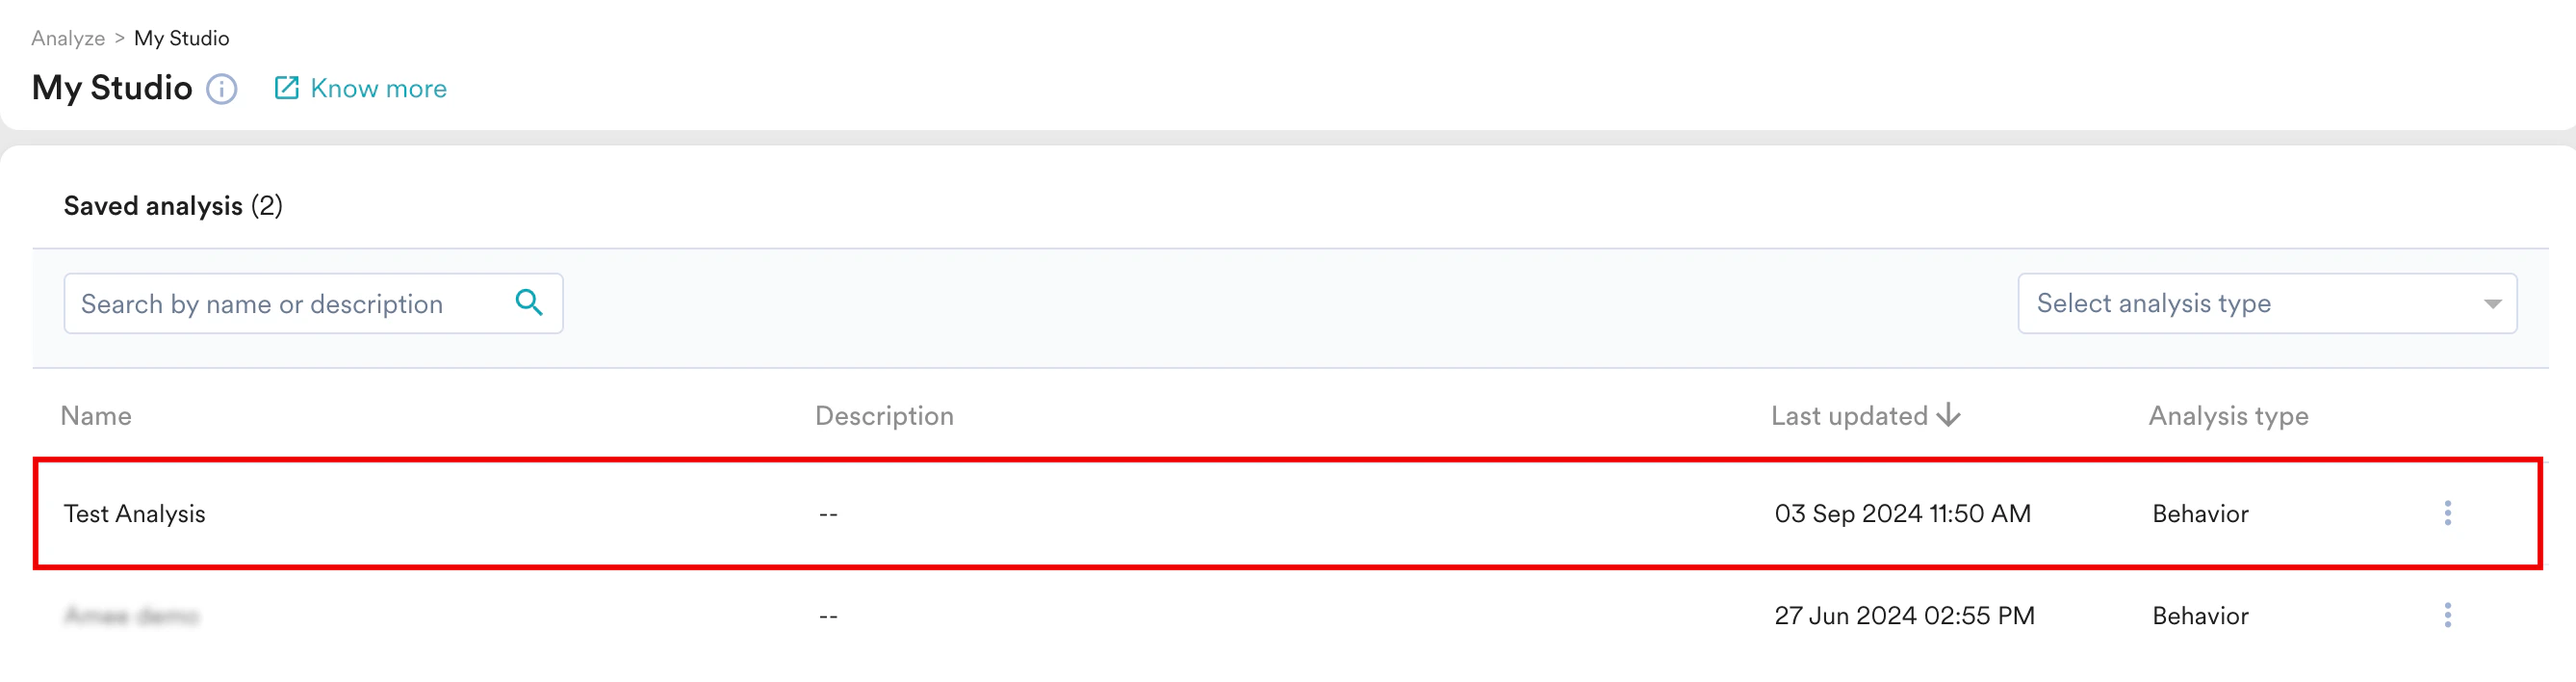
After you create your analysis, set an alert for it from My Studio. To create an alert,- In the left sidebar of your MoEngage dashboard, go to Analyze > My Studio.
-
Select your analysis from the list of Saved analysis.
-
Click Apply to view the analysis chart, then select your chart type and granularity. See Alert Subscription Details for supported chart and granularity combinations.
- Alerts aren’t supported on hourly chart granularity.
- Alerts aren’t supported when time-series or segment comparison is applied.
- The timezone defaults to your app timezone.
-
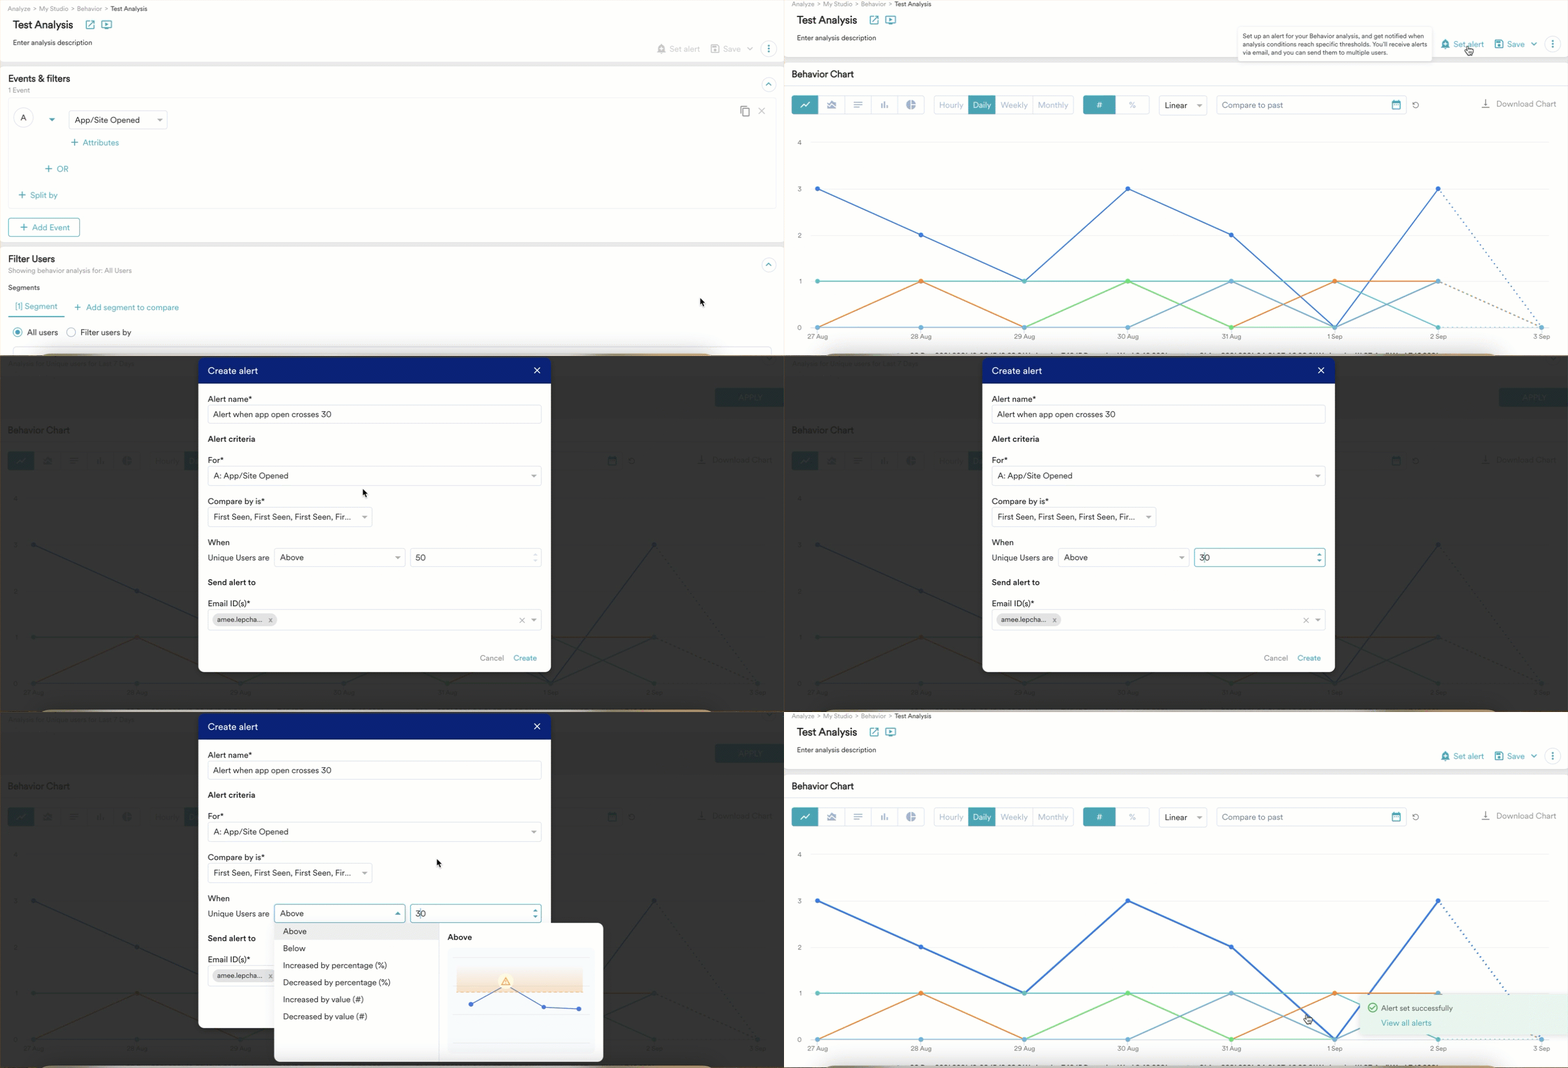
Click Set alert to create a new alert for the selected analysis.
-
On the Create alert pop-up, enter the following details:
- Alert Name — a unique name for the alert.
- Alert Criteria — the trigger condition. The available conditions depend on the analysis type. See Alert Criteria by Analysis Type.
- Alert Recipients — the email addresses of subscribers who should receive the alert. Recipients must have access to the workspace.
- Alert evaluation time — when the alert is evaluated and the email is sent.
- Click Create.
Alert Criteria by Analysis Type
The conditions you can set on an alert depend on the analysis type.Behavior
Trigger an alert based on event counts or aggregated values. Available conditions:- Above — triggers when the count for the selected analysis goes above the threshold value.
- Below — triggers when the count goes below the threshold value.
- Increased by percentage (%) or value (#) — triggers when the count increases relative to the previous period, either by a percentage or by a fixed value.
- Decreased by percentage (%) or value (#) — triggers when the count decreases relative to the previous period, either by a percentage or by a fixed value.
- Select event — the event you chose during analysis creation.
- Select Split by — an event attribute and value. For example, on the App/Site Opened event, split by Platform where Platform is Android.
- Select Group by user property — a user property and value. For example, on the App/Site Opened event, group by last known country where country is USA.
Retention
Trigger an alert on retention for a specific day in your cohort, such as D7.- Supports Increased by or Decreased by percentage (%) or value (#).
- Above and Below thresholds aren’t applicable for Retention.
Funnel
Trigger an alert on the number of users who convert between any two steps of the funnel.- The first step is the fixed starting point. You select a second step, and the alert tracks conversions between the two.
- Funnel alerts evaluate the count of converted users between the two steps — not the conversion rate. The condition you set is compared against the number of users who completed the second step, regardless of how many users entered the first step.
- Split by attributes are supported.
- Above — triggers when the count of converted users goes above the threshold value. For example, with a threshold of 60, the alert fires when 61 users convert.
- Below — triggers when the count of converted users falls below the threshold value. For example, with a threshold of 50, the alert fires when fewer than 50 users convert.
- Increased by percentage (%) or value (#) — triggers when the count of converted users increases relative to the previous period, either by a percentage or by a fixed number of users.
- Decreased by percentage (%) or value (#) — triggers when the count of converted users decreases relative to the previous period, either by a percentage or by a fixed number of users.
Funnel alerts measure the count of converted users, not the conversion rate. A change in traffic volume can trigger or suppress an alert even when the conversion rate between the two steps hasn’t changed.
Session and Source
Trigger an alert on session-level metrics across sources, such as session count, bounce rate, or revenue.- Most metrics support Above, Below, Increased by, or Decreased by. You can set these as a fixed value, or as a percentage (%) or value (#) compared to a baseline.
- Bounce rate only supports Increased by or Decreased by percentage (%).
Comparison Periods
For Increased by and Decreased by conditions, the comparison periods you can choose depend on the chart granularity:
Previous Quarter and Custom Range aren’t supported.
View the Email Alert
After you set up an alert, you receive an email when the specified conditions are met. The email includes a visualization and details about the alert: the change in the metric, the percentage change, and the timestamp when the data was evaluated.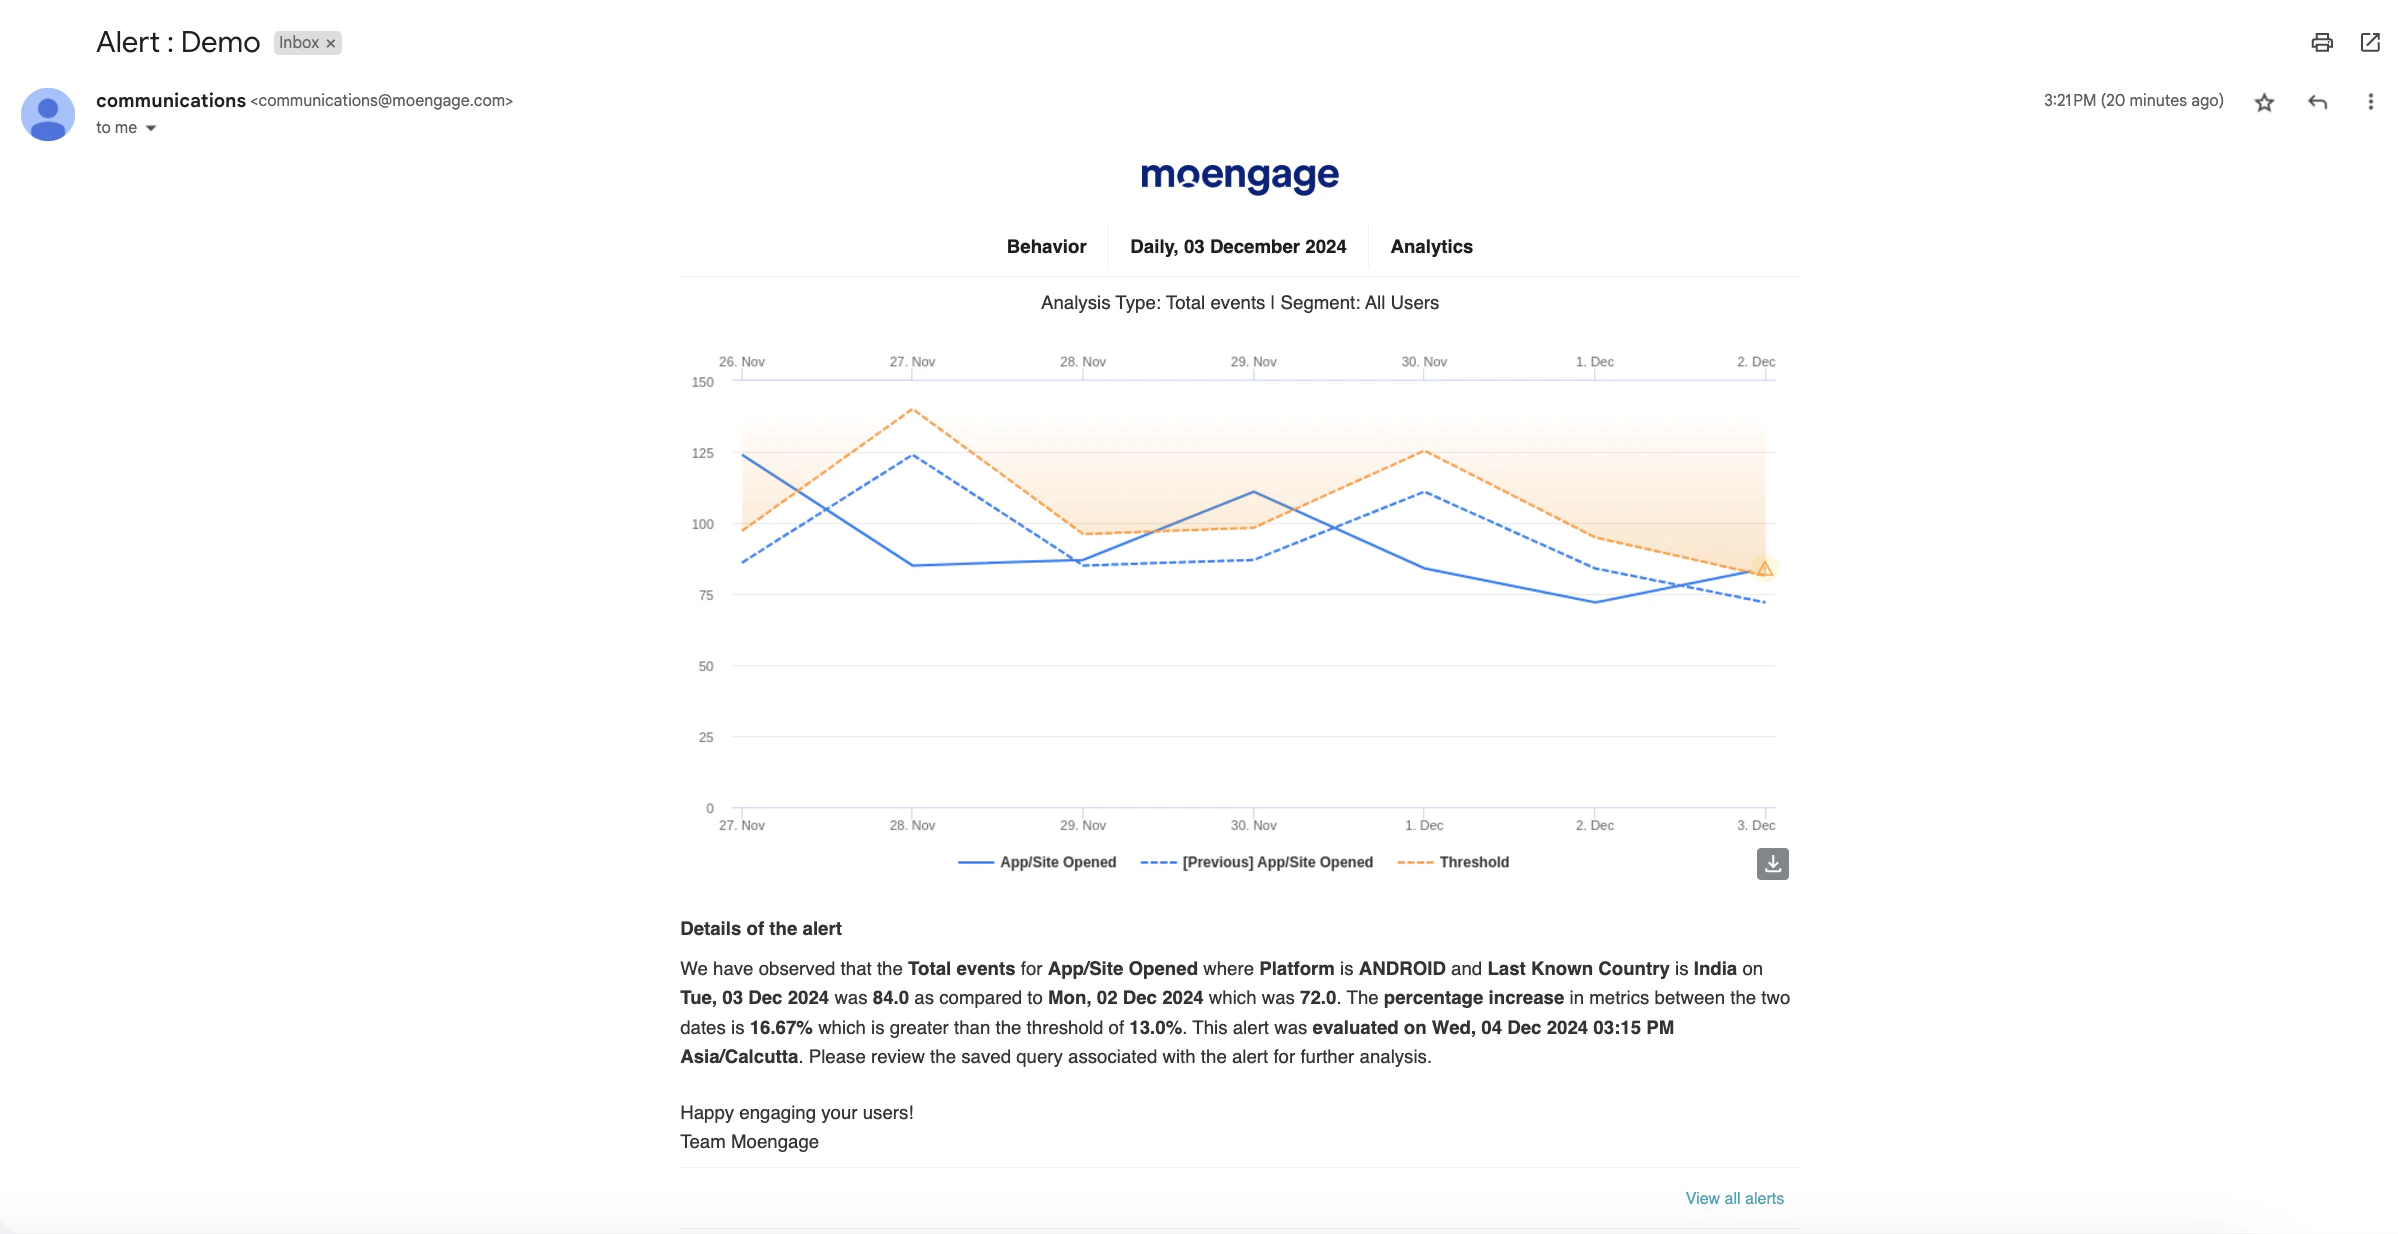
Allow at least 10 minutes of inactivity between creating and scheduling an alert. Otherwise, the alert is scheduled for the next day.
Unsubscribe, Subscribe, and Delete Alerts
Follow the steps below to view and manage your alerts in your MoEngage dashboard:- Click the Settings icon on the left sidebar of your MoEngage dashboard.
-
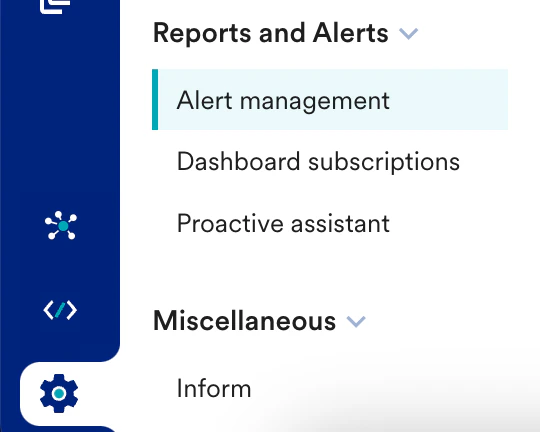
Scroll down to Reports and Alerts and then select Alert management from the dropdown.
-
Select the Analytics alerts tab and then search for the alert that you want to view or manage.
Use these options to narrow down your search:- Use the search bar to find your alert.
- Use the Created by dropdown to filter alerts by who created them.
-
Use the Subscribed by dropdown to filter alerts by their recipients.

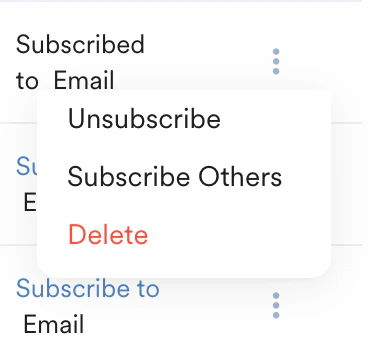
- Once you locate your alert, click the vertical ellipsis icon under the Actions column at the right end of the table.
-
You can take the following actions:
- Unsubscribe: Remove users from the alert so they no longer receive it for the chosen analysis.
- Subscribe Others: Add other users to the alert by selecting their email addresses from the dropdown.
-
Delete: Permanently remove the alert.
Alert Subscription Details
This section explains how alerts behave for different chart types and granularities.| Subscription Frequency | Chart | |
|---|---|---|
| Line | Bar and Column | |
| Daily | You receive the alert at a set time each day. 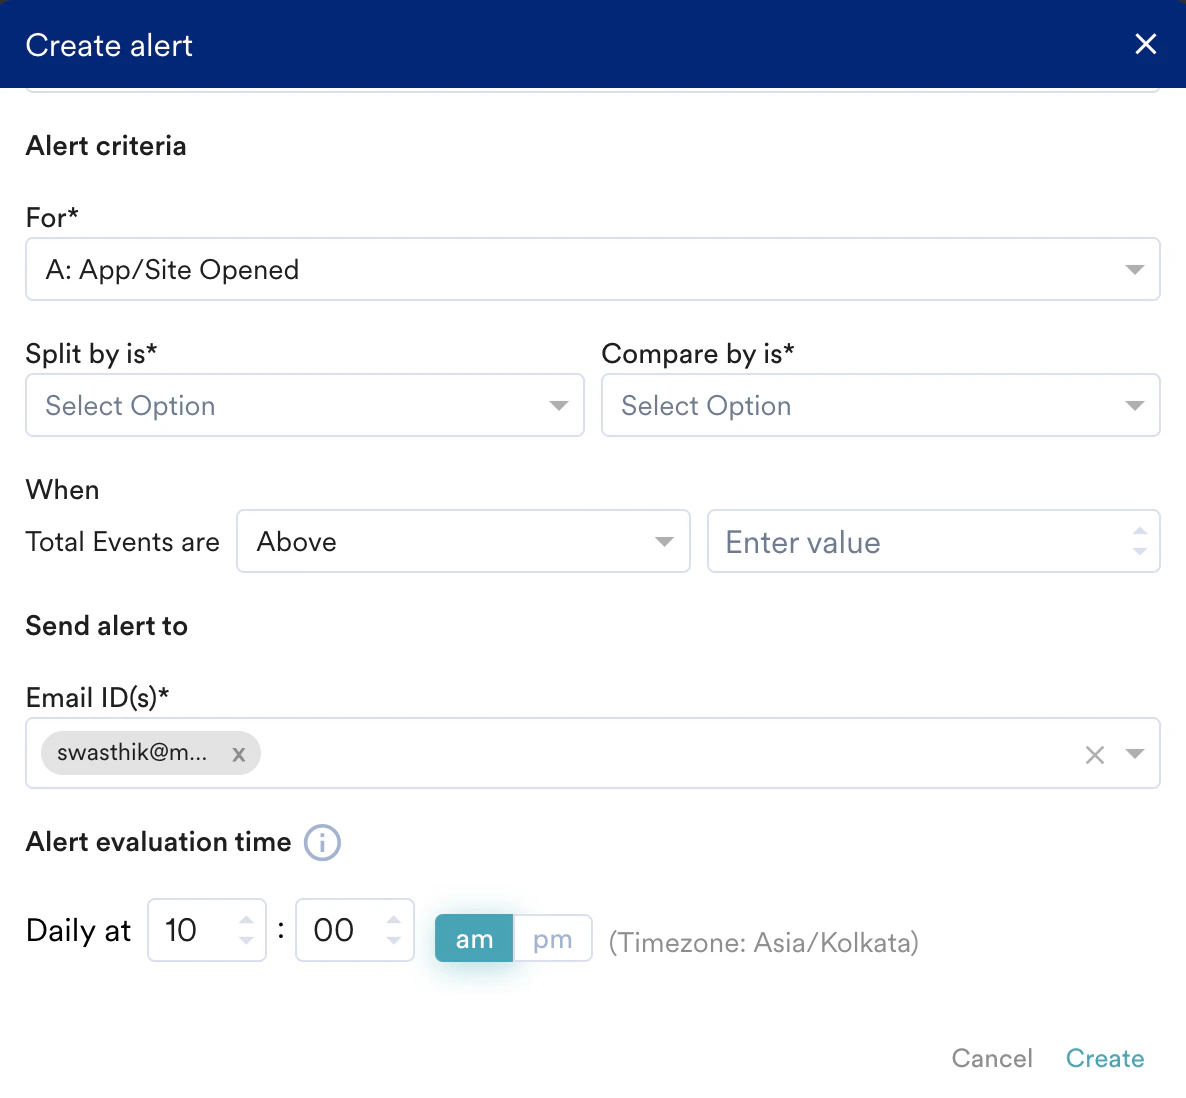 | You receive the alert at a set time each day. 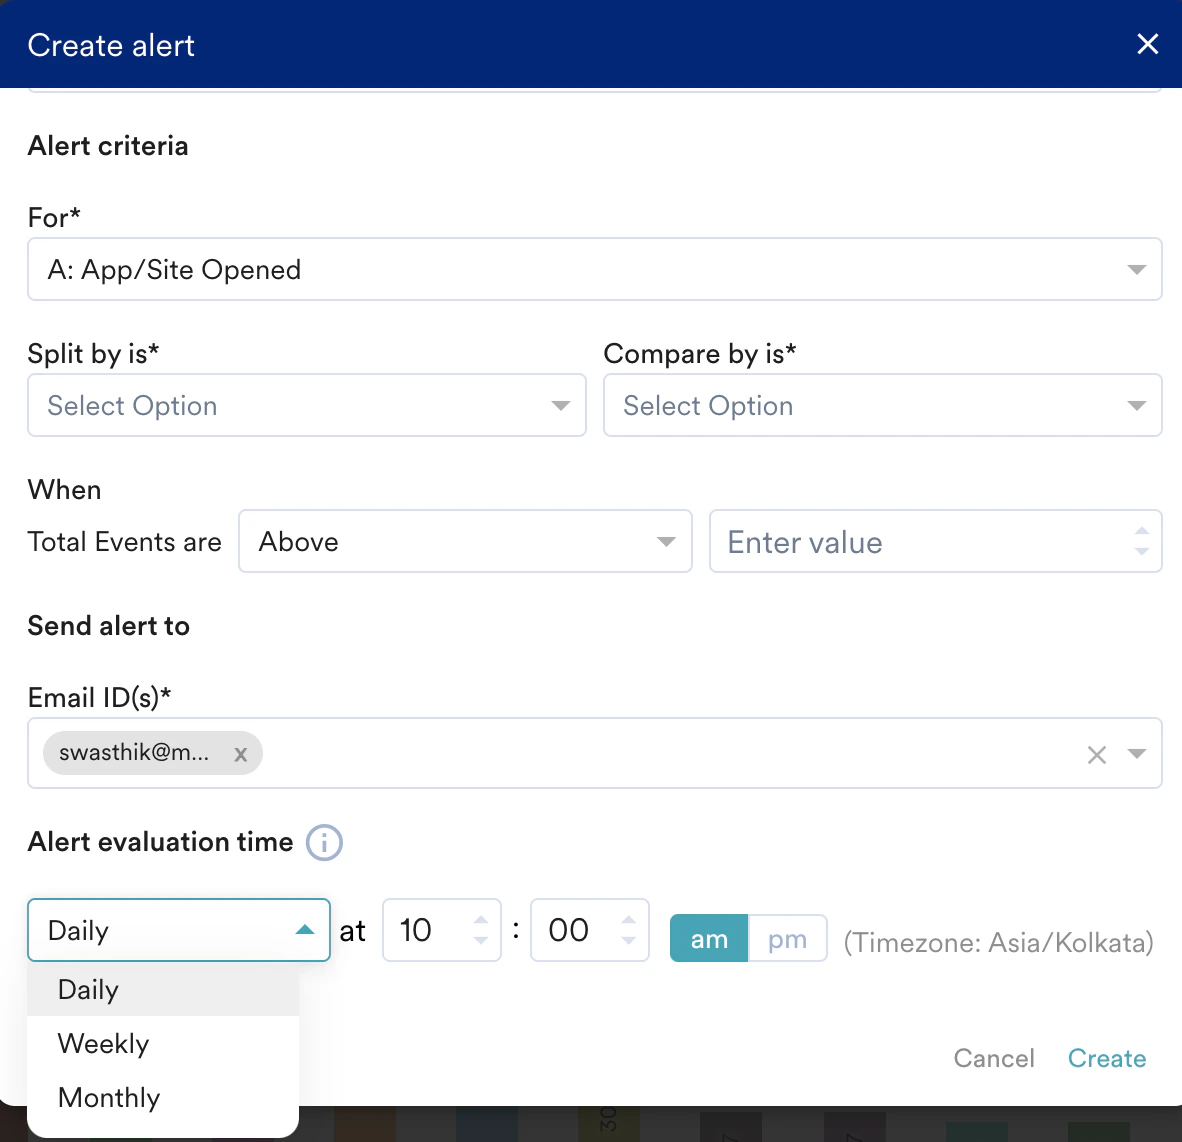 |
| Weekly | You receive the alert every Monday at a set time. 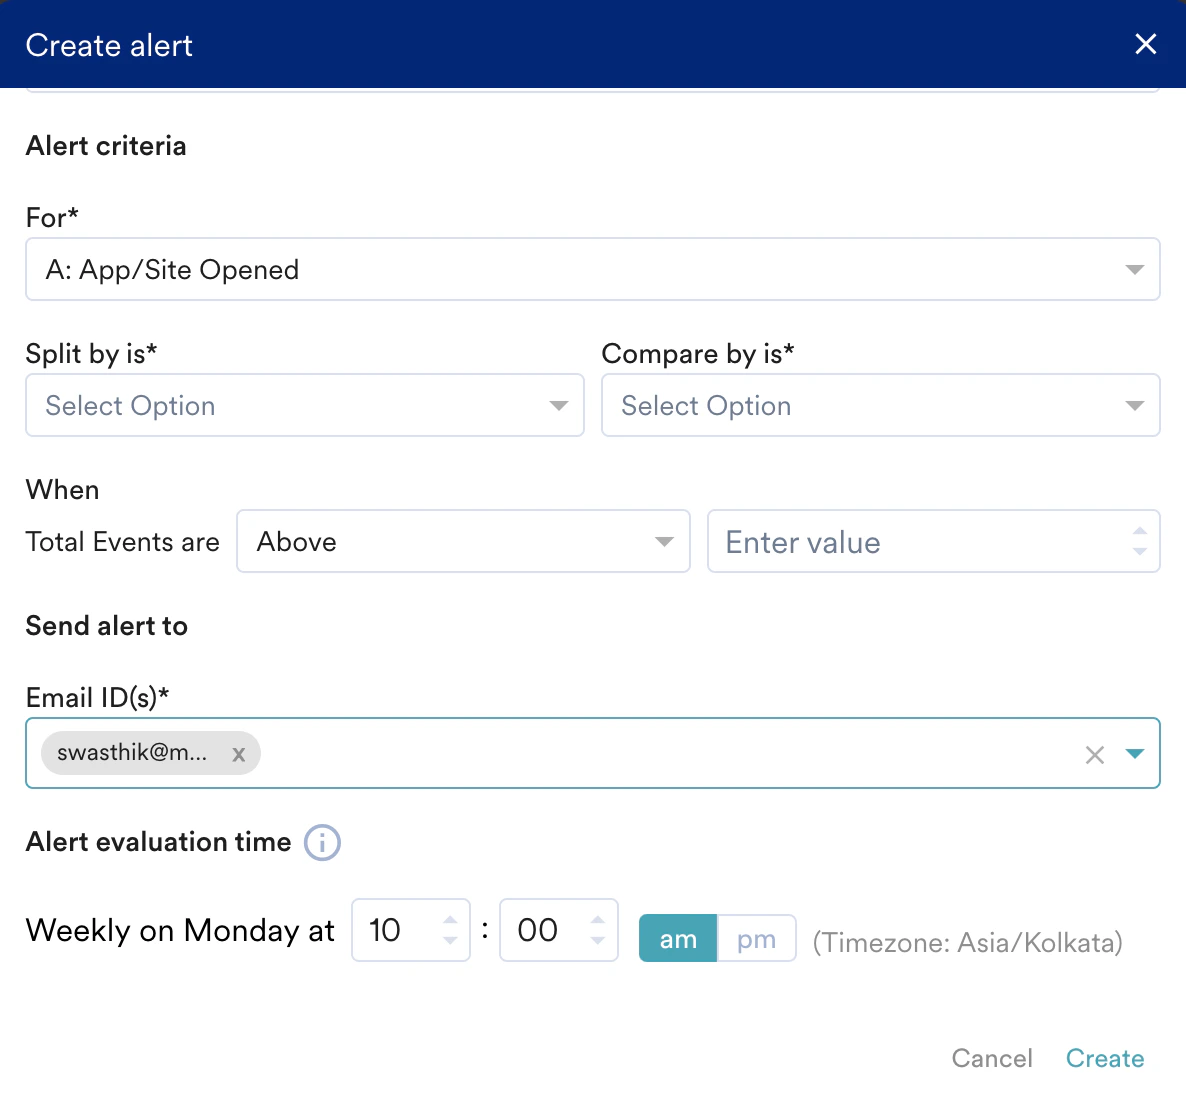 | You receive the alert on the day and time you select. 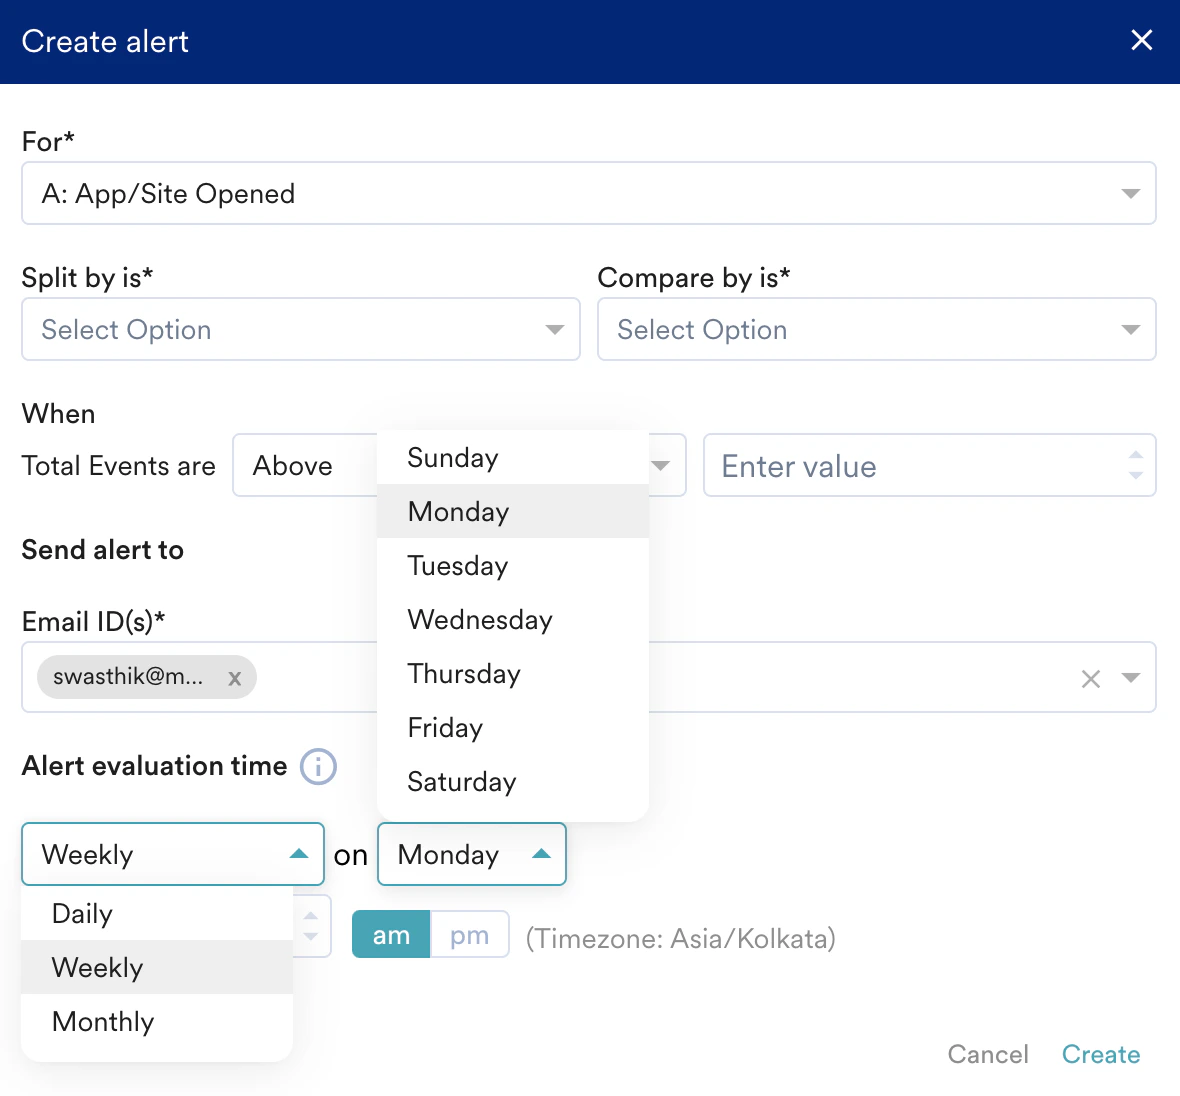 |
| Monthly | You receive the alert on the 1st of every month at a set time. 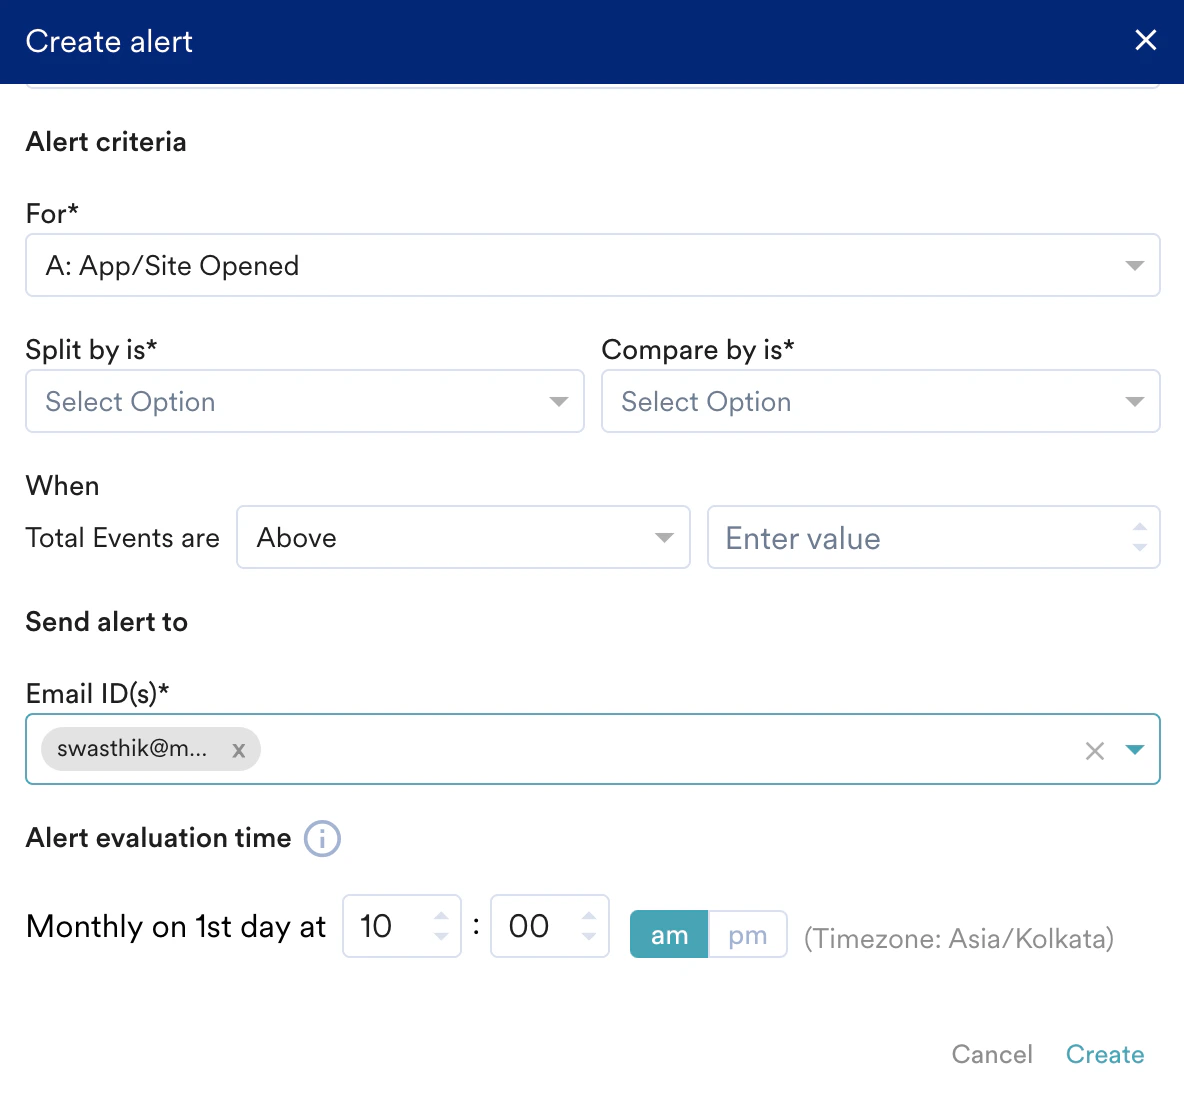 | You receive the alert on the date and time you select. 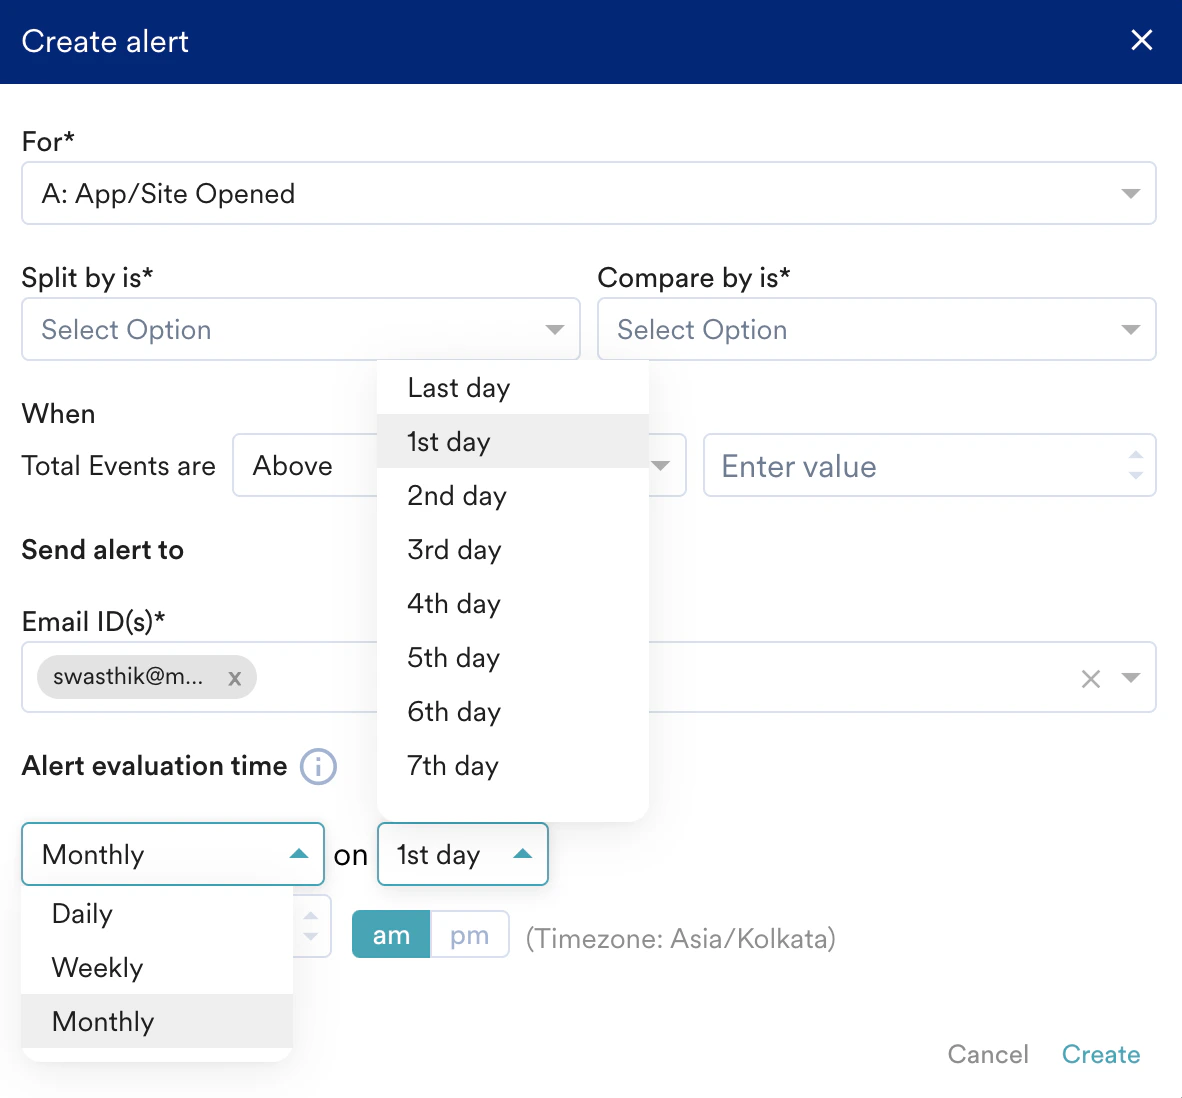 |
Limitations
- A workspace can have a maximum of 10 alerts. To increase this limit, reach out to your CSM or account manager.
- Alerts are delivered by email only.