

Early AccessAI Campaign Decisioning is available only for Push. To enable it for your workspace, contact your MoEngage Customer Success Manager (CSM) or the Support team.
Overview
Policy analytics show how a Campaign Decisioning Policy performs across all campaigns that use that policy. Performance is measured as uplift, which is the difference between the policy treatment group and the policy control group.- The policy treatment group includes end users who receive the policy campaigns.
- The policy control group is a randomly selected group of users who receive randomized messages from the policy. This group is used as a baseline to measure AI incremental impact.
Access Policy Analytics
Perform the following steps to access policy analytics.- On the left navigation menu in the MoEngage dashboard, click Decisioning, and then click Campaign decisioning policy.
- From the list, click the policy that you want to analyze.
- Click the Analytics tab.
Policy Analytics
Filter Data
You can filter policy analytics by date range and attribution type, such as click-through attribution.Policy Summary
The Policy summary cards provide a high-level view of policy impact compared with the control group. These cards show reward event uplift, brand engagement uplift, message interactions uplift, custom metrics uplift, campaigns sent, and decisions made. Each uplift metric is shown as a percentage versus the policy control group.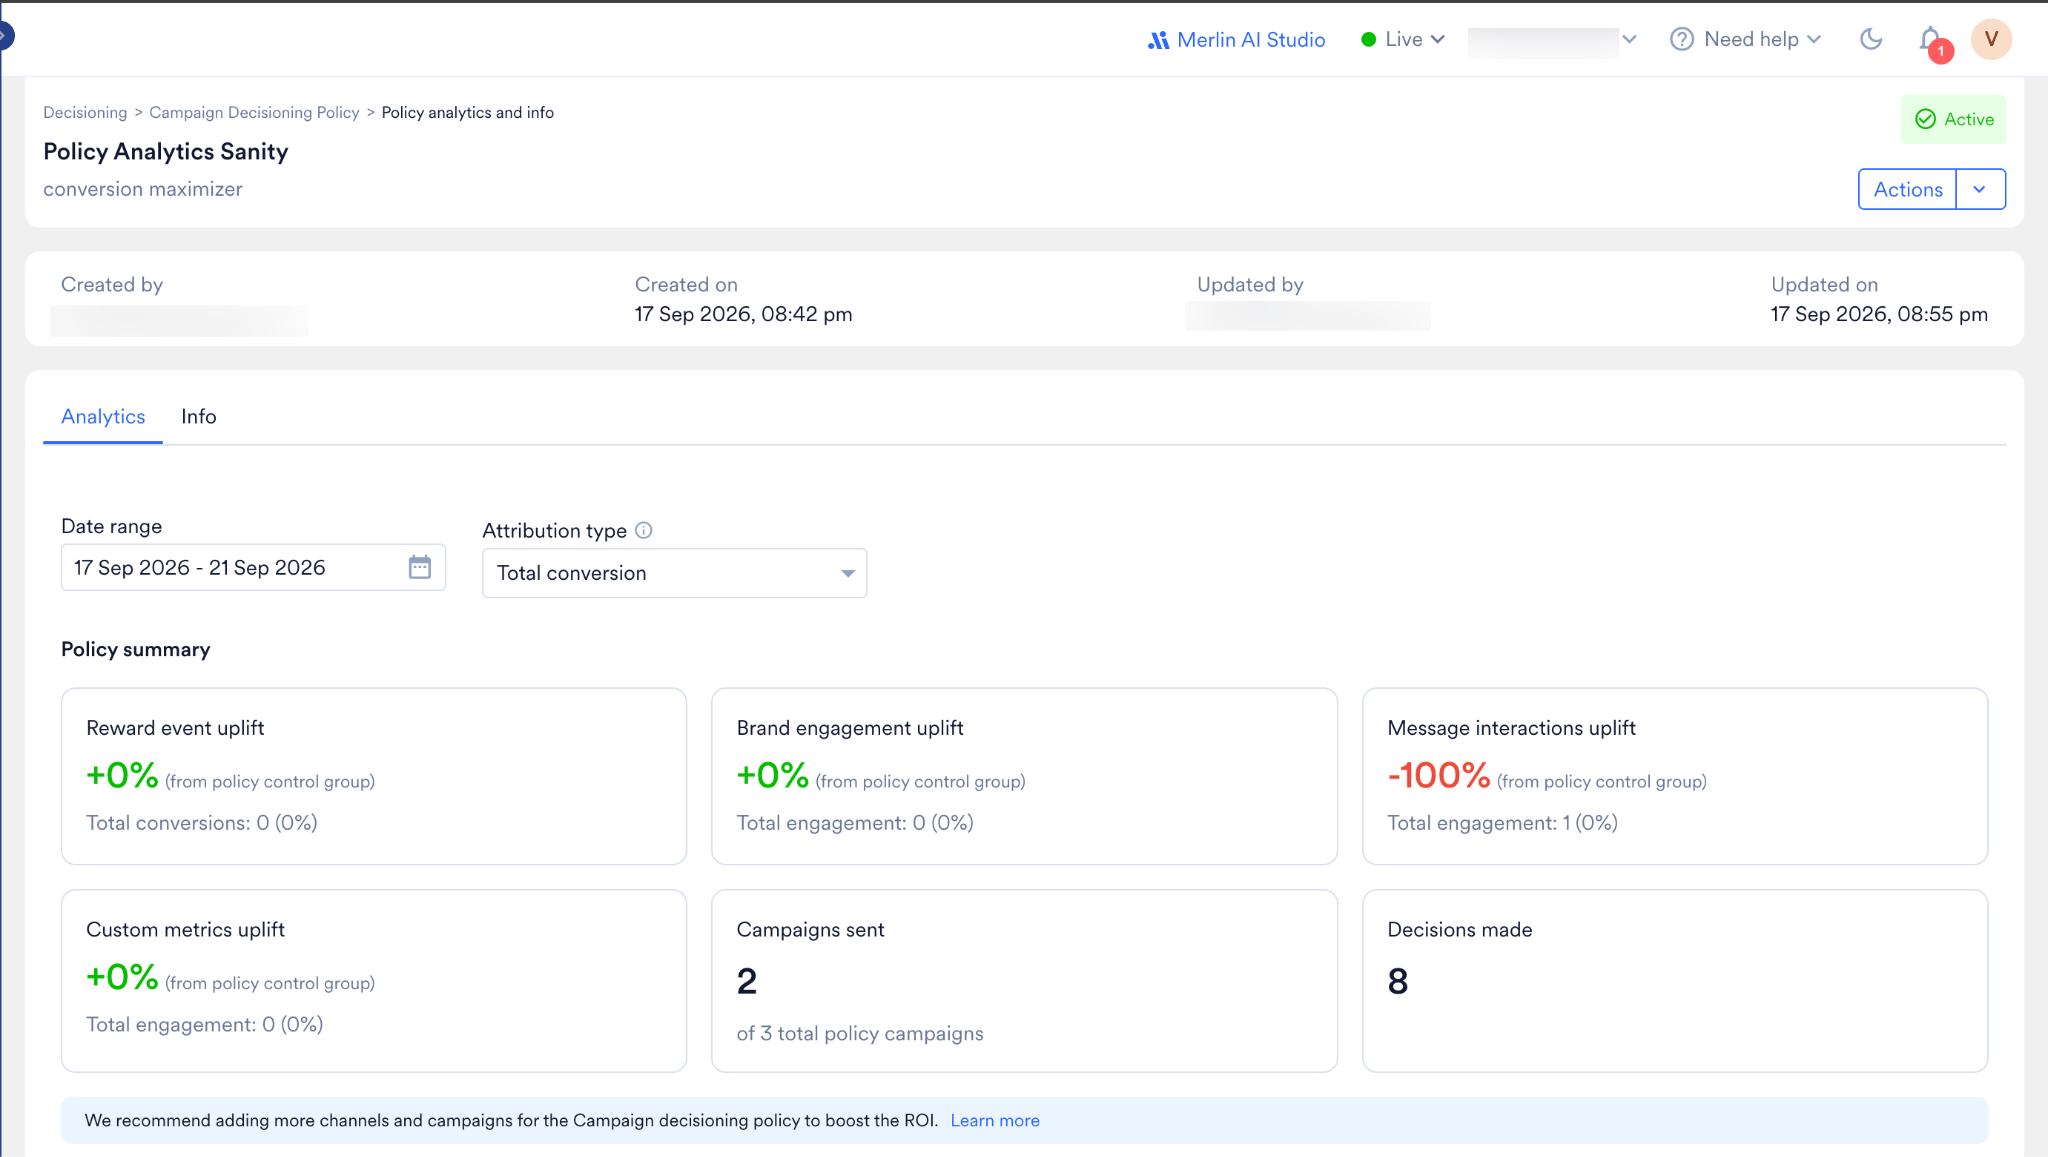
Policy Performance
The Performance summary table compares the policy treatment group with the policy control group. The table contains columns for Metric, Policy treatment group, Policy control group, and % Uplift. Metrics are grouped under Reward event, Brand engagement, Message interactions, and Custom metrics, and each group expands to show individual events.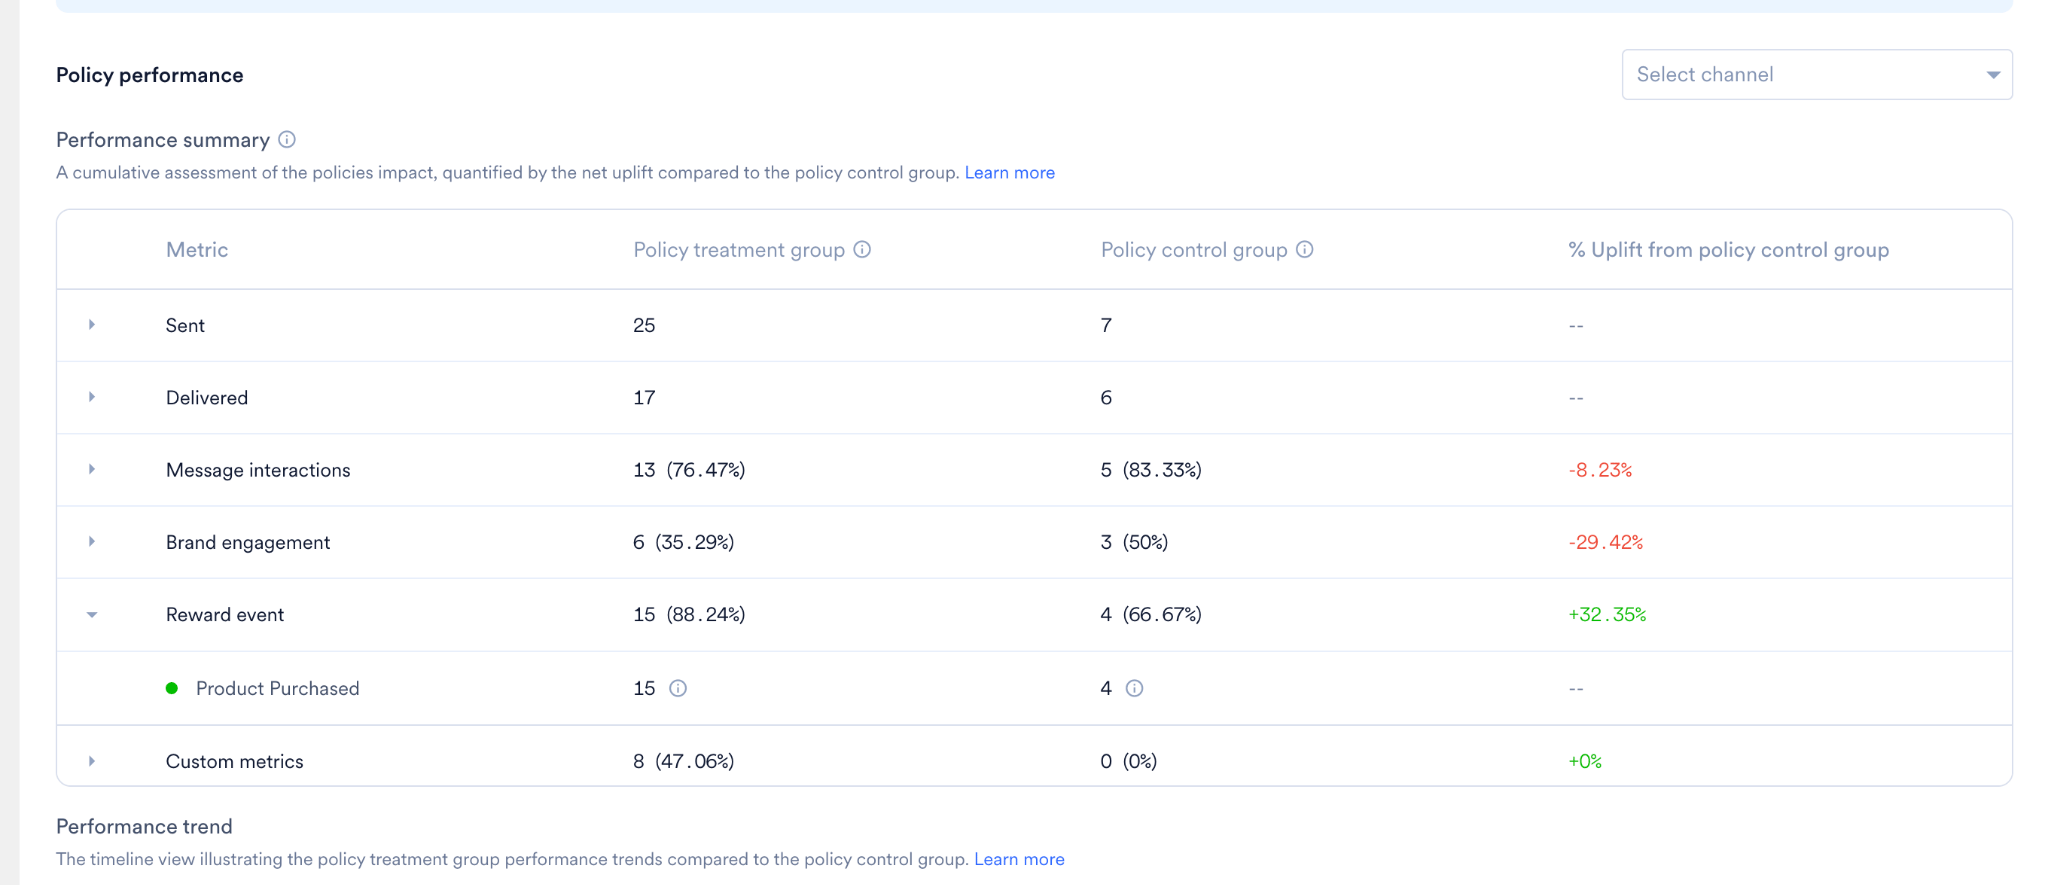
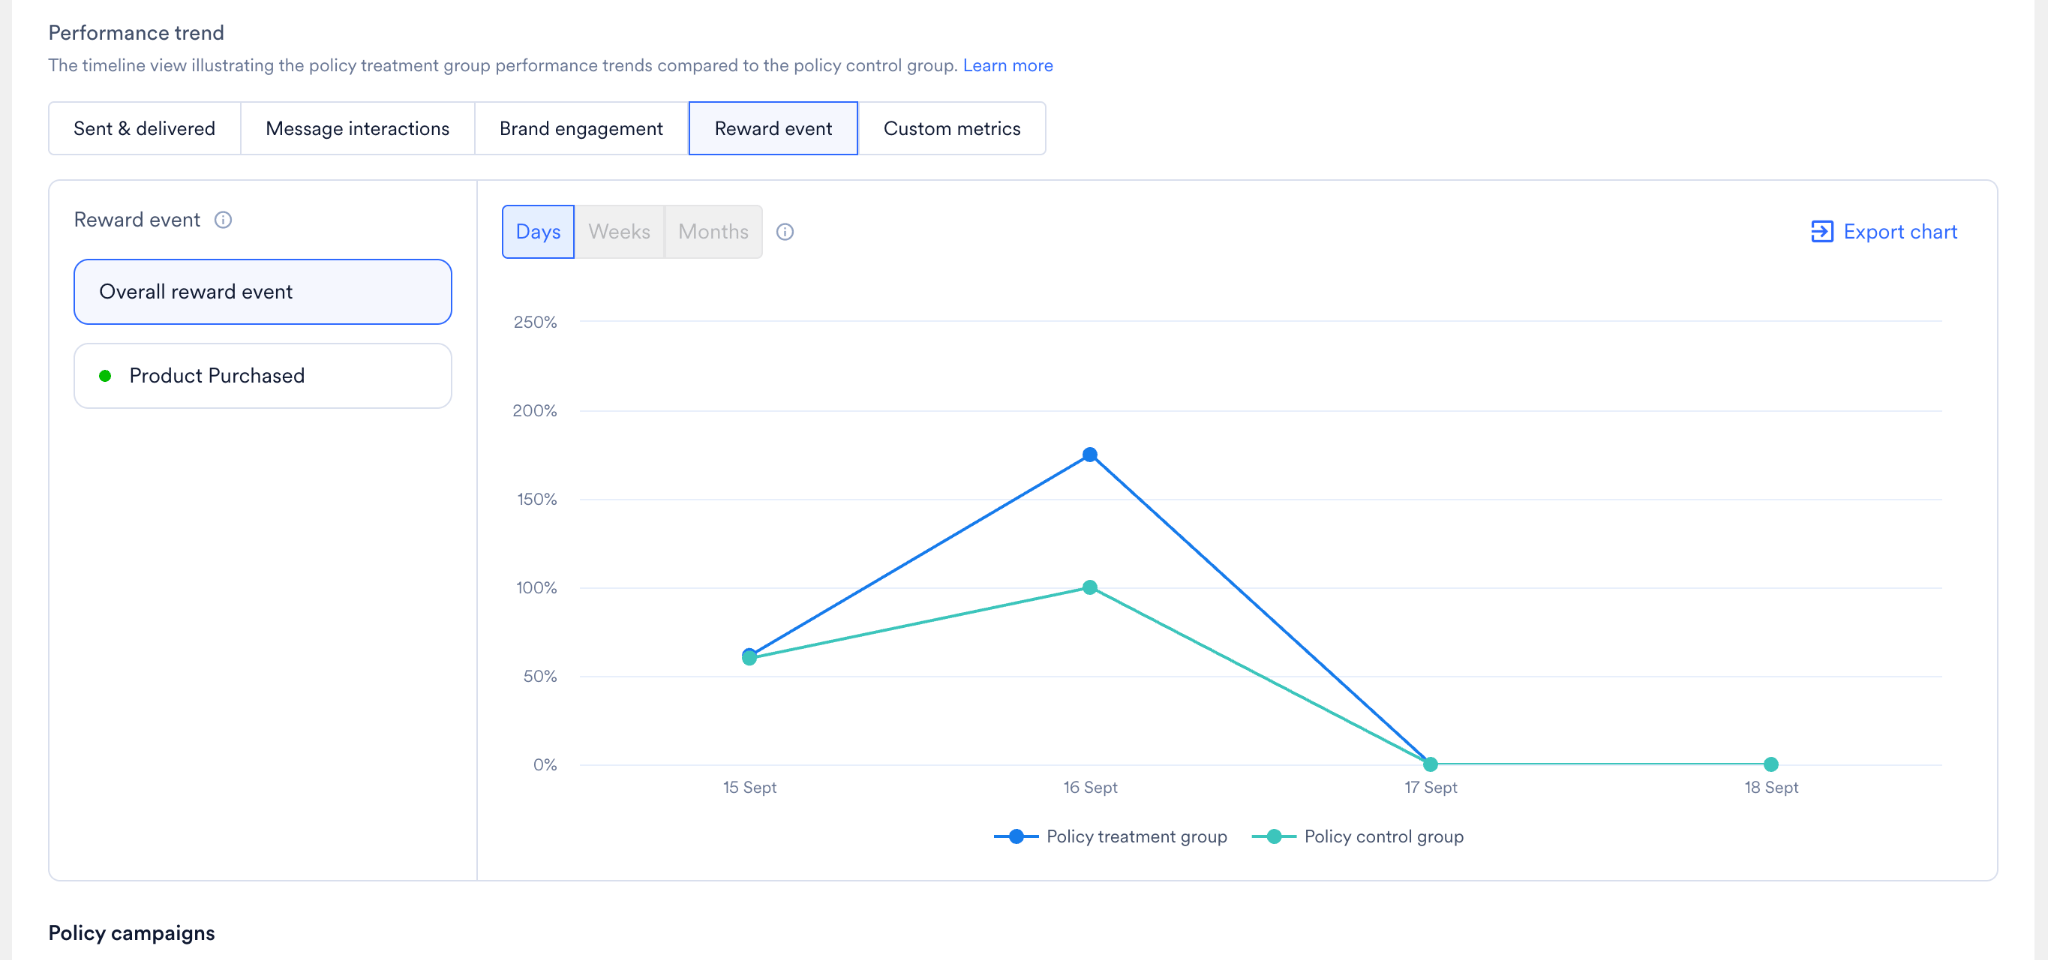
- Performance Trend: Shows how the treatment and control groups perform over time. You can filter by event category, view the data by Days, Weeks, or Months, and export the chart.
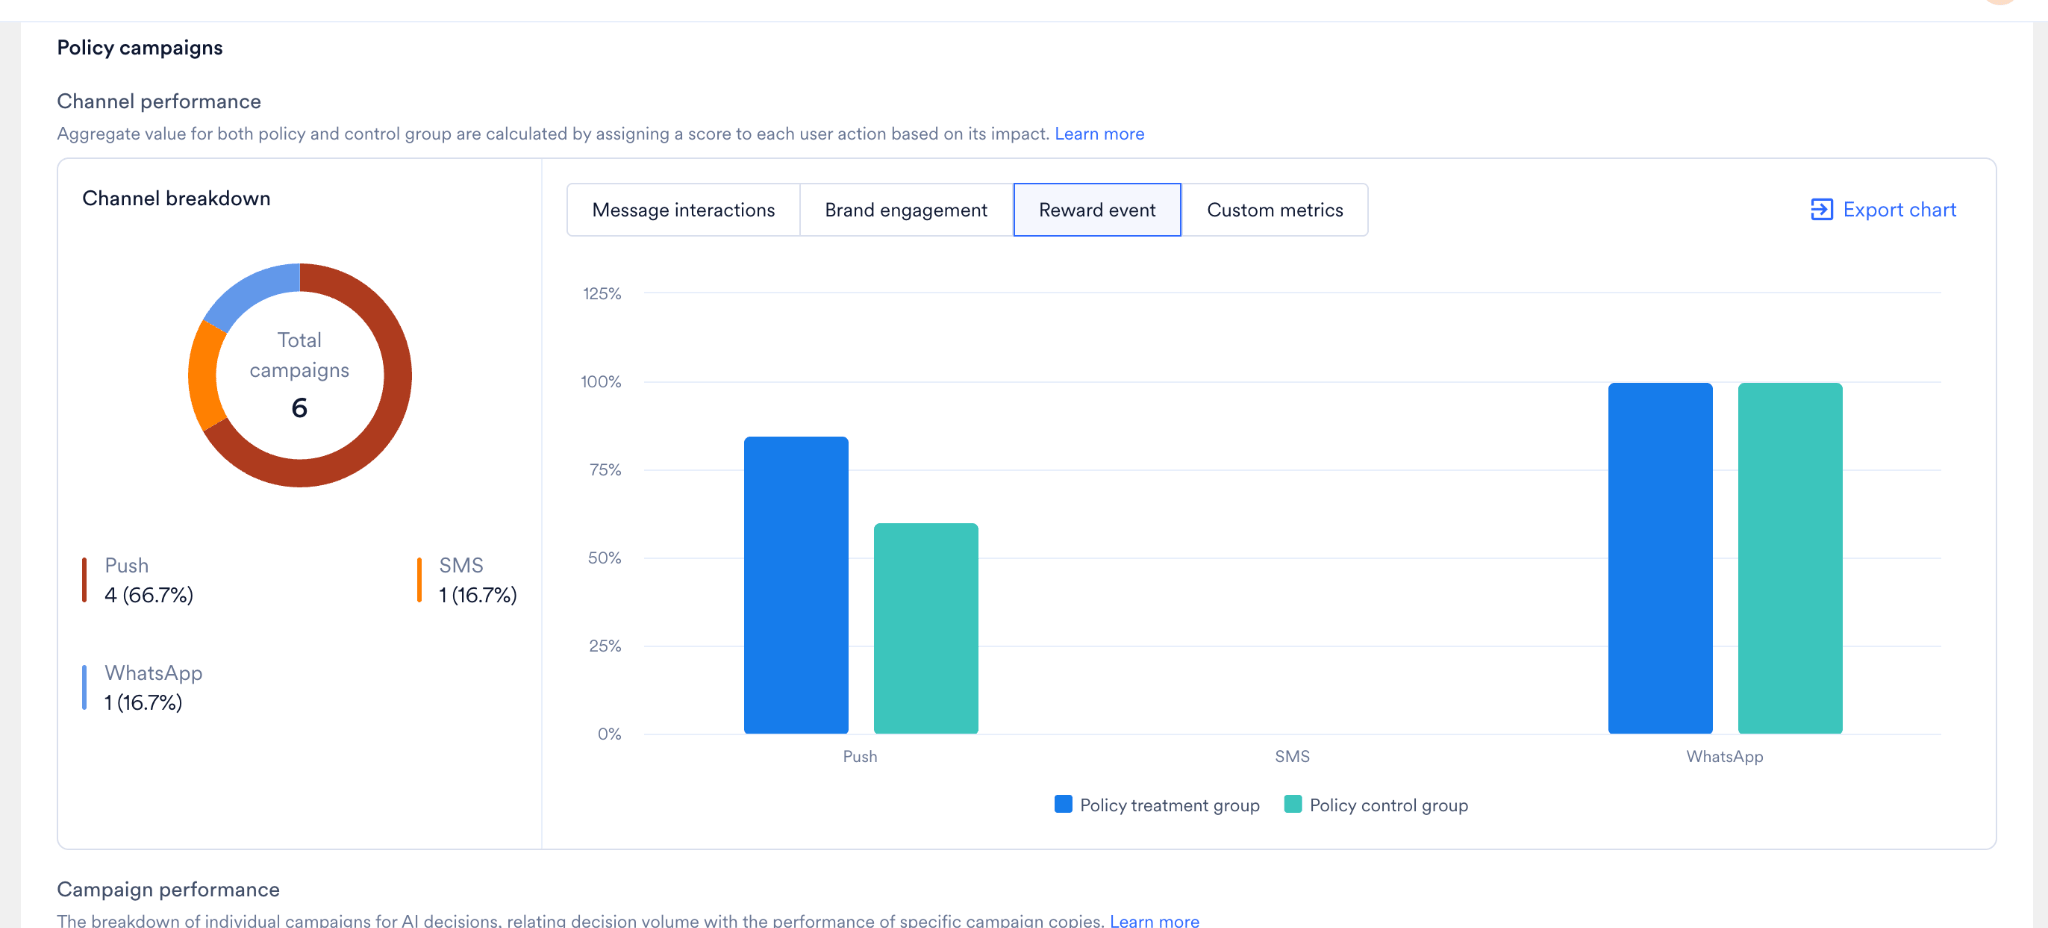
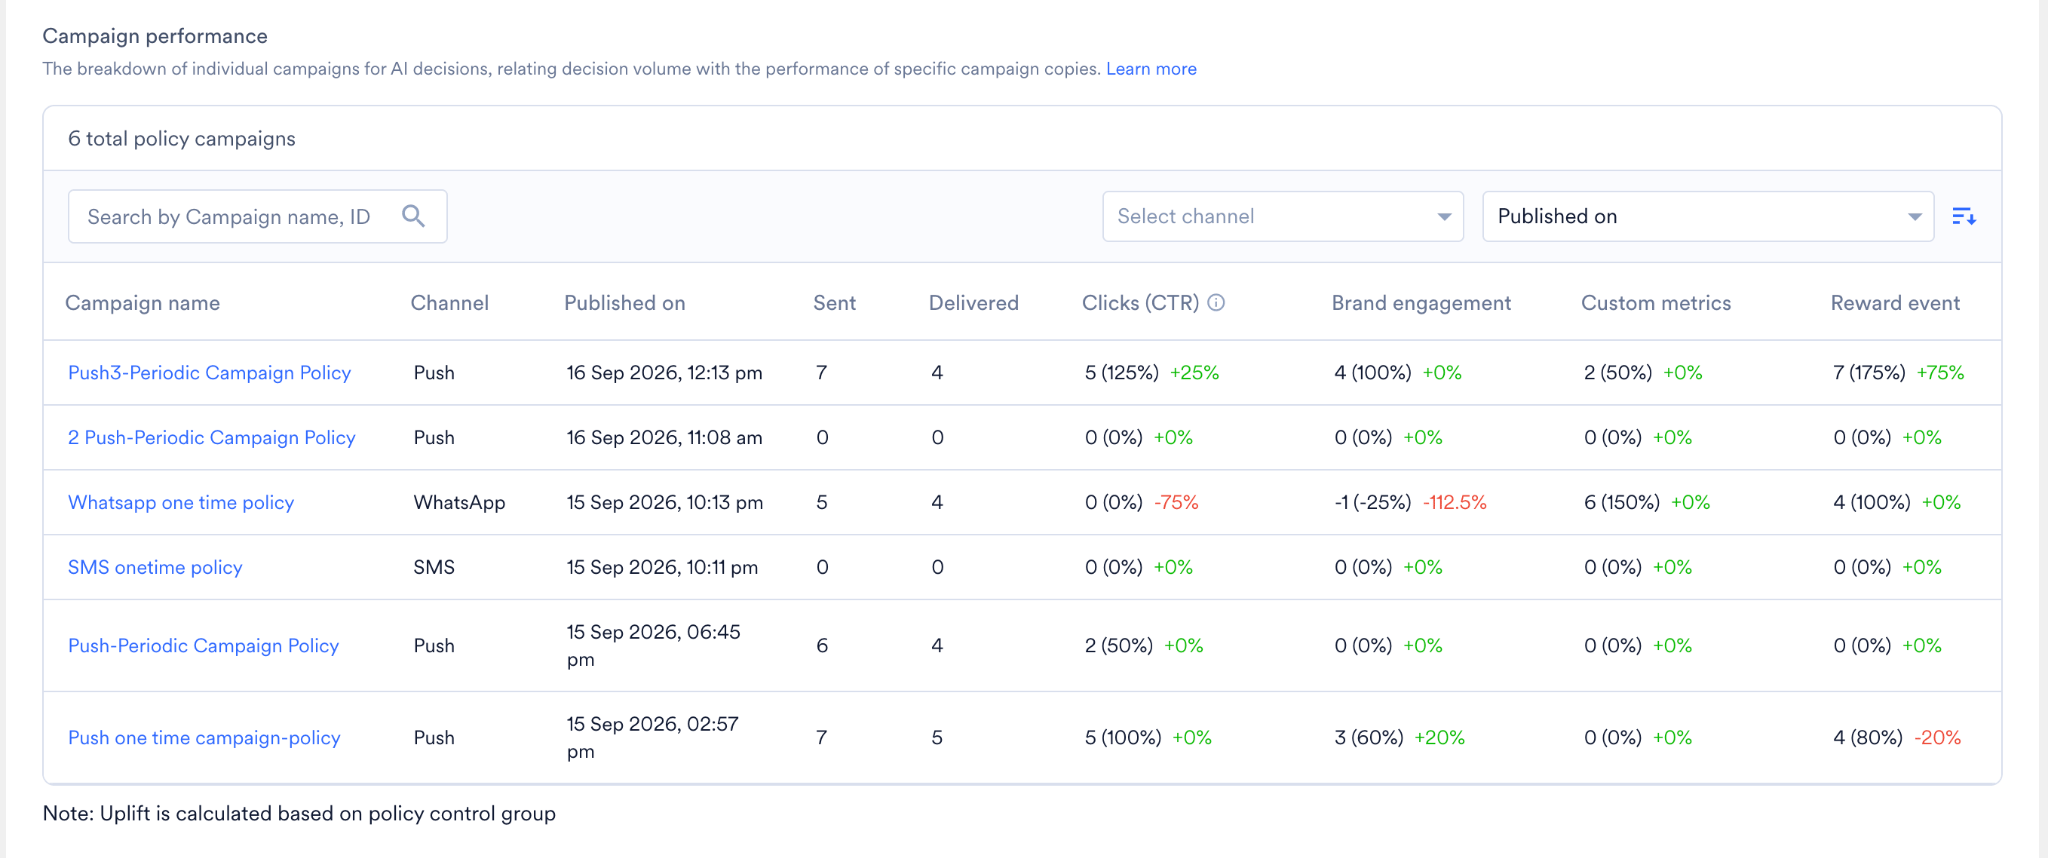
- Policy Campaigns: Shows campaign performance by channel, including a channel breakdown, a per-channel bar chart, and a searchable, filterable campaign performance table.
Policy Info
The Info tab shows the policy configuration, including target, send limits, time slots, control group, and performance metrics.Policy Performance Within a Campaign
Campaigns sent using a Campaign Decisioning Policy show a Policy Performance section in the campaign analytics, along with the standard campaign statistics. This section shows:- The policy name
- A View Policy link
- A table comparing the policy treatment group and policy control group for the same metric categories.
The Policy Performance section is not available for Standard campaigns.