


Customer Engagement Benchmarks for 2026 and Beyond!Customer Engagement Benchmarks for 2026 and Beyond!Customer Engagement Benchmarks for 2026 and Beyond!Customer Engagement Benchmarks for 2026 and Beyond!Customer Engagement Benchmarks for 2026 and Beyond!Resilience Redefined: The 2026 Customer Engagement Benchmarks
The Latest Customer Engagement Channel Benchmarks by Region.
The Latest Customer Engagement Channel Benchmarks by Region.
The Latest Customer Engagement Channel Benchmarks by Region.
The Latest Customer Engagement Channel Benchmarks by Region.
The Latest Customer Engagement Channel Benchmarks by Region.
See Where You Stack Up

The Latest Customer Engagement Channel Benchmarks by Region.
The Latest Customer Engagement Channel Benchmarks by Region.
The Latest Customer Engagement Channel Benchmarks by Region.
The Latest Customer Engagement Channel Benchmarks by Region.
The Latest Customer Engagement Channel Benchmarks by Region.
See Where You Stack Up
40
Billion Messages
651
B2C Marketers
3
Industries
3
Channels
5
Metrics
Key Takeaways
37.6x lift
in conversions of personalized vs generic messages
25x higher
unsubscribe rates of generic vs journey-based messages
> 44% CVR
of journey-based In-App messages
Set Course for Business Growth!
Drive massive growth with hyper-personalized, omnichannel engagement. You can double revenue, boost ROAS by 69%, and win back up to 10% of revenue by using a unified martech platform for precise segmentation and automated journeys; converting every customer interaction into a powerful engine for sustainable business growth.
Campaign Metrics
Where numbers tell the story, but relevance wins customers.
What's Covered?
-
 Open Rates
 -
Click-to-Open Rates
-
Click-Through Rates
-
Conversion Rates
-
Unsubscribe Rates
Actionable Insights
Where data is the fuel, but actionable insights are the engine for growth.
What's Covered?
-
Industry Analysis and Key Takeaways
-
Real-world Industry Use Cases
-
Success Stories from Top brands
Strategic Growth Levers
Where technology is the engine and customer experience the ultimate destination.
What's Covered?
-
Harnessing AI for Unparalleled Personalization
-
Elevating Engagement with Rich Experiences
-
Optimizing Email Deliverability and Performance
-
Embracing a Truly Omnichannel Strategy
-
Driving Re-engagement with Real-time Triggers
Trusted by 1350+ Consumer Brands Worldwide
Metrics Matter, But Insights More!
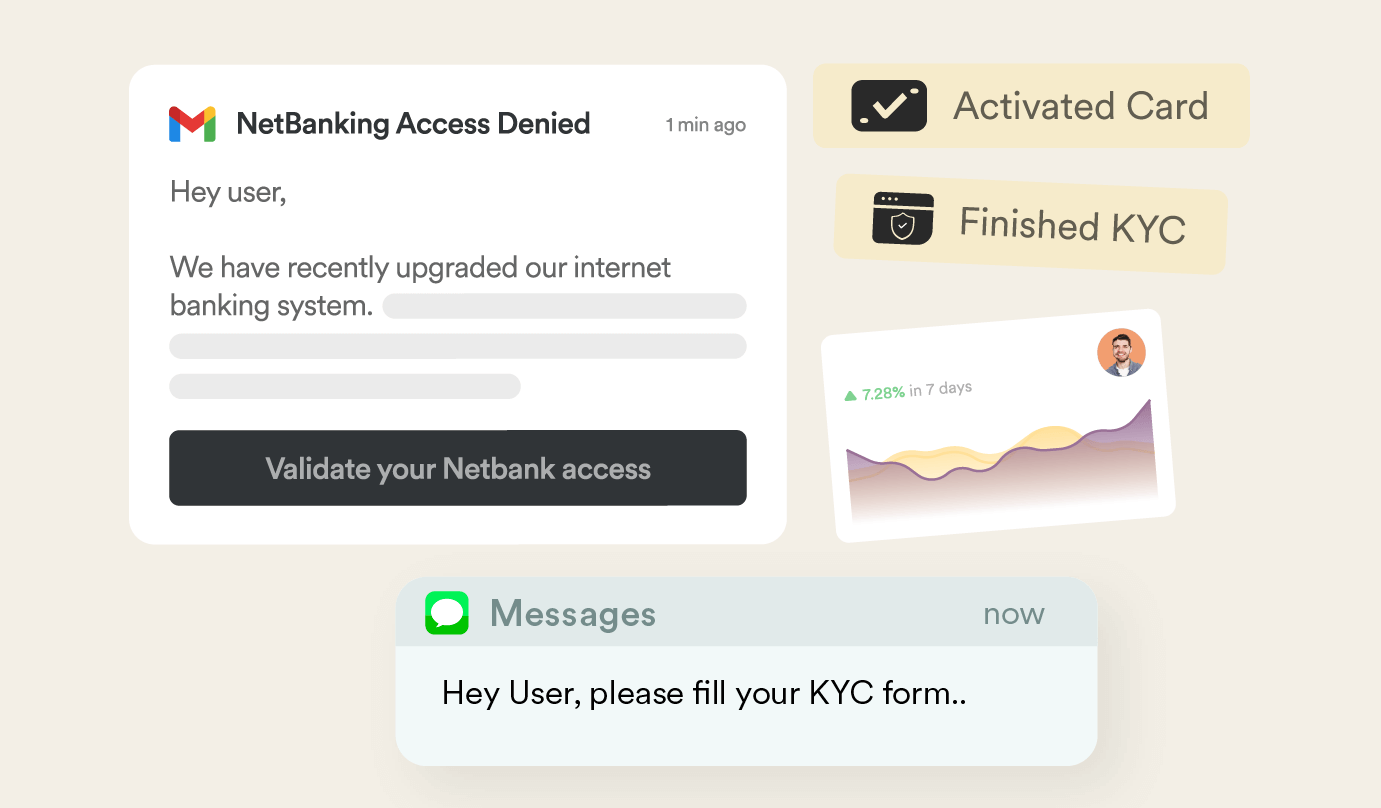
For financial brands, personalized campaigns drive powerful growth. Behavior-based emails deliver a 9.38x conversion lift, while journey-based push notifications provide up to a 4.61x lift in conversions compared to general broadcasts.
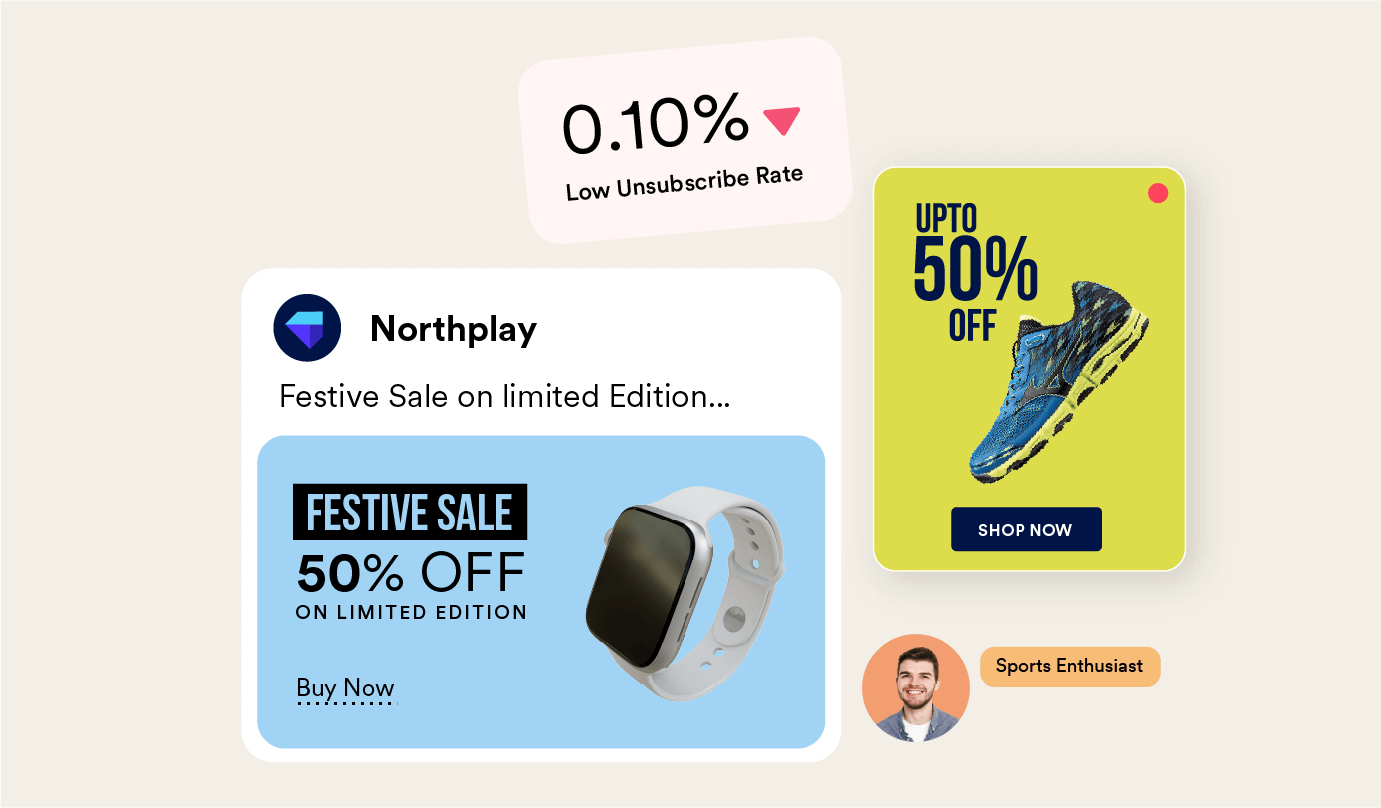
For retail brands, personalized engagement delivers significant growth, including a 1.11x uplift in email conversions and a CTR boost of up to 8.65x on push notifications.
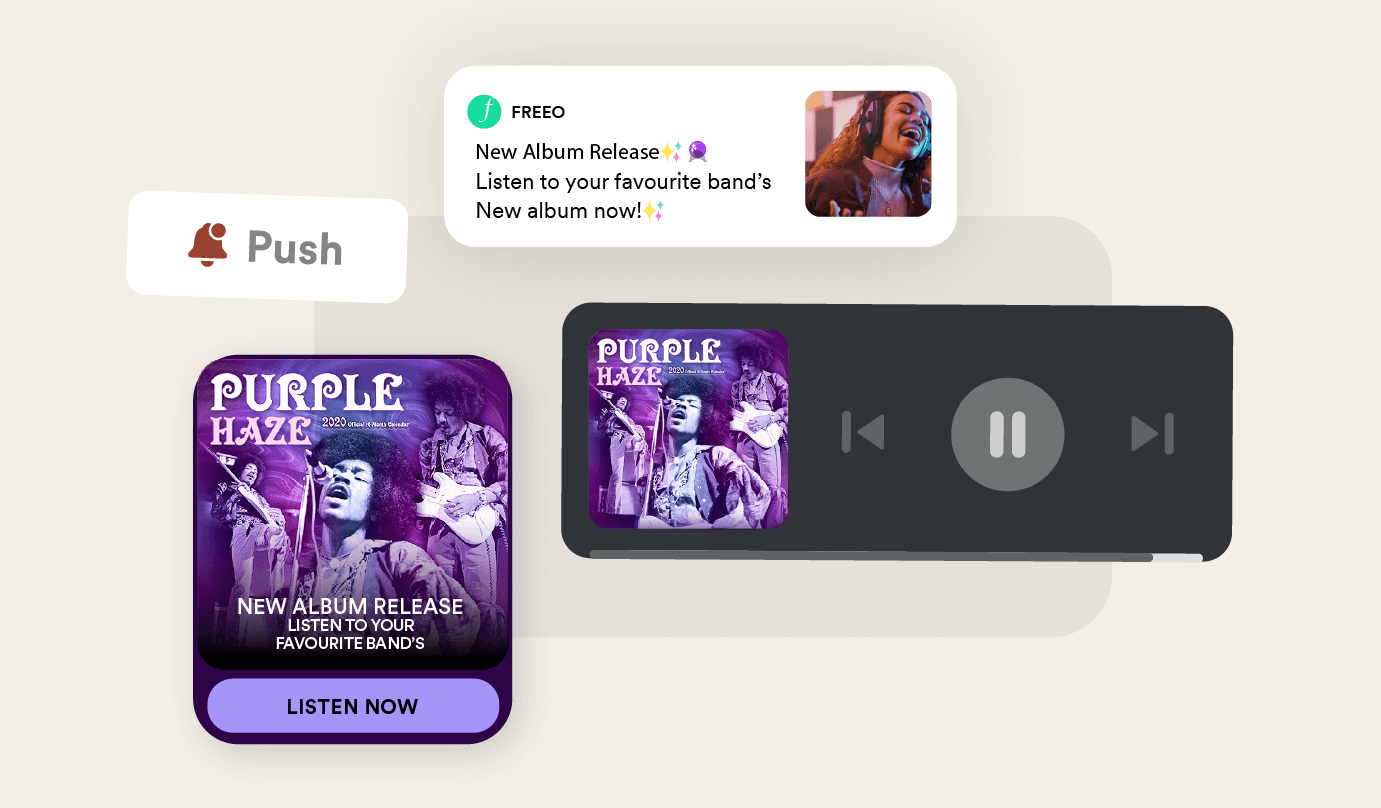
For media brands, personalized engagement drives powerful growth, delivering up to a 5.75x conversion lift on push notifications and 6.6x higher conversions on emails.
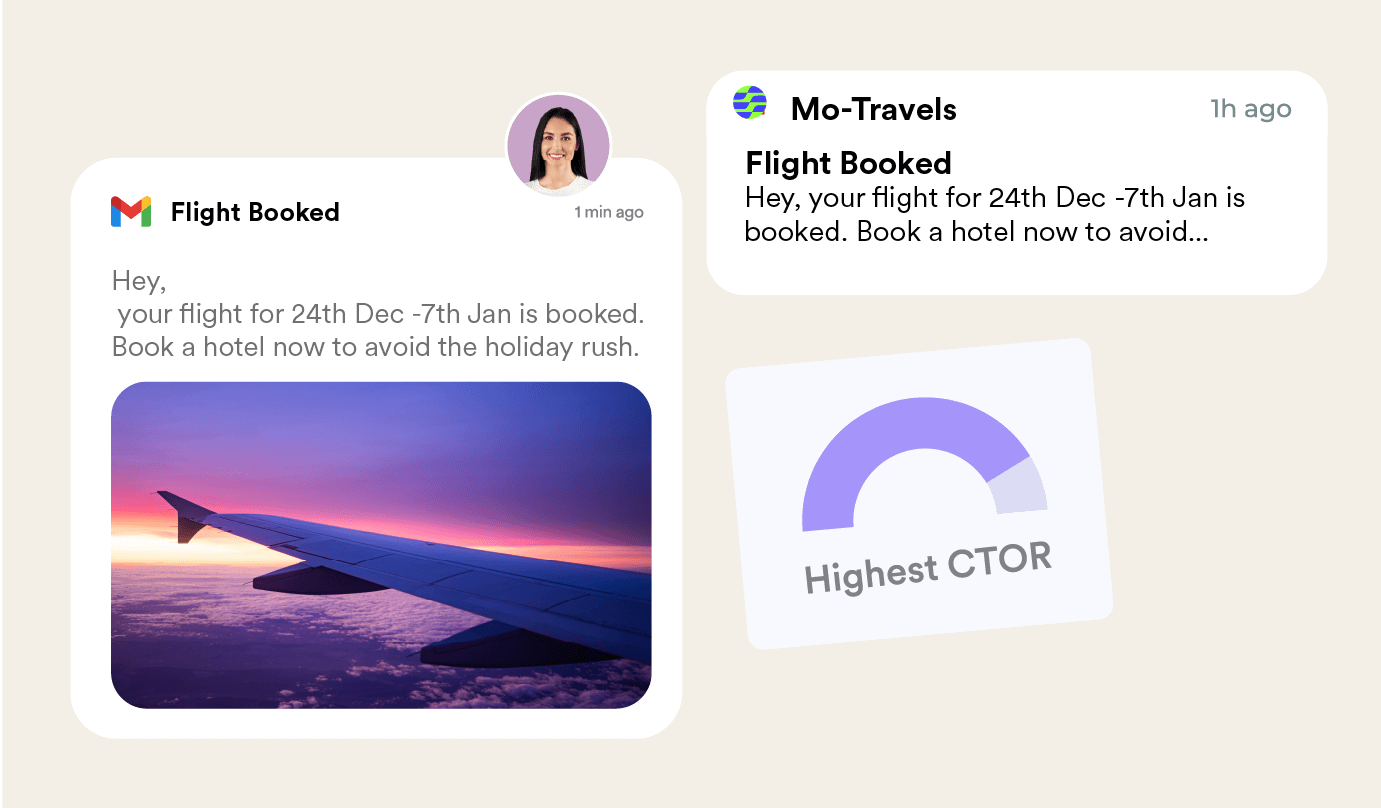
For travel brands, a personalized strategy is critical for converting interest into bookings. This strategy delivered a 2.35x increase in email conversions.
For financial brands, personalized campaigns drive powerful growth. Behavior-based emails deliver a 9.38x conversion lift, while journey-based push notifications provide up to a 4.61x lift in conversions compared to general broadcasts.
For retail brands, personalized engagement delivers significant growth, including a 1.11x uplift in email conversions and a CTR boost of up to 8.65x on push notifications.
For media brands, personalized engagement drives powerful growth, delivering up to a 5.75x conversion lift on push notifications and 6.6x higher conversions on emails.
For travel brands, a personalized strategy is critical for converting interest into bookings. This strategy delivered a 2.35x increase in email conversions.
Metrics Matter, But Insights More!
For retail brands, personalized engagement delivers exceptional growth, including a 3.71x uplift in email conversions, 1.86x higher CTR from on-site messages, a 3.33x CTR boost on push notifications, and a 3.69x improvement in in-app CTR.
For travel brands, a personalized strategy is critical for converting interest into bookings. This strategy delivered an 18.8x uplift in SMS conversions, an 8.46x increase in email conversions, and a conversion rate up to 9.7x higher on push notifications.
For media brands, personalized engagement drives powerful growth, delivering up to a 13.4x conversion lift on push notifications, 3.65x higher conversions on emails, a 1.87x uplift in in-app conversions, and a 1.98x improved CTR through on-site personalization.
For financial brands, personalization drives powerful growth, delivering up to a 7.09x lift in email conversions, a 6.14x improved CTR through on-site personalization, a 6.07x conversion lift on push notifications, and a 2.61x uplift in in-app conversions.
Metrics Matter, But Insights More!
For financial brands, journey-based personalization drives powerful growth, delivering up to 9.38x conversion lift on push notifications, 3.28x higher conversions on emails, 3.32x improved CTR through on-site personalization, and a 1.2x uplift in in-app conversions.
For retail brands, personalized engagement delivers exceptional growth, including a staggering 37x uplift in email conversions, 5.36x higher CTR from on-site messages, 4.17x CTR boost on push notifications, and a 2x improvement in in-app CTR.
For media brands, personalized engagement drives powerful growth, delivering up to a 7.02x conversion lift on push notifications, 4.9x higher conversions on emails, 3.5x uplift in in-app conversions, and 1.5x improved CTR through on-site personalization.
For travel brands, a personalized strategy is critical for converting interest into bookings. This strategy delivered an 18.8x uplift in on-site conversions, an 11.49x increase in email conversions, and a 9x higher conversion rate on push notifications.
Metrics Matter, But Insights More!
For financial brands, journey-based personalization drives powerful growth, delivering a 1.3x conversion lift on push notifications, 3.33x higher conversions on emails, a 2.40x improvement in CTR through on-site personalization, and a 1.75x uplift in in-app conversions.
For retail brands, personalized engagement delivers exceptional growth, including a 2.8x uplift in email conversions, 2x higher CTR from on-site messages, 5.49x CTR boost on push notifications, and a 3.3x improvement in in-app CTR.
For media brands, personalized engagement drives powerful growth, delivering a 3.12x conversion lift on push notifications, 3.12x higher conversions on emails, a 2.57x uplift in in-app conversions, and a 1.16x improvement in CTR through on-site personalization.
For travel brands, a personalized strategy is critical for converting interest into bookings. This strategy delivered a 1.48x uplift in in-app conversions, a 2.35x increase in email conversions, and a 1.66x higher conversion rate on push notifications.
Metrics Matter, But Insights More!
For E-commerce and Retail, personalized engagement delivers exceptional growth, including a 3.95x uplift in email conversions, 3.42x higher CTR from on-site messages, 2.13x CTR boost on push notifications, and a 1.06x improvement in in-app CTR.
For financial brands, journey-based personalization drives powerful growth, delivering up to a 2.05x conversion lift on push notifications, 31.42x higher conversions on emails, 4.08x improved CTR through on-site personalization, and a 1.77x uplift in in-app conversions.
For media brands, personalized engagement drives powerful growth, delivering up to a 75.2x conversion lift on push notifications, 17.43x higher conversions on emails, a 6.93x uplift in in-app conversions, and a 1.98x improved CTR through on-site personalization.
For travel brands, a personalized strategy is critical for converting interest into bookings. This strategy delivered a 2.64x uplift in on-site conversions, a 25.25x increase in email conversions, and up to a 7.23x higher conversion rate on push notifications.
Metrics Matter, But Insights More!
While the Financial Services industry faces a hefty “deliverability tax” on generic messages, shifting to utility-driven, behavior-based messaging across push and in-app channels unlocks a 16.5x conversion lift and reclaims lost audience reach.
With broadcast email open rates collapsing by 60%, Retail and Ecommerce brands must pivot to behavioral triggers and In-App messaging to capture a massive 37x conversion multiplier and 47% In-App CVR.
QSRs are seeing industry-leading engagement numbers, but they also face the highest penalty for irrelevance, with generic messages triggering unsubscribe rates 25x higher than those for personalized journey-based messages.

Billion Messages Analyzed
Customer engagement statistics were produced by analyzing 40 billion messages sent to North American customers and surveying 651 B2C Marketers.

BILLION MESSAGES ANALYZED
Customer Engagement statistics were analyzed from over 673 billion messages globally to bring you insights at scale.
BILLION MESSAGES ANALYZED
Customer Engagement statistics were analyzed from over 673 billion messages globally to bring you insights at scale.
BILLION MESSAGES ANALYZED
Customer Engagement statistics were analyzed from over 673 billion messages globally to bring you insights at scale.
BILLION MESSAGES ANALYZED
Customer Engagement statistics were analyzed from over 673 billion messages globally to bring you insights at scale.
BILLION MESSAGES ANALYZED
Customer Engagement statistics were analyzed from over 673 billion messages globally to bring you insights at scale.
BILLION MESSAGES ANALYZED
Customer Engagement statistics were analyzed from over 673 billion messages globally to bring you insights at scale.
Frequently Asked Questions
What are customer engagement benchmarks?
The most common metrics that enterprise brands measure are:
• Open Rate
• Click-to-Open Rate
• Click-Through Rate
• Conversion Rate
• Unsubscribe Rate
What is this report about?
This global report dives into the performance of campaigns across industries like Banking and Finance, Shopping (Retail and E-Commerce), Quick Service Restaurant (QSR), Media & Entertainment, and Travel & Hospitality, offering clear insights into what type of communication works best.
How to read this customer engagement benchmark report?
What industries have been covered?
What regions/countries have been covered?
• Southeast Asia
• India
• Middle East & Africa
• Sub-Saharan Africa
• North America
• Australia
• Latin America
• Europe
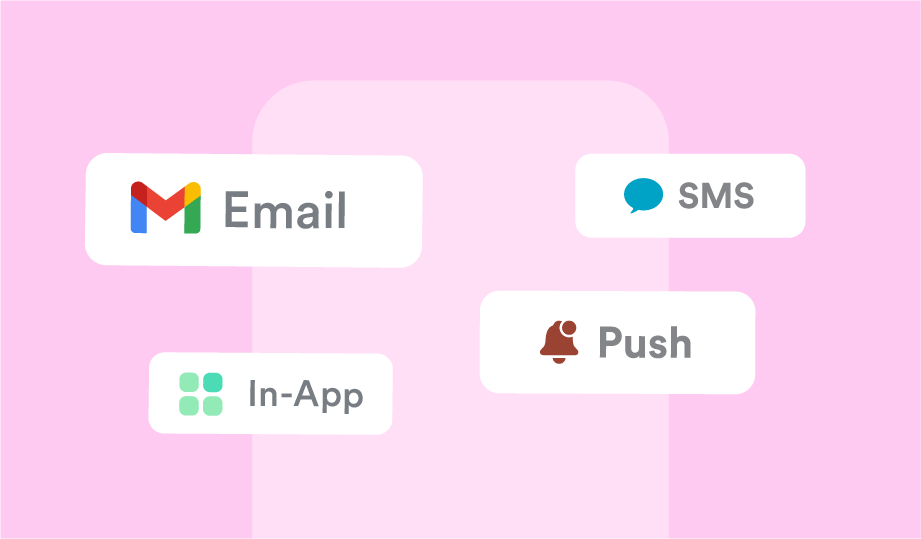
What are the types of communication in this report?
The aim is to show you the advanced functionalities (powered by AI), actionable strategies, real-world examples, and the need for a single/consolidated martech platform that can do everything from data unification (and management) to orchestrating powerfully personalized campaigns guaranteed to drive business growth!
Why is personalization important in the context of customer engagement?
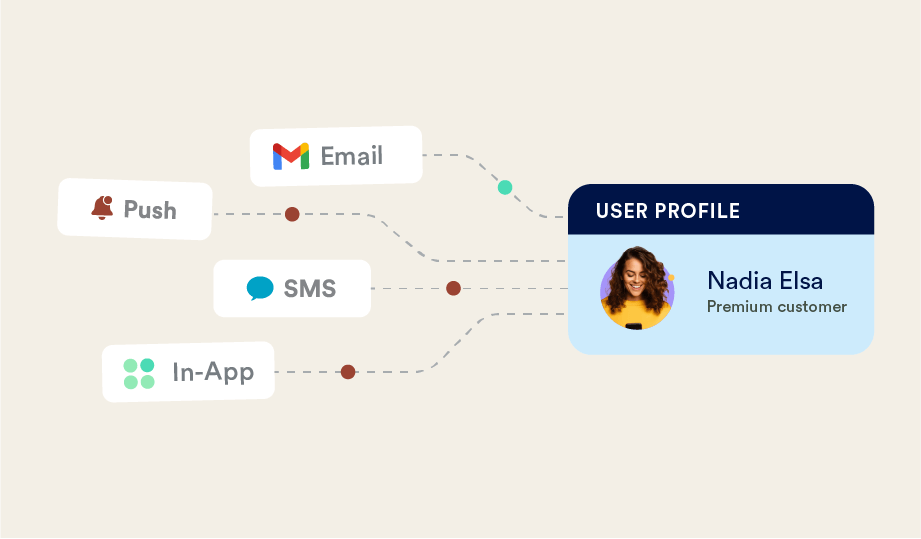
Here is how it impacts each channel:
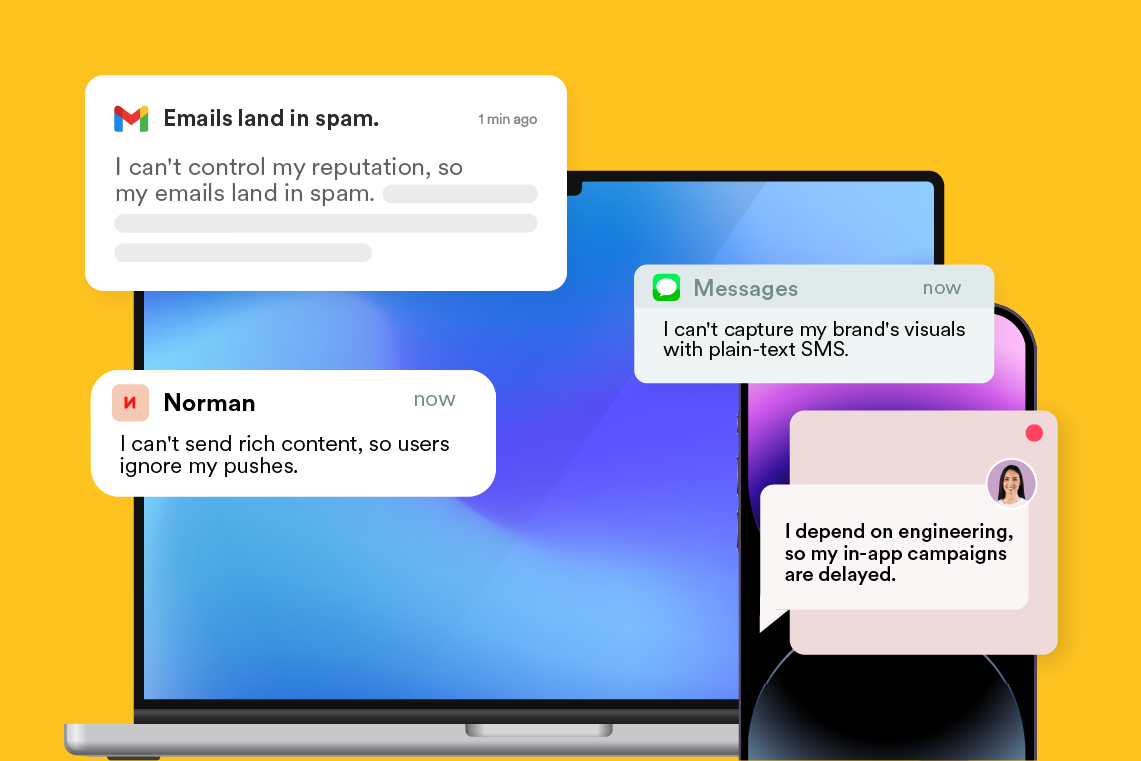
• Email: In a crowded inbox, personalization based on a user's purchase or Browse history ensures your message is seen as helpful, not just another promotion.
• Push Notifications: Since they are interruptive, personalization makes them valuable alerts (e.g., a price drop) instead of annoying spam that leads to being disabled.
• SMS: This is a highly personal channel. Personalization makes your message feel like a helpful service (e.g., a shipping update) rather than an intrusive advertisement.
• In-App Messages: Personalization creates a tailored experience within your app, guiding users with relevant tips and feature announcements that boost engagement.
• On-site Messaging: It adapts your digital storefront to the visitor in real-time with relevant offers and content, making them feel understood and reducing bounce rates.
What are the types of personalization when it comes to customer engagement communication?
The personalized email types are:
• Behavior-based Personalization: Triggered by specific customer actions or inactions (e.g., website visits, purchase history, app usage), these communication deliver highly relevant and timely messages.
• Journey-based Personalization: These messages are part of a predefined sequence or flow, designed to guide customers through a specific process, such as onboarding, cart recovery, or nurturing leads.
What are the key strategies for personalizing communication across channels?
• Target User Actions: Automate abandoned cart emails and price drop alerts. They drive 8x more opens and 6x more revenue than bulk campaigns.
• Adapt to the Journey Stage: Guide new users with in-app tours and reward VIPs with exclusive SMS offers, as 86% of people say this builds loyalty.
• Use Smart Segments: Group users by purchase history or location for hyper-relevant messaging, which can boost revenue by up to 760%.
• Leverage Real-Time Context: Adapt on-site messages to a user's device or location, since 72% of consumers now only engage with contextual offers.
• Predict with AI: Use AI for product recommendations and to predict customer churn. This model is responsible for 35% of all sales on popular e-commerce platforms.
How many customer engagement metrics have been covered?
• Open Rate (without and with personalization)
• Click-to-Open Rate (without and with personalization)
• Click-Through Rate (without and with personalization)
• Conversion Rate (without and with personalization)
• Unsubscribe Rate (without and with personalization)
Unlock Your Potential with MoEngage®
Discover how our solutions can drive your success. Connect with our experts today for personalized guidance.
Let’s Talk