

MoEngage Billing Workflow
Your monthly invoice has two parts:- Billable MTUs: driven by your Monthly Tracked Users, Events, and Fair Usage Policy (FUP). For more information, refer to Platform Pricing.
- Profile-based: a flat rate based on the number of user profiles in your account, simpler, and only applies if your contract specifies this model.
Add-ons are billed separately from platform pricing, and you’re only billed for the ones you use. For more information, refer to Add-Ons.
Platform Pricing
For more information, refer to Manage Subscription to see which model applies to your account.- Billable MTUs
- Profile-Based
If your contract is on the Billable MTU model, your platform fee is based on your Billable MTU:Billable MTU takes whichever is higher: your Total MTU, or your Events divided by your Fair Usage Policy (FUP) allowance. If you already know the formula and want to troubleshoot a specific change, refer to Diagnosing a bill increase.
Events
Every user action, tracked or auto-generated, feeds into MTU:- Custom user actions: events you send through your app, website, server-to-server integration, or other integrations (for example, “Added to Cart”). For more information, refer to A Complete Guide to Event Tracking.
- Standard events: predefined events generated by MoEngage to automatically track key user interactions, such as App Opens and Website Views, as well as campaign-related interactions. For more information, refer to Derived Events and Attributes.
Total MTU
MTU counts every unique user profile that performs at least one event in the calendar month, including anonymous profiles and background or system-triggered events, not only users who opened your app. A user active on more than one platform is counted only once.Total MTU is a distinct metric from MAU (Monthly Active Users). MAU is a separate dashboard metric that counts users who have at least one App/Site Opened event in the month, and it isn’t part of the billing formula. Total MTU is always equal to or higher than Total MAU, since MTU also counts anonymous profiles and background events.
Example: 10,000 mobile-only users + 4,000 web-only users + 1,000 users active on both (counted once, not twice) = 15,000 Total MTU.
FUP
Fair Usage Policy (FUP) is the average number of events allowed per user per month, set in your contract (typically 50–500 events per user). If your event volume pushes past this allowance, your billable MTU is recalculated upward, and you start paying based on event volume, not only on user count. To find your FUP, refer to Organization Details.Worked Example: Calculating Billable MTU
Say your account has a Total MTU of 80,000, your contract sets FUP at 100 events per user, and your contract’s event basis is Total Tracked Events. You record 12,000,000 Total Tracked Events this month.Events ÷ FUP (120,000) is higher than Total MTU (80,000), so you’re billed on 120,000, since event volume outpaced your FUP allowance.
Try It: Billable MTU Calculator
Enter your own numbers to see which side of the formula determines your bill.Bill Increase Diagnosis
Add-Ons
These are billed on top of platform pricing when the corresponding add-on is enabled on your plan. Add-on rates vary by contract.Messaging channels
Messaging channels
Messages sent to your users through campaigns and flows on the Email, SMS, and WhatsApp channels. You’re billed only for the channels enabled on your plan, based on the volume sent each month.
Inform
Inform
Inform is MoEngage’s transactional messaging infrastructure. You’re billed only for channels you use, based on the number of messages sent.
Additional channels
Additional channels
Available if RCS, Cards, or Landing Pages are enabled on your plan.
Data Exports & Imports
Data Exports & Imports
Automated data exports to your data warehouse, partner tool, or API destination, and data imports from your data warehouse. Billed based on the monthly volume if not already covered by your plan.
Open Analytics
Open Analytics
Available if you run queries through MoEngage’s open analytics or data warehouse querying capability.
Account-Level Metrics
The following metrics are calculated at an account level in the UTC timezone, unlike all other metrics, which are calculated at a workspace level in the workspace’s configured timezone:- Dedicated IPs for emails
- Emails Sent via MoEngage SendGrid
- SMS Sent via MoEngage Twilio
View Usage
To access the Usage page, on the left navigation menu in the MoEngage dashboard, click Settings > Account > Billing, then select the Usage tab.Access Permissions
The following table describes the permissions required to access and use the Usage page:Analyse Trend
The Usage Trends section lets you visualize data patterns for different metrics, organized under the Data, Engage, Inform, and Media Volumes categories.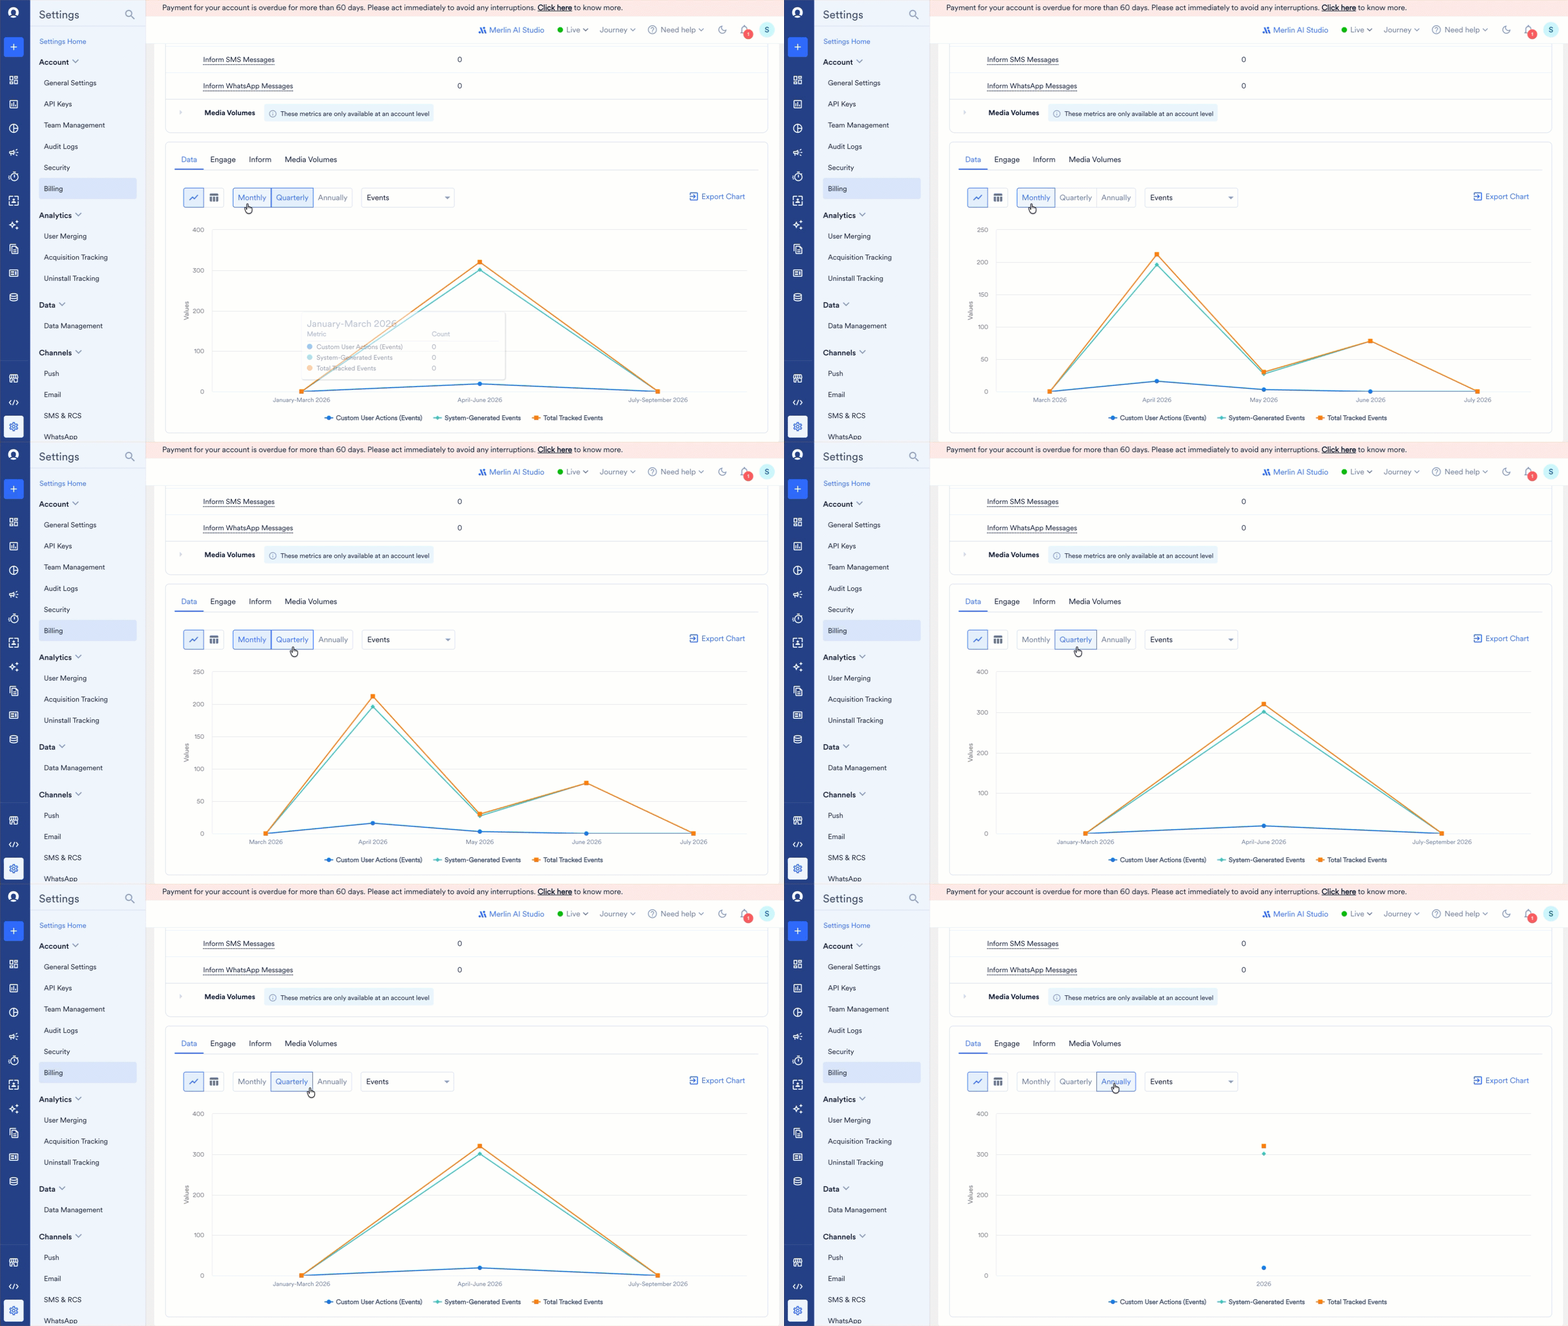
1
Filter your data
Select the data to analyze using the filters at the top of the page:
- Select workspaces/account: Use the filter drop-down to choose the scope of data to view.
- Workspaces: Choose one or more workspaces to include in the analysis. By default, your current workspace is selected. You only see workspaces mapped to the same billing account as your current workspace, and for which you have the necessary permissions (see Access Permissions above).
- Account: View all metrics aggregated as the sum across all workspaces in your account. This option requires the Manage account details permission.
- Select date range: Define the time period. Choose This month, Last month, or a Custom range (up to the last 12 months). The selected date range also applies to the chart and table view.
- By default, the page shows data for the current calendar month.
- Usage data is available from October 2025 onward.
- All metrics are tracked based on your workspace’s configured timezone, except those listed in Account-Level Metrics.
2
View and interpret the trends
Use the controls to customize your chart or table view: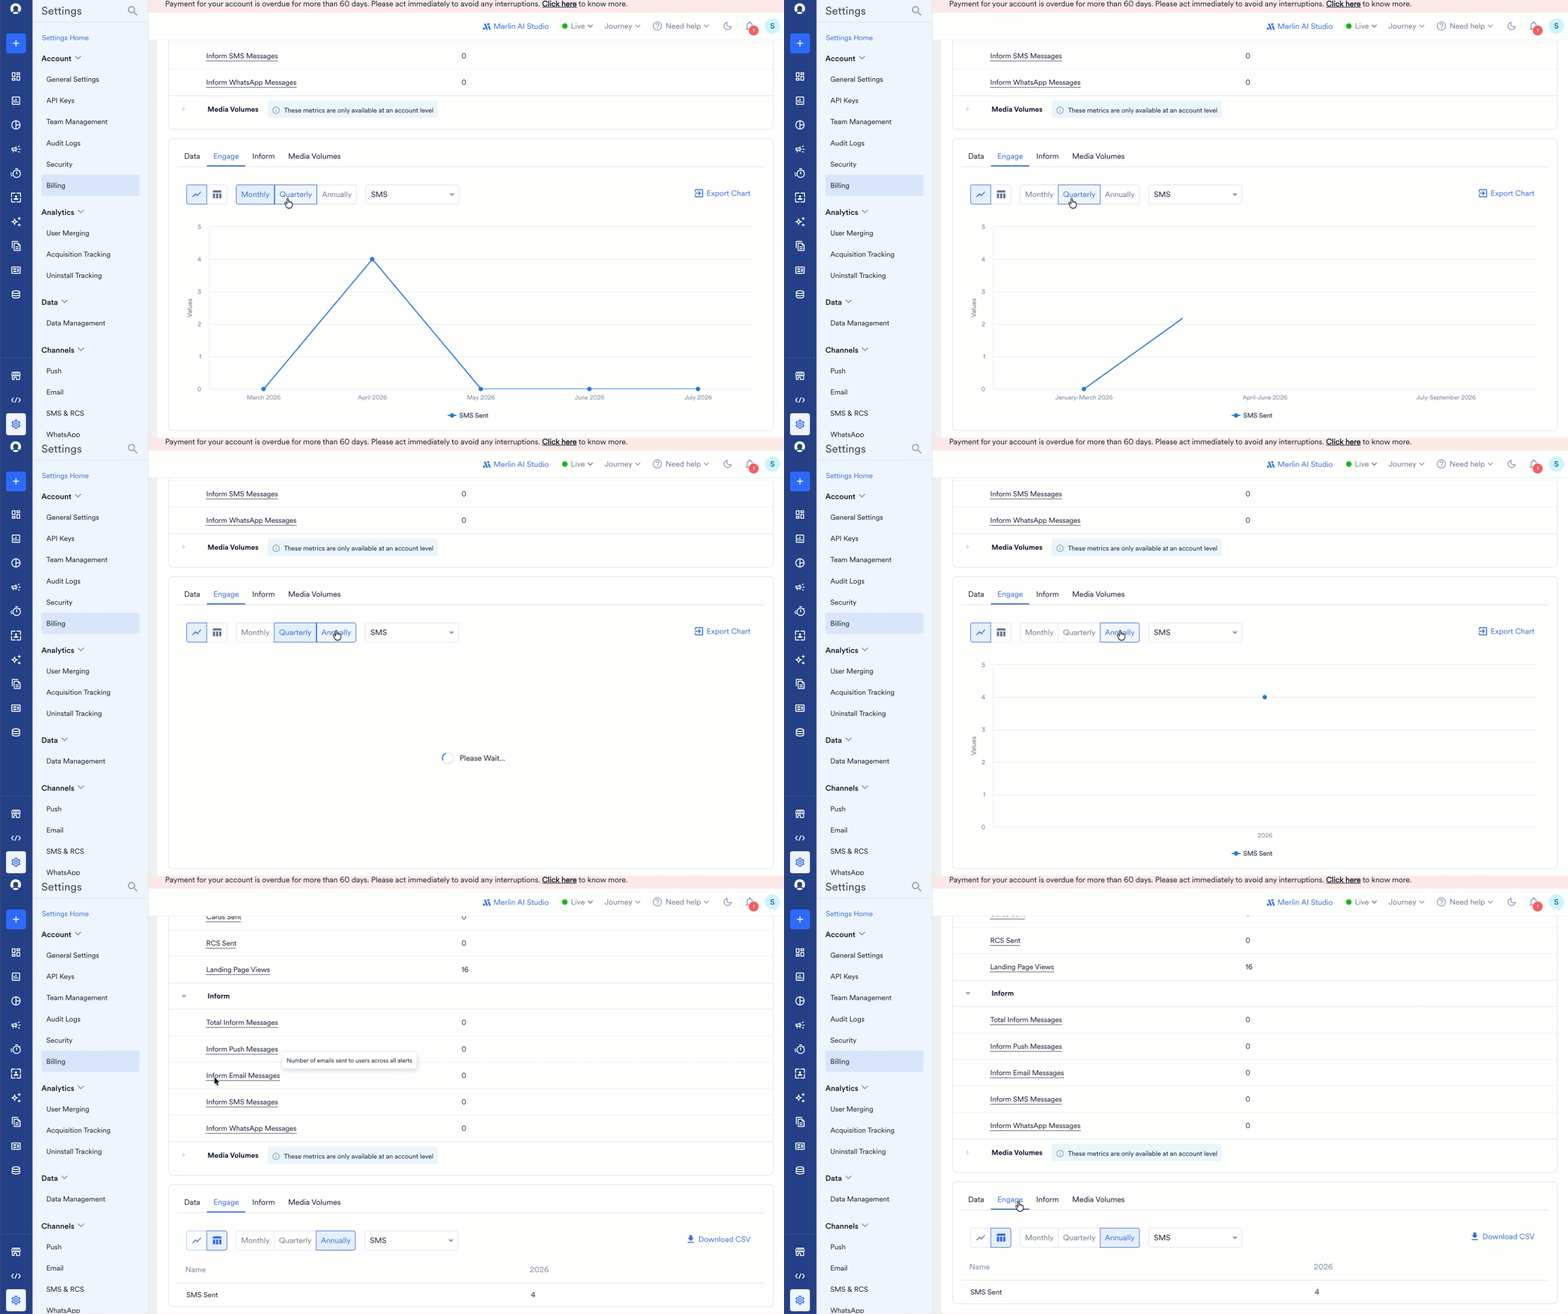
- Category: Select the tab for the metrics you want to view: Data, Engage, Inform, or Media Volumes.
- Metric selection: Select a metric from the drop-down list. The available metrics depend on the category you select, for example Events under Data, or SMS under Engage.
- Granularity: View data aggregated Monthly, Quarterly, or Annually.
- Chart and table view: Switch between a line chart for quick visual analysis and a table for exact numbers.
- On the Data tab, select the metric you want to view from the drop-down list. Events is selected by default.
- Set the granularity to Monthly, Quarterly, or Annually. Monthly is selected by default.
- Select the chart or table icons to switch between a visual graph and a detailed data table. Chart view is selected by default.
3
Export and download your data
You can export data for reporting and record-keeping in two ways:
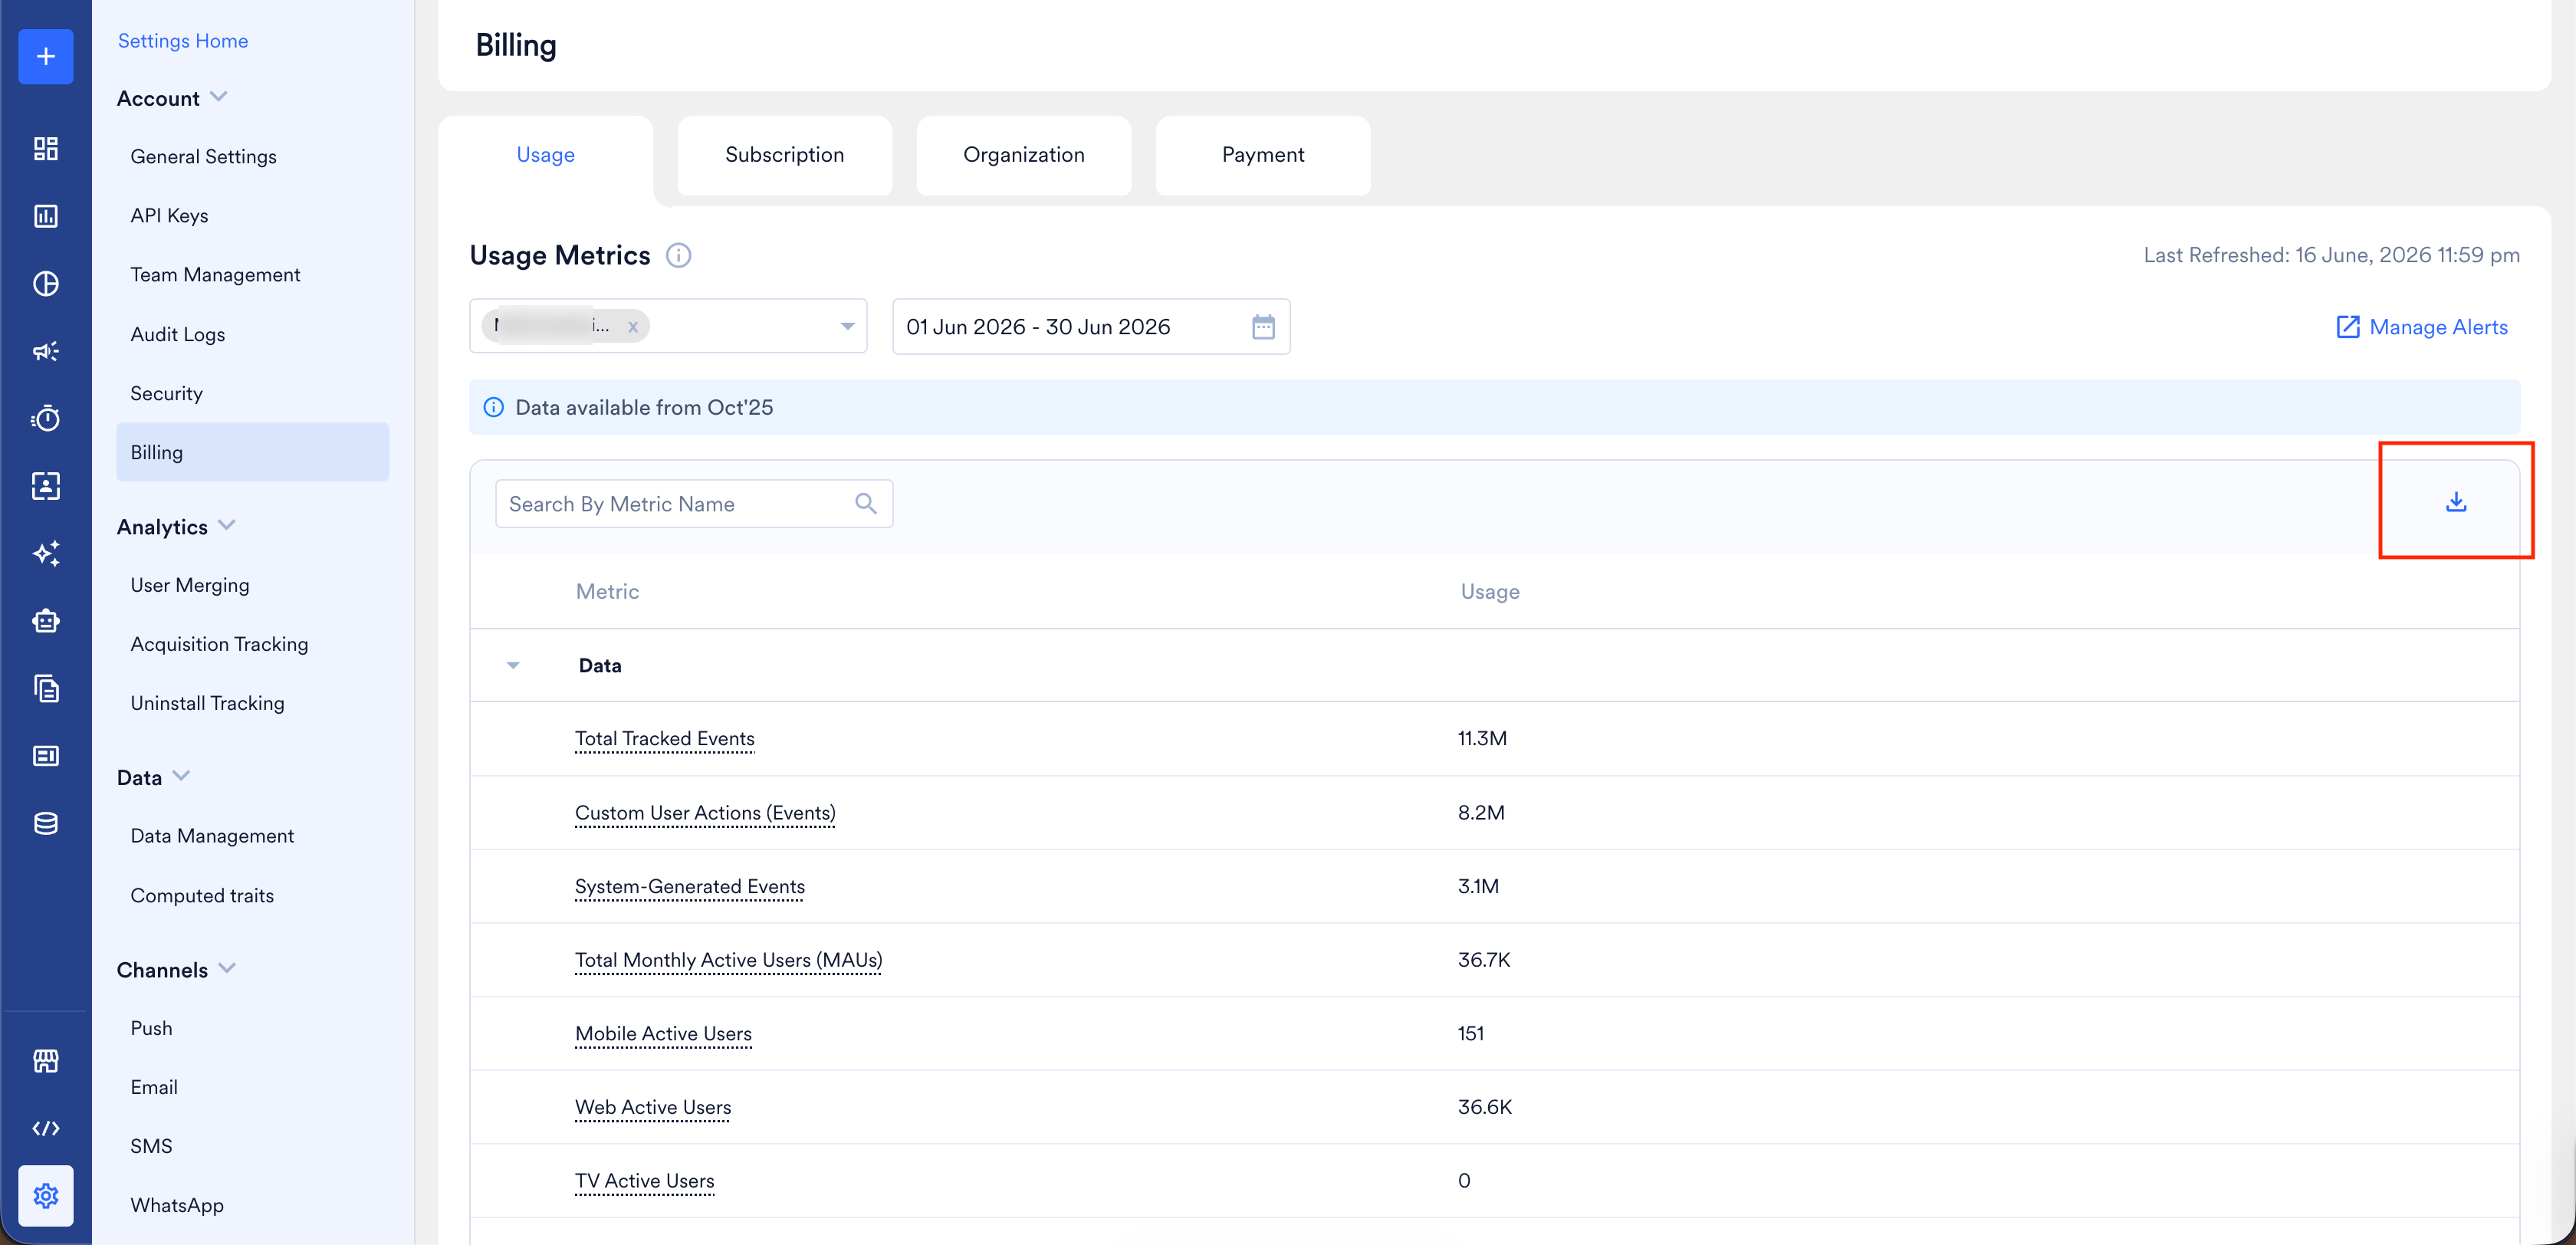
- Download the metrics list: Click Download on the metrics list to download a full usage report.
- Export trends data:
- In the chart view, click Export Chart to download the graph as a PNG file.
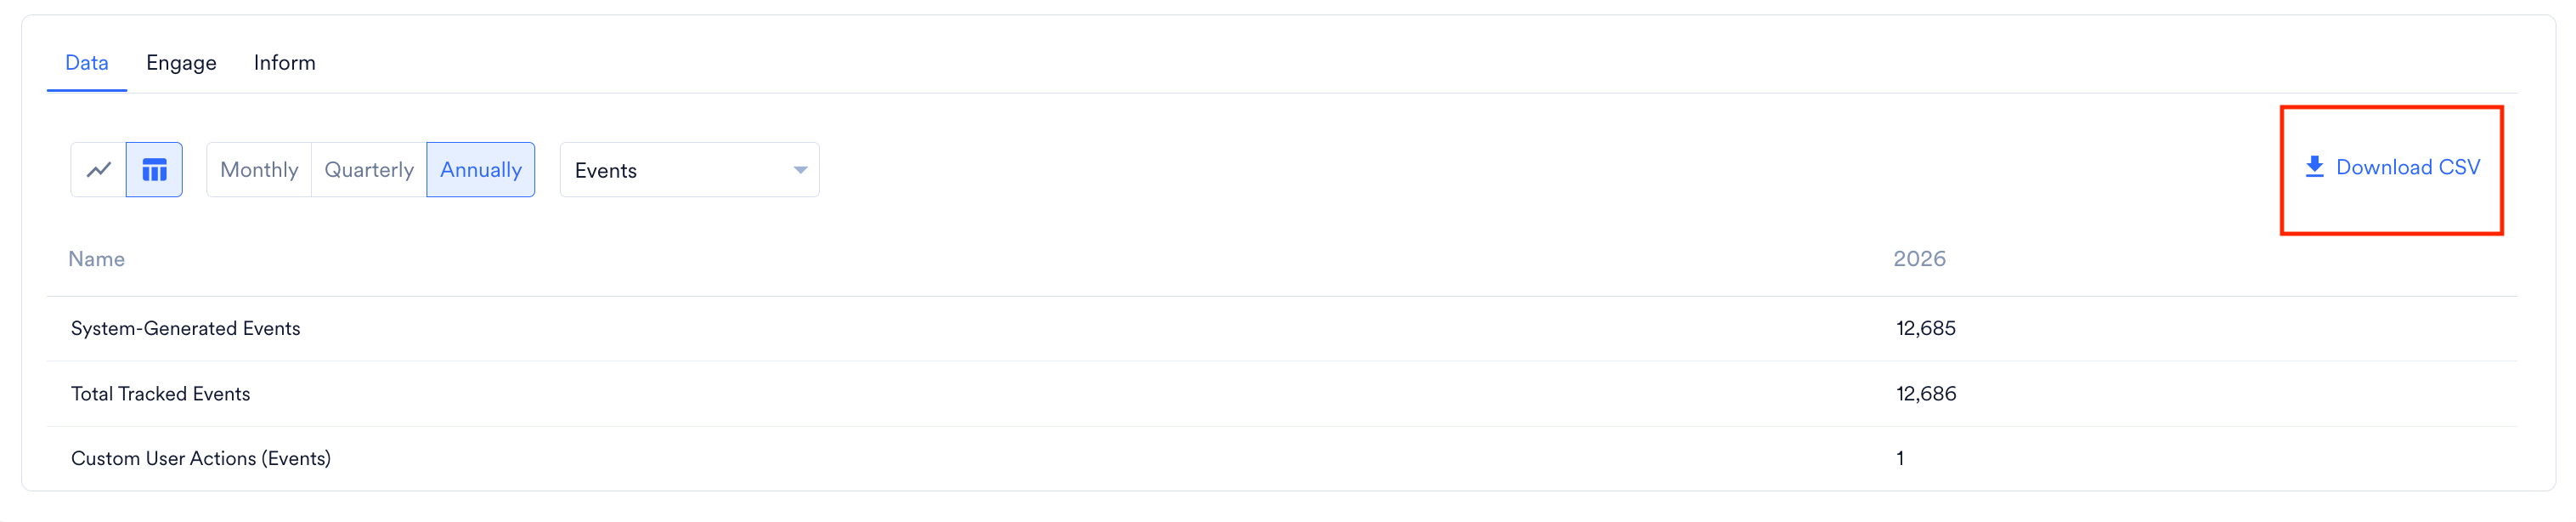
- In the table view, click Download Table to download the raw data as a CSV file.
Create Alerts
Stay ahead of your usage with custom alerts that notify you as soon as a metric crosses a limit you define. This gives you time to adjust campaigns, throttle activity, or plan an upgrade well before charges are incurred. To create an alert:1
Open Alert Management
Click + Manage Alert in the upper-right corner.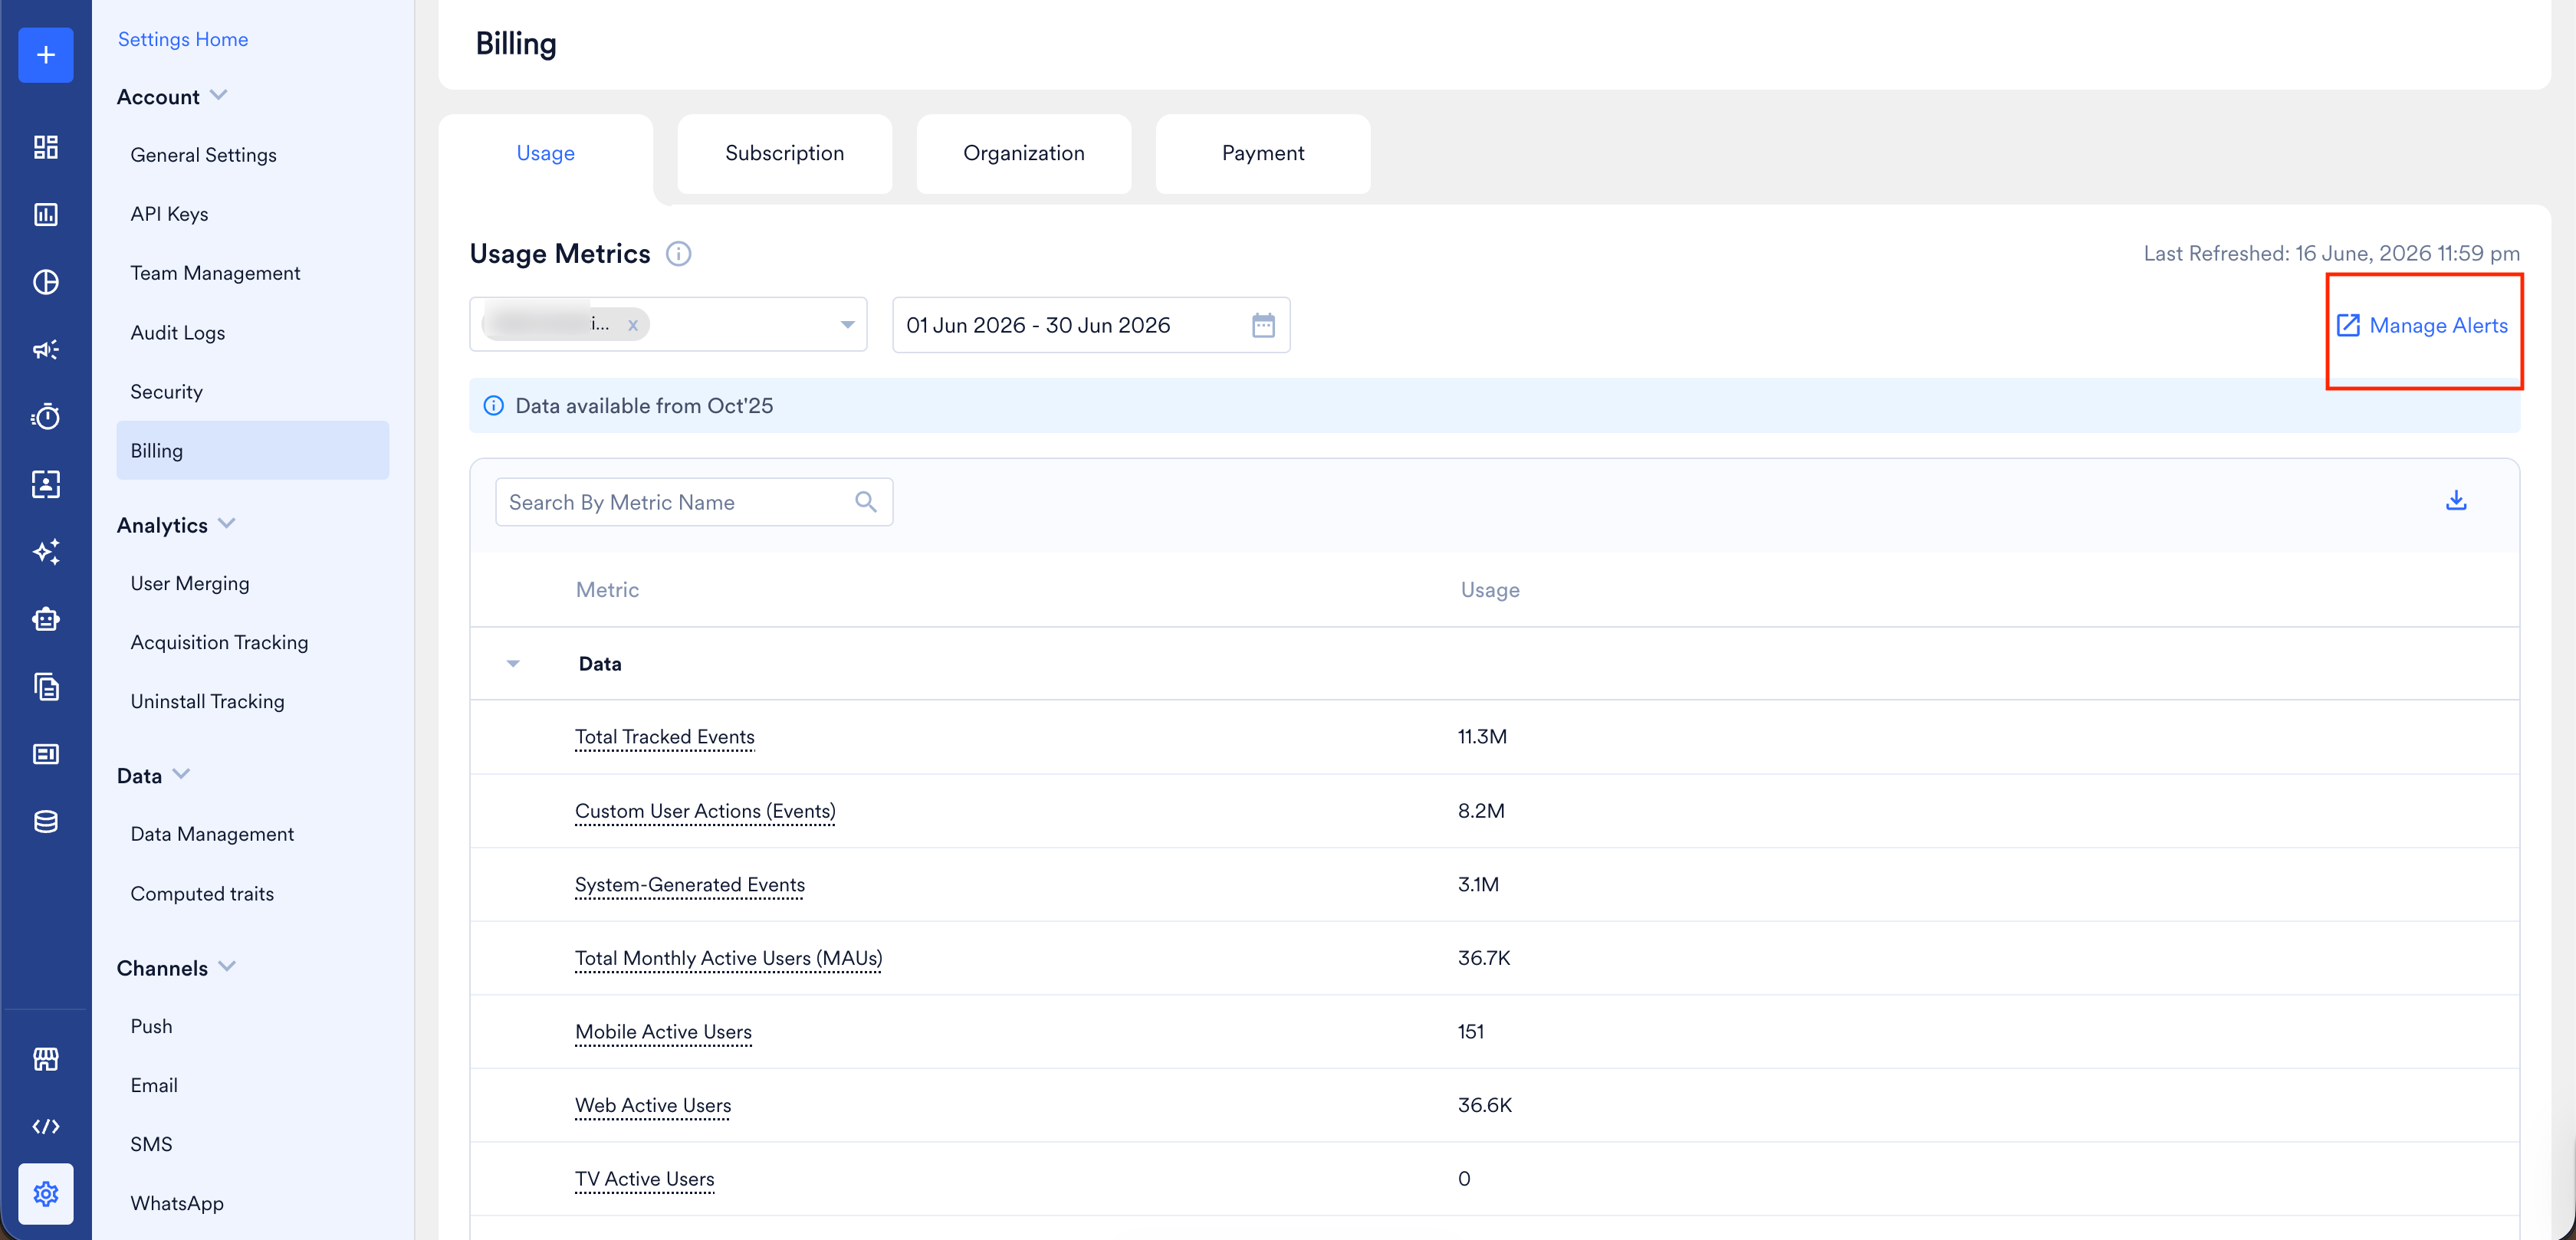
2
Start a new alert
Click + Create alerts in the upper-right corner. The Create alert page appears.
3
Enter the general details
On the Create Alert page, enter the general details:
- Alert name: Enter a unique name for your alert.
- Create Alerts On: Campaign Stats is selected by default. To monitor usage and billing metrics, select Billing.
- Send Alert On: Select your primary notification channel (for example, Email).
- (Optional) Click + Add alert destination to configure Slack, MS Teams, or Webhooks as an alert destination. For more information, refer to Alert Destinations.
4
Define the alert condition
- In the Send alerts when list, select the metric to monitor (for example, Total Tracked Events, Total Monthly Active Users, Web Active Users).
- Set the threshold logic (for example, Is greater than) and enter the numerical limit.
5
Add recipients
In the Members section, select the team members who should receive notifications. You can add any registered MoEngage UI user to the alert.
6
Save the alert
Click Create. For more information, refer to Alert Management.
Alert Evaluation Logic
MoEngage evaluates alerts daily and scans usage data accumulated up to the evaluation time against your set limits. You receive a notification as soon as the daily scan identifies that your usage exceeds a defined threshold.- You can edit and delete alerts. For more information, refer to Managing Alerts.
- MoEngage offers role-based permissions to create alerts. For more information, refer to Access Roles.
FAQs
Why is there a discrepancy in event count between the Billing Usage page and the Data Management page?
Why is there a discrepancy in event count between the Billing Usage page and the Data Management page?
The Billing Usage page reflects all data processed within the month, including historical backfills through file or data warehouse imports and data that arrives late due to delays. The Data Management page shows a daily snapshot and doesn’t retroactively update historical graphs for events added after the original date passes. Your bill reflects the total volume of data ingested, while Data Management shows only what MoEngage captured at that time.
Why is there a difference between the data in Billing and Key Metrics?
Why is there a difference between the data in Billing and Key Metrics?
Key Metrics shows Monthly Active Users (MAU) as a rolling count for the last 30 days. Billing MTU is calculated on the actual calendar month, which varies between 28, 29, 30, or 31 days depending on the month or leap year. This difference in calculation windows means the two numbers rarely match exactly.
Why is there a difference between the data in Billing and Segmentation?
Why is there a difference between the data in Billing and Segmentation?
MoEngage calculates billing MTU on the first day of every month as a fixed snapshot. Segmentation queries run against live data, so the two can drift apart afterward:
- If a user merge happens after the billing calculation, re-running a segmentation query can show a decrease in user count.
- If events reach MoEngage’s servers with a delay, re-running a segmentation query after the delay can show an increase in user count.