


Kafka Redesign and Lessons Learned
Apache Kafka has become an integral part of the MoEngage stack since 2016. We started using Kafka for a small use case. However, within two more quarters from now, most of our systems will rely on Kafka for different use cases. We have had many learnings and redos on Kafka. In this blog, we would like to talk about our Kafka cluster’s recent redesign mainly. Our objective is to give back to the community by sharing our learnings. We want to enable amazing engineers out there to see through some of the pitfalls early and avoid them.
The scale at MoEngage
We want to start by letting you know the scale of the problem we are dealing with. It took about eight months for us to carefully transition from the old Kafka system to the new one. No, it can’t be done in a night or a month; enterprise playbooks are different, customer experience is the top priority. We did not have much of an issue with Kafka when our scale was lower. We were operating with one large cluster, and with very little monitoring. But I keep telling people; scale is another dimension of software design; things will break at scale, and whatever design you had earlier will no longer work. You are forced to think hard and develop ingenious solutions to solve the problems cost-effectively.
These are the current traffic metrics at MoEngage:
-
We currently operate 20+ Kafka clusters with approximately 3 to 10 brokers in each cluster.
-
We process 250k+ events per second in one of our Kafka clusters closely, and close to 1 million messages per second are processed across clusters in 4 AWS regions.
-
And there are close to 100K messages per second incoming messages in a top-level topic in one of the Kafka clusters.
-
We are using Kafka 2.6.0 version, and there are a few clusters with version 1.1.0 in the upgrade process.
This blog post will take you through our journey of using Kafka at MoEngage. First, let’s understand the use cases that we have at MoEngage for Kafka.
Use cases at MoEngage
-
Messaging
Multiple services generate certain kinds of events like sending a communication via email, text, notification, etc.; we need all such types of events to be available at a single place where other services can utilize these data to find business insights, build analytical stats, train our machine learning models for sending out communication more intelligently and build segmentation in the data warehouse. So typically, an event generated by any service travel across many other services to act upon, Hence our pipelines are designed based on the pub-sub model where similar kinds of events are published into Kafka topics, and relevant services utilize those events by simply subscribing to them. -
Stream Processing
Most of our business use cases require real-time (or near real-time) processing of events such as calculating/updating statistics, triggering an event-based communication, updating users’ profiles, events enrichment, etc. There are always running pipelines that act on specific events and produce another event for further processing for other pipelines/services. -
Log Aggregation
We have multiple services running on thousands of instances serving business use cases and generating events logs. For centralized logging, we need all these logs to be aggregated at one place to be grouped, ordered such that these can be utilized later on for debugging, event-tracing, analytics, alerts, etc. -
Changelogs stream
MongoDB is heavily used at MoEngage and works as a primary data storage engine for most applications/services. Apart from data/query serving, We heavily rely on the change data capture(CDC) stream of MongoDB documents to track the changes in Users/Devices data, keeping caching(Or state in stateful streaming jobs) in sync, updating warehouse tables, etc. -
State management
Many applications use Apache Samza as a stateful stream processing engine for processing events and serving core business features. Samza’s local state allows applications to read and write large amounts of data with better performance than connecting over the network to a remote database. This local state is stored as compacted topics in Kafka for fault tolerance.
Now that you have seen the use cases, we will explain the structure of our older Kafka cluster and explain the problems with it in the following section.
Kafka Legacy cluster
Back in 2018, As an upgrade from Kafka version 0.8.0 to 1.1.0, a new Kafka cluster was created for serving all application and streaming jobs. As MoEngage kept expanding business, There was a continuous growth in the
numbers of processed events in the Kafka cluster. We reached certain stages where keeping the cluster healthy with minimum maintenance operation overhead is inevitable. There used to be two clusters in every AWS region where we operate our business services.
kafka-datacluster has topics with all business-driven events data.kafka-logscluster has topics with all logging events data.
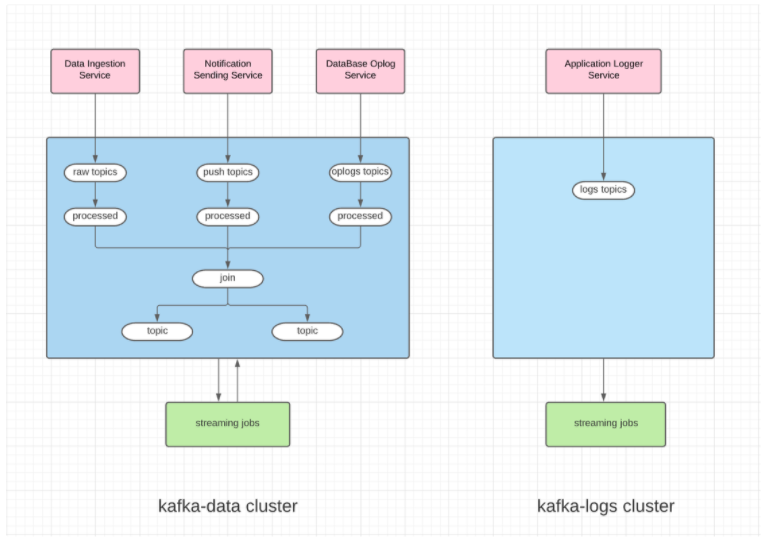
Kafka Producers
Here are some of the major producers who generate events into Kafka –
-
Data Ingestion Service – an event will be generated whenever our Reports workers processes requested sent by SDK installed on the client’s mobile App. (Example ?)
-
Notification Sending Service – an event will be generated whenever our Push workers send out a communication.
-
DataBase Oplog Service – There will be an event whenever we create/update/delete and document in MongoDB.
-
Application Logger Service – These events are generated during application executions(e.g., INFO, ERROR logs)
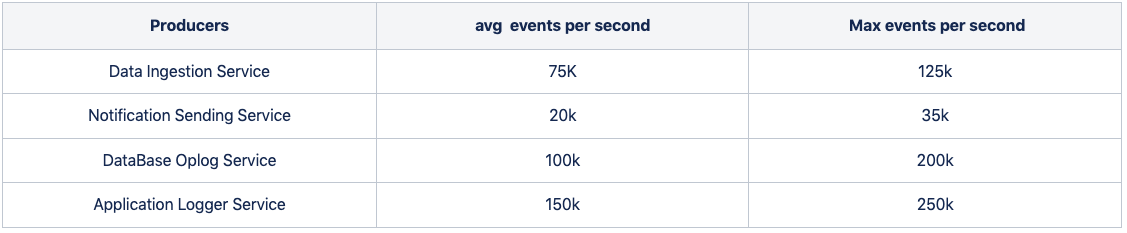
Below are the numbers of events produced per second to Kafka in one of our data centers when writing this blog.
Problems with the old Kafka cluster
Initially, we started the kafka-data cluster with 12 brokers nodes, and with the horizontal scaling of the cluster, The cluster was running with 50+ brokers over the lifespan of 3 years. Each broker is a type of c5.2xlarge and uses two volumes of 750GB each. While operating this large cluster, we reached a stage where we started facing certain blockers, and it was time to rethink our Kafka infrastructure and retire this cluster. some of the blockers are –
-
Single point of failure – Since all the applications depend on one cluster, any planned/unplanned downtime directly affects all the applications and services.
-
Monolithic cluster Since this cluster resources are shared among all the services, any abnormal usages pattern by any service would impact the rest of smooth running services/applications.
-
Handling burst – Mostly, our streaming jobs are dependent on each other’s output, say if upstream streaming jobs are stopped, then there is no incoming data in downstream streaming jobs for processing. So there used to be a sudden burst in numbers of messages being produced and consumed; whenever we used to restart upstream streaming job after a downtime of a few minutes due to a newer version of the application release, brokers restarts or incase of higher message in-rates at top level topics. This sudden burst for even a few minutes would lead to higher resources utilization at Kafka brokers, causing 90% CPU utilization and higher request latency.
-
Vertical scaling was not an easy option for us in the case of a broker running at higher resource utilization. It requires instance type changes and brokers restart, which leads to a few minutes of downtime for a broker.
-
Horizontally scaling
-
Adding more brokers doesn’t serve as active brokers for producers and consumers until topics-partitioned are distributed to new brokers, So we had to take a maintenance window for performing re-distribution of topics across brokers.
-
Sometimes Partitions reassignment operation across the cluster takes significant resources such as Network bandwidth, Disks IO, etc., and affects running consumers and producers. So we had to perform such operations during the non-peak hours, like late at night.
-
Some of our core topics are very high numbers of messages, and larger data retention will require us to perform partitions-reassignment in stages using the kafka-reassign-partitions tool instead of redistributing the whole topic(all partitions) at once.
-
-
Unbalanced disks usage every broker is using multiple disks(3 disks on each broker); whenever we redistribute the partitions, There used to be a case when all the partitions(segment with higher retentions) of a topic are stored on one disk instead of being distributed equally among all disks brokers have, This leads to a case where is having 85% disks usage while others are at 50%.
-
Hotspot topic There is a unified topic where incoming events from multiple sources are joined and created unified events which work as source topics for all many business-critical streaming jobs. As we solved more business use-cases and added more streaming jobs, this topic became a hotspot for network out-rate in the Kafka cluster. It became hard to add more jobs consuming events from this topic.
Now that you have seen our older Kafka cluster problems and it’s configurations, we take you through some of the design principles that were used in designing the new Kafka cluster.
Learnings

Some of the key learnings while running the Kafka cluster(Kafka version 1.1.0) at MoEngage
-
ProduceRequestsPerSec – Higher number of ProduceRequests consume significant broker resources, So monitor the number of produce requests per second for topics and minimize it using the right values of linger.ms and batch.size in ProducerConfig.
-
Compression – Use the right compression for topics, e.g., choose zstd compression if you need higher retention for topic and lz4 if the topic has high producer-request-per-sec, as ztsd compresses data better on disks while requiring more compute resources.
-
Num-partitions – Keep the number of partitions in topics as lower as your consumer/producer works well within SLA, try scaling consumers/producers vertically first with the right resource tuning, and increase the number of partitions when consumers/producers are unable to get higher throughput with vertical scaling. Also, brokers’ performance degrades when you have a huge number of partitions for a broker to manage.
-
Partitions reassignment(redistribution)
-
Avoid redistributing all partitions of the large topic(s) at once, as that could make it unstable while consuming significant broker’s resources and impacting producers/consumers.
-
While distributing a large topic, ensure there are enough free disks available on brokers. Here is one blocker we encountered while partitions-reassignment –
Let’s assume there are 6 brokers in a cluster, and a topic with 12 partitions is just distributed on 3 brokers with 4 partitions on each broker (for simplicity, consider replication factor = 1). If we reassign partitions, each broker would have now 2 partitions (As 12 partitions on 6 brokers). in this case, sometimes Kafka might move out 4 partitions from a broker and add other 2 partitions of the topic for 5 minutes(default log.retention.check.interval.ms) brokers would keep moved-out partitions(as .deleted files) and newly assigned partitions. And if you are running partitions reassignment for multiple large topics, brokers might run out of all available disk space till log cleaner threads clear deleted segment files.
-
The design philosophy for the new Kafka model
-
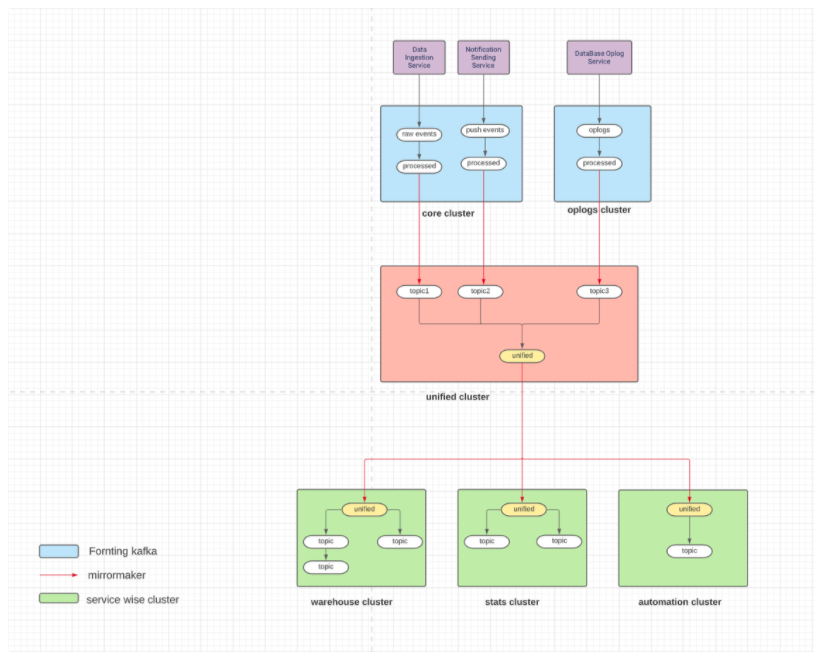
Segregation – The idea is to minimize the impact of Kafka downtime on services/applications, So we adopted an approach to have multiple Kafka clusters where similar sets of services/applications will share each cluster. This allows us to create clusters with different hardware and resource configurations, such as instance types and volume sizes. Taking downtime for a maintenance window will impact only a few topics and applications/services running on that cluster.
-
Fronting Kafka cluster – A few services run on thousands of spot instances with auto-scaling-group where instance comes and goes, producing data into the root(top) level of the topic in Kafka, which are then consumed by downstream pipelines/steaming jobs. So we wanted to have this fronting Kafka cluster have only a few sets of topics. There shouldn’t be any application directly consumed and produced into it. It requires very minimal (or No) downtime for any maintenance.
-
Multiple backend Kafka cluster – We organized applications/topics based on services such that they have a separate dedicated cluster for them. Every cluster will have a set of required topics mirrored from other top clusters. This will allow us to have a topic with different partitions for compute-intensive/lower-throughput-based consumers. Also, if we need to add more applications/services, instead of scaling or running them on any existing cluster, we can launch a new cluster by mirroring required topics there.
Implementation
-
Hardware consideration: We use compute-optimized Amazon EC2 instance type (c6g types) for Kafka brokers attached with either 2 or 3 general-purpose SSD(gp3 types).
-
Launching Infrastructure – We have a Terragrunt setup for launching infrastructure(EC2, EBS, DNS, security-group, Tags, etc.) in AWS with a simple configuration file.
-
Kafka installation and cluster setup – we use cp-ansible for Kafka installation and broker setup.
-
Zookeeper – we use three nodes of zookeeper cluster setup for every Kafka cluster.
-
Mirror maker – Many topics are being mirrored between clusters using Mirrormaker2 and strimzi-kafka-operator to run mirror maker on Kubernetes.
-
Monitoring and alerting- Prometheus is used for metrics collections, and Grafana is used for visualization. Certain tags are used while launching the infrastructure for any cluster such that Prometheus will start scrapping metrics when new brokers have been added. Simultaneously, there is a setup of PrometheusRules deployed for alerts using metrics labels. Monitoring and alerting setup are created in a generic way to start working for any new cluster right away.
As you have seen by now, we have split our monolith Kafka into smaller Kafka clusters, how do we maintain so many clusters across our DCS?-here is your answer
How do we maintain so many Kafka clusters?

-
Prerequisite – We first add enough buffer into cluster infrastructure to handle peaks and don’t require continuous administration. So before launching a Kafka cluster, we perform these steps –
-
Information gathering of the number of topics, partitions, produce-requests, network out-rate from consumers, events and retention, etc.
-
Analyze these numbers and calculate the expected infrastructure requirement.
-
Add buffer into infrastructure considering the future growth of a few months and SLA handling.
-
-
Alerts – our alert setup plays a key role in keeping our Kafka cluster healthy and smooth running. A few sets of rules are defined to consider a state of healthy clusters like CPU Usage, disk usage, Request Latency, Messages In-rates, etc. Based on the severity, these alerts are again categorized into two as
-
WARN – considered soft alerts generated via slack; it doesn’t require immediate action from Kafka Admin but helps calculate potential scaling needs.
-
CRITICAL – These alerts are triggered via PagerDuty call to Kafka Admin to take immediate action (e.g., UnderReplicatedPartitions)
-
-
Monitoring -Grafana dashboards monitor all the clusters in one place for monitoring brokers and topics. kafka-manager and kafka-minion is used for monitoring offsets and consumer-group lags.
-
Scaling & Maintenance -Terraform + Ansible setup is used to scale the infrastructure for a cluster, and some operations that require the broker restart are performed during the maintenance window. Kafka-manager is used for performing operations on topics configuration such as increasing partitions, increasing retention, etc. Multiple Kafka cluster setup has enabled us to have a dedicated cluster for similar services and applications. Any maintenance exercise on a cluster only impacts services using it directly.
Conclusion
Our new Kafka setup has brought a lot of reliability into our system. At the cost of jinxing it, we can uphold our SLA commitment to our customers much more than we did with our older cluster, and the kicker is that we can do it with a 20% reduction in costs. This is another long-term bet that we have taken at MoEngage, and all the teams have contributed well in moving their services to new systems and leveraging the new system’s benefits.
We suggest you also read our 2021-Year in Review Engineering Blog where we talk about our scale, overhauls and improvements in platform and process
There has never been a dull day at MoEngage! To be a part of this rocketship-check out our open opportunities.