


E-commerce App Retention Trends India [2022]
-
Measure your app’s performance against the top e-commerce players of India
-
Get tips and insights from industry leaders
-
Beat the industry average with a to-do list of action items


WHO IS THIS FOR?
If your KPIs include MAUs, DAUs, active sessions per campaign, ARPU, LTV, retention rate, churn rate, activation or adoption, then this handbook is for you!
Product Managers
One of the most important KPI for Product Managers in the E-commerce industry is the retention rate. Through this report, establish retention benchmarks and use the pointers inside to improve your app's retention score.
Marketing and CRM Managers
E-commerce brands rely on Marketing and CRM Managers to boost the engagement of newly acquired users and existing customers. In this handbook, read how industry leaders segment their users and drive engagement.

CMOs and Marketing Directors
Marketing teams in the e-commerce industry are not only expected to acquire new users but also increase revenue. Get tips to run effective campaigns that focus on repeat purchases, making a direct impact on the ARPU of your app.
"MORE THAN 56% OF USERS UNINSTALL THEIR E-COMMERCE APPS WITHIN THE FIRST WEEK!"
"Over 51% of e-commerce app users uninstall their app without launching it even once!"
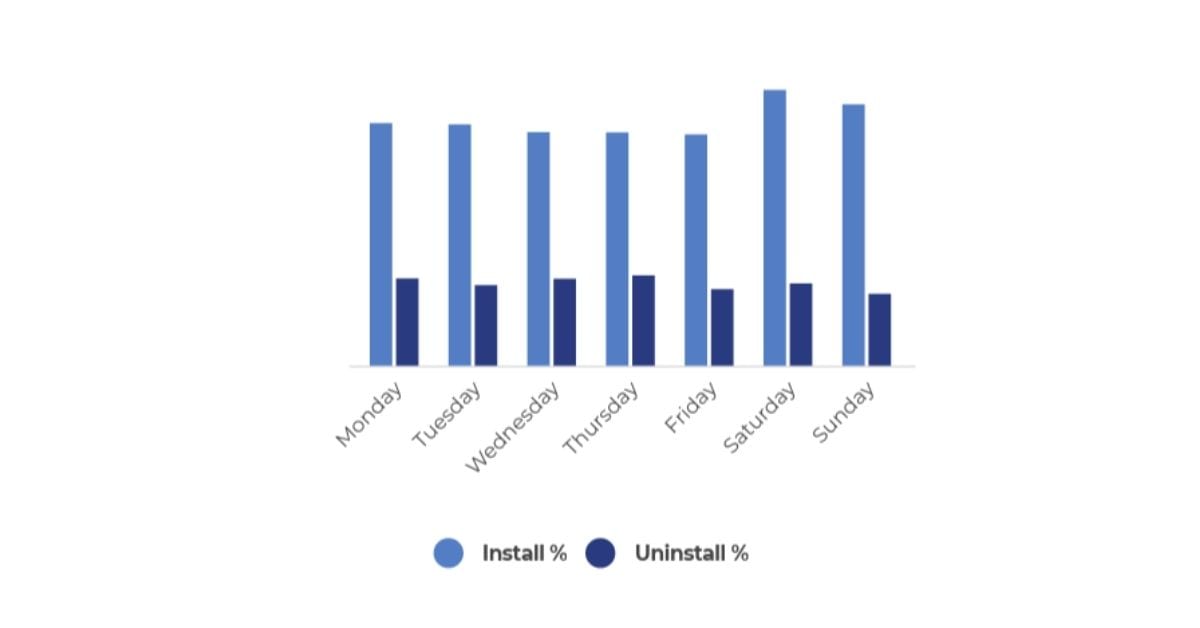
"31% of all installs happen over the weekend (Sat-Sun)"
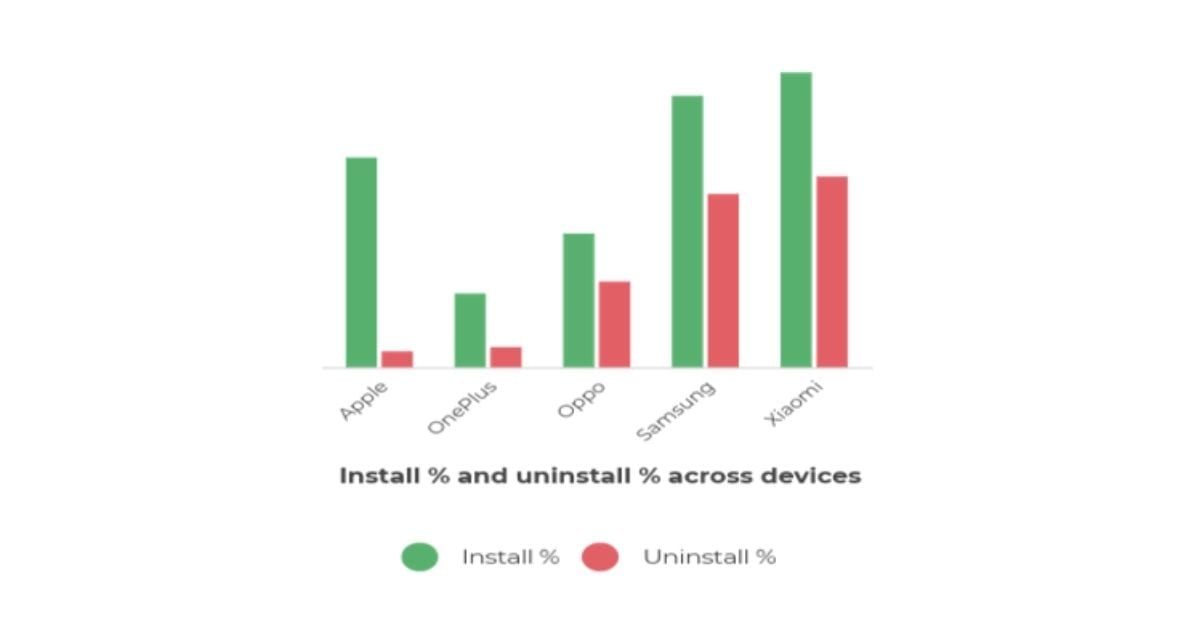
"Apple users have the lowest uninstall/install ratio, whereas this ratio is the highest for Samsung and Xiaomi users."
A unique, data-driven, in-depth analysis of E-Commerce App retention rates - now available a click away
DOWNLOAD REPORTFrequently Asked Questions
56% of users who install e-commerce apps, delete the app within the first 7 days (1 week)
App uninstalls can be attributed to the following factors: ⦿ Utility: Quite often people find that the app does not live up to their expectations. For some, the ease to perform an action is a determining factor. Most users prefer stable apps that do not freeze or crash! ⦿ Trust: User privacy is a rising concern, and consumers are very selective about the data they share. If your app constantly requests access to social accounts or sends invites from the users’ behalf without approval, your app uninstalls will be high. ⦿ Bloatware: People love apps. However, with limited device memory, they prefer apps that require less space, load faster and do not store too much data locally. ⦿ Annoyance: Push notifications are a great medium to engage users and boost retention. But, they can also be the primary reason for uninstalls. Consumers treat irrelevant notifications as spam and are more likely to delete apps that spam them. ⦿ Data consumption: Users tend to uninstall apps that require a constant mobile internet connection for background refresh or consume too much data.
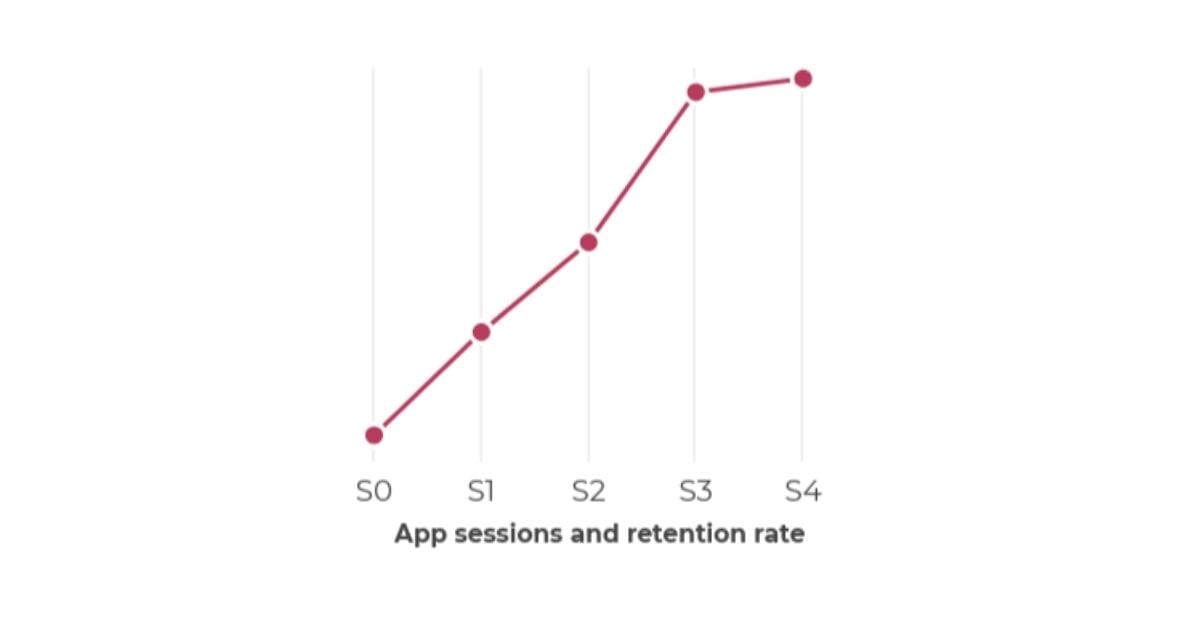
Statistics show a direct relation between app engagement and uninstalls. As the number of sessions increase, the uninstall rate decreases. This report also shows that as the number of transactions on an app increases, the retention rate increases proportionally.
Push notifications are a great way to bring back users to your app. However, you need to be careful that you don’t send too many notifications to a single user. Another idea to boost app engagement is to regularly create relevant content that your users are likely to consume, this could be videos, image carousels, infographics, podcasts, or even interactive quizzes.
The ratio of all uninstalled users to installed users in a given time frame will help you calculate your app’s retention rate.
App engagement can be measured by tracking DAU (daily active users), WAU (weekly active users), or MAU (monthly active users). Some other metrics that indicate app engagement are number of sessions, session interval, and retention rate.
If you divide the DAU by the MAU, you will know your app’s stickiness. Multiply it by 100 to calculate stickiness in percentage.
About 44% of users retain their app after 7 days (1 week) of install. Note that retention rate varies by vertical and location.


