


The Global Consumer Trends Report, 2023
-

Understand the shift in consumer preferences and behavior in different regions and industry verticals.
-

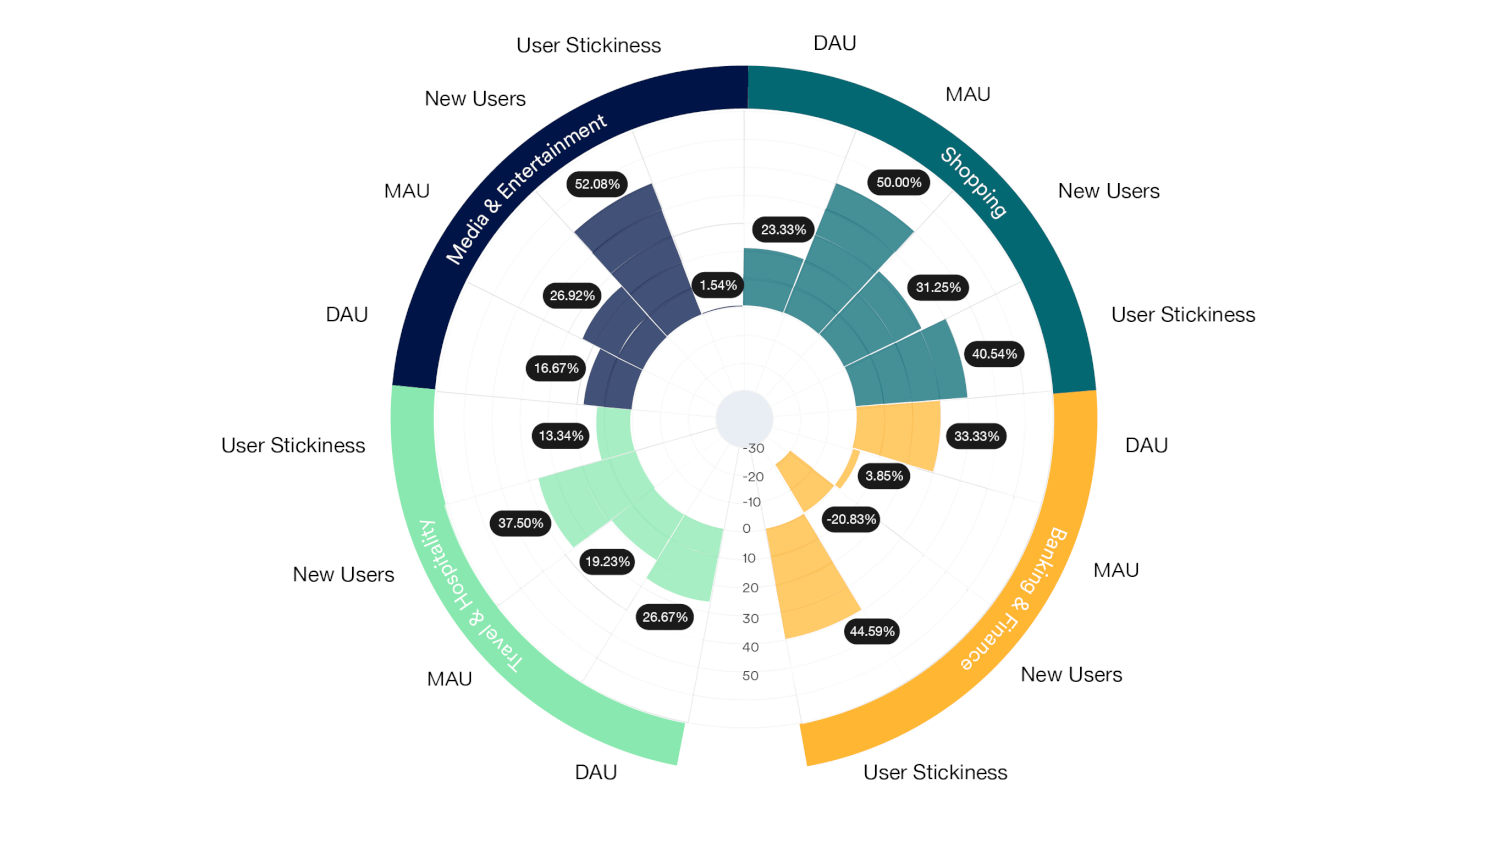
Know how Acquisition, DAU, MAU, and the customer stickiness of different industries have changed.
-

Evaluate your brand’s performance against industry benchmarks across different regions.
-

Discover how a consumer brand like yours can leverage customer insights to boost loyalty and increase LTV.
-

Learn actionable strategies to drive sustainable growth amidst economic uncertainty.
-


The Highest Consumer Spending Across the Globe Is For Entertainment and Shopping…
- 1 in 2 Indians spent on Entertainment platforms, followed by Shopping.
- 50.6% of consumer spending in Europe was towards online Shopping platforms.
- 49% of North American consumer spending was towards Entertainment.
- 45% of Australian consumer spending was towards Entertainment platforms (including streaming services, gaming, dating, and lifestyle).
- 61.4% of Latin American consumer spending has been toward Media and Entertainment platforms.
- 47% of consumer spending in Southeast Asia was towards Entertainment platforms (including streaming services, gaming, dating, and lifestyle).
- 48.2% of MEA consumer spending was towards Entertainment.
…and Consumers Prefer to Use Smartphones More Often
- 80.2% of Indians use their smartphones to buy new products online.
- 65.2% of Brits prefer shopping on their smartphones.
- 1 in 2 consumers in Singapore prefers streaming music, videos, and movies on their smartphones.
- 62.4% of Germans use their smartphones to get information for travel plans and make reservations.
- 68% of Latin Americans prefer using their smartphones to shop online.
- 56.8% of North Americans prefer using smartphones to make travel plans and bookings.
- 89% of shoppers in Indonesia prefer smartphones for shopping online.
- 60.4% of consumers in MEA prefer mobile applications and websites to stream music and videos.
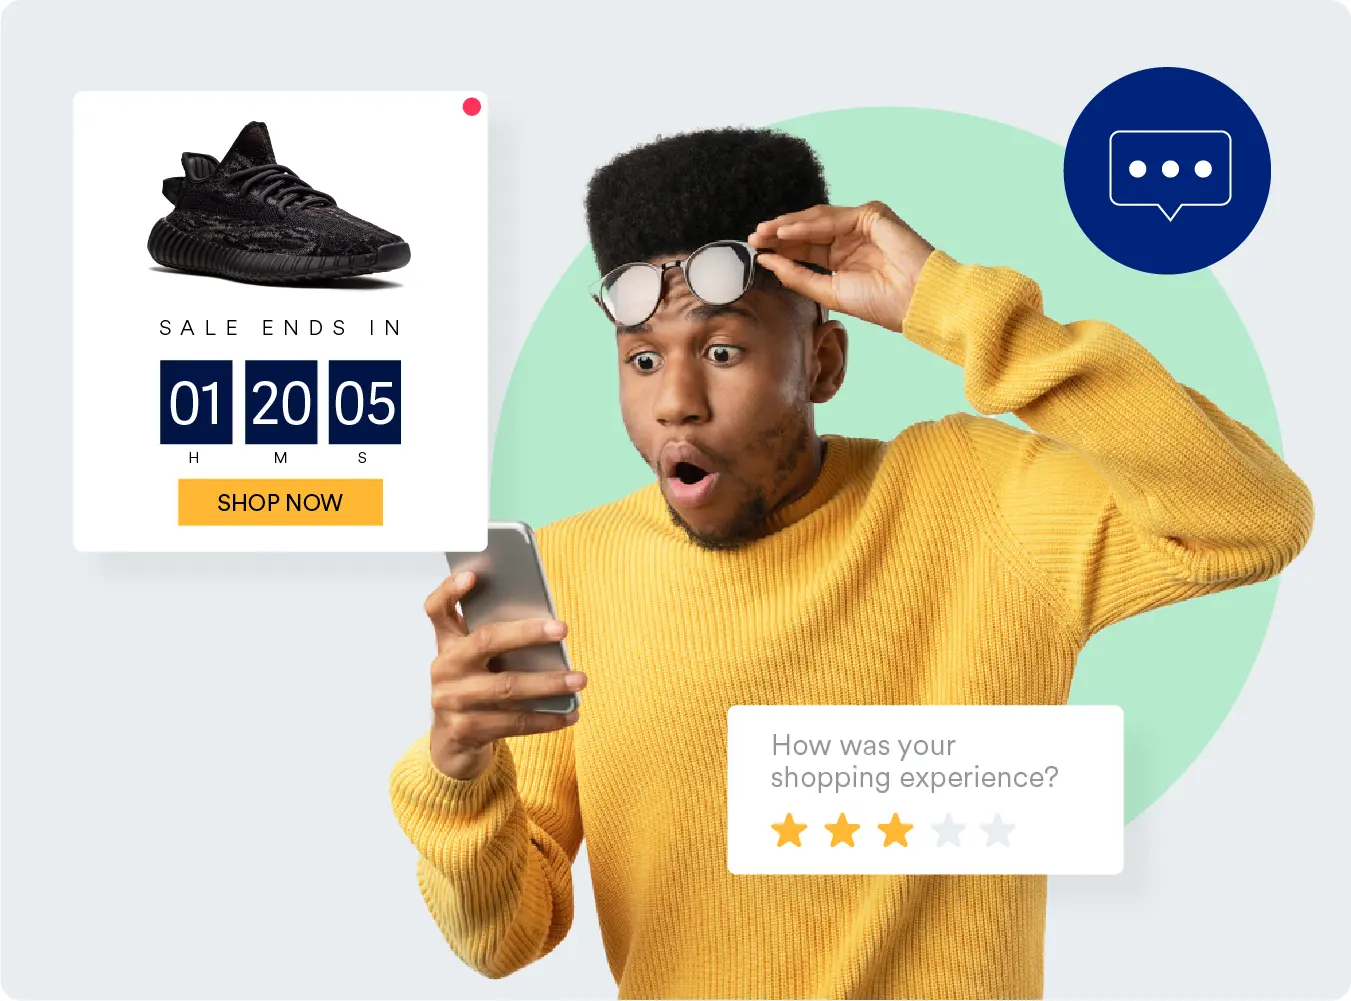
New Shopping Behaviors and E-commerce Trends 2023
Let's look at buying habits and shopping habits globally.
India
• Before making a purchase online, 68% of Indian shoppers interact with a brand app or website at least 4-5 times.
• 32.4% of Indian consumers have spent the most on shopping.
• 80.3% of Indians prefer purchasing products on their smartphones via mobile apps or websites.
North America
• More than 53% of North American shoppers visit an app or website more than three times before making a purchase online.
• 31.6% of North American consumers have spent the most on online shopping.
• 55.8% of North Americans buy new products on their smartphones via mobile apps or websites. Many consumers in North America prefer it over a physical store.
Europe
• More than 55.2% of European shoppers visit a shopping app or website at least 4-5 times before making a purchase.
• 33.6% of European consumers have spent the most on shopping.
• 63.2% of European shoppers prefer shopping on their smartphones via mobile apps or websites vs in-store shopping.
Latin America
• 25% of Latin American consumer spending has been towards shopping.
• 68% of Latin Americans prefer using their smartphones to shop online.
• 44.8% of Latin American shoppers visit an app or website more than five times before purchasing.
Southeast Asia
• 73.2% of Southeast Asians prefer buying products online on their smartphones.
• 62.6% of Southeast Asians prefer buying groceries at least once a week.
• 8% growth in new customers for Food Delivery and Grocery platforms.
The Middle East
• Research shows that 34% of consumer spending in the Middle East has been towards shopping.
• 2 out of 3 shoppers in the Middle East prefer using their smartphones to shop online.
• 28% growth in MAU for E-commerce platforms.
Get top consumer trends from 1.30 billion consumers globally!
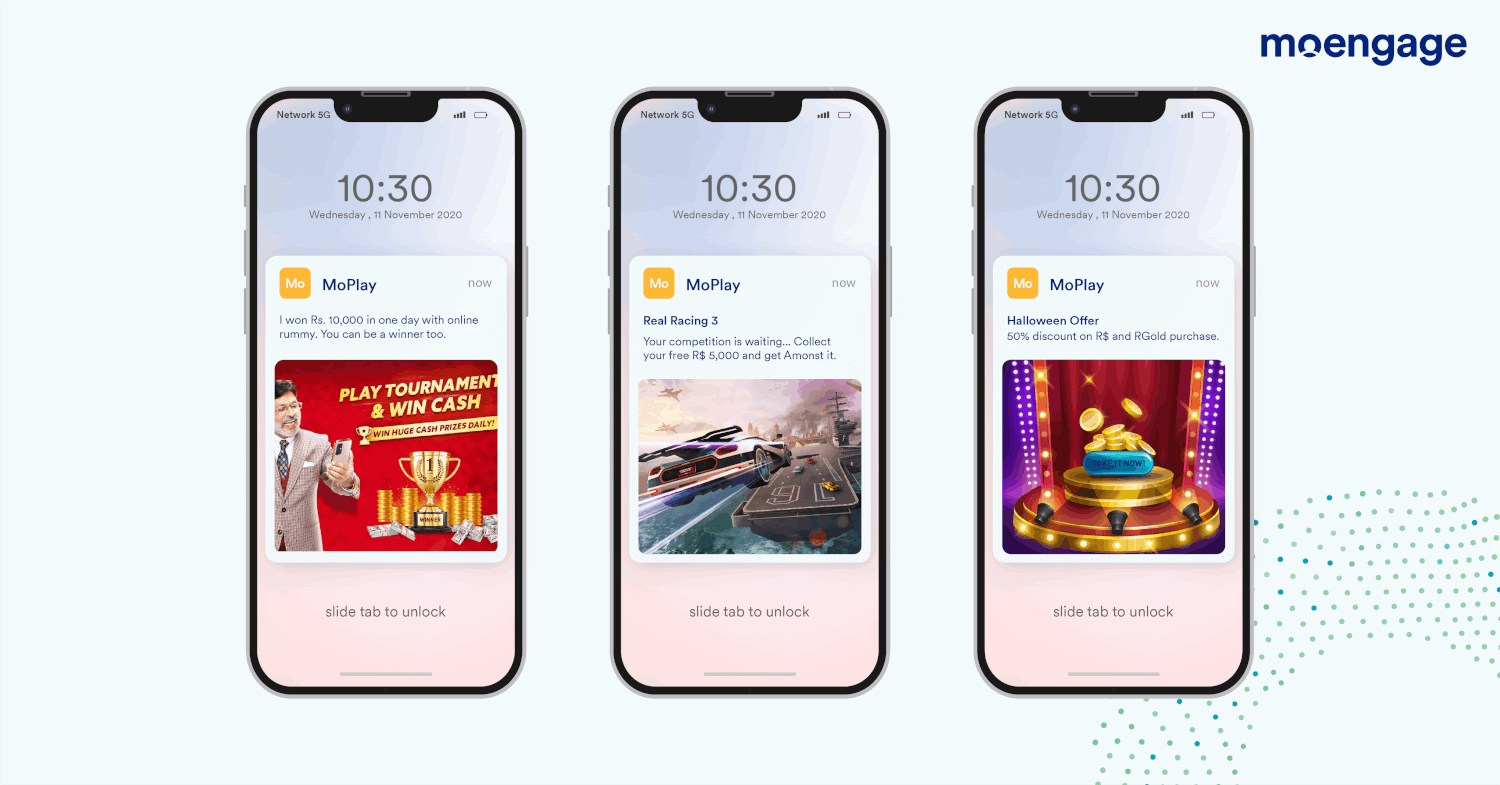
Read ReportStreaming Trends and Statistics 2023
Let’s look at consumer trends in the Media and Entertainment industry.
India
- 65.4% of Indians stream videos, TV shows, movies, and music on their smartphones daily.
- 50% of Indians spend the most on Entertainment brands (streaming services, gaming, dating, and lifestyle services).
- Customer stickiness has grown by 50% for Gaming platforms.
North America
- 58.6% of North Americans prefer to stream music, videos, and movies on their TV units daily, while 33% prefer smartphones.
- 49% of North Americans spend the most on Entertainment brands (streaming services, gaming, dating, and lifestyle services).
Europe
- More than 55% of Europeans stream music, videos, TV shows, and movies on their TV daily, while 27.4% prefer smartphones.
- 50.6% of Europeans spend the most on Entertainment brands (streaming services, gaming, dating, and lifestyle services).
Latin America
- 61.4% of Latin American consumer spending has been towards Entertainment platforms.
- 54.2% of Latin Americans prefer to stream music, videos, TV shows, and movies daily.
- 44% of Latin Americans prefer streaming music, videos, and movies on their televisions.
Southeast Asia
- 46.6% of consumer spending in Southeast Asia has been towards Media and Entertainment platforms.
- 58% of consumers in Southeast Asia prefer to stream music, videos, and movies on their smartphones.
- 48% growth in DAU for OTT platforms.
The Middle East
- 60.4% of consumers in the Middle East prefer to stream music, videos, TV shows, and movies on their smartphones.
- 58% of consumers in the Middle East prefer to stream music, videos, TV shows, and movies daily.
MoEngage recently analyzed over 1.3 billion consumers to understand the behavior and preferences of the modern consumer.
Learn the insightsTravel Statistics and Trends 2023
Let's look at the top trends in the Travel industry.
India
• 1 in 2 Indians prefer using ride-hailing and cab services 3-4 times a week.
• MAUs have grown by 23% for Hotels and Travel platforms.
• 75% of Indians prefer to get information for travel plans and reservations from travel apps and websites.
North America
• 58.8% of North Americans prefer to get information for travel plans and reservations from Travel websites on mobile and desktop.
• 65% of North Americans use ride-hailing platforms fortnightly.
Europe
• 32% of Europeans prefer using ride-hailing and cab services once a week.
• 65.2% of Europeans prefer to get information for travel plans and reservations from mobile websites and apps.
• 1 out of 4 younger consumers in Europe prefer to use Ride-Hailing platforms 3-4 times a week.
Latin America
• 63.4% of Latin Americans prefer to get information for travel plans and reservations from mobile websites and apps.
• 42.2% of Latin Americans prefer using Ride-Hailing apps at least 3-4 times a week.
Southeast Asia
• 66.5% of Southeast Asians prefer to get information for travel plans using their smartphones.
• 34% of consumers in Southeast Asia use ride-hailing services at least 3-4 times a week.
• 64% growth in DAU for Hotels and Travel platforms.
The Middle East
• 5 out of 7 consumers in the Middle East prefer to get information for travel plans from a travel application on mobile.
• 27.2% of consumers in the Middle East prefer to use Ride-Hailing or cab services 3-4 times a week.
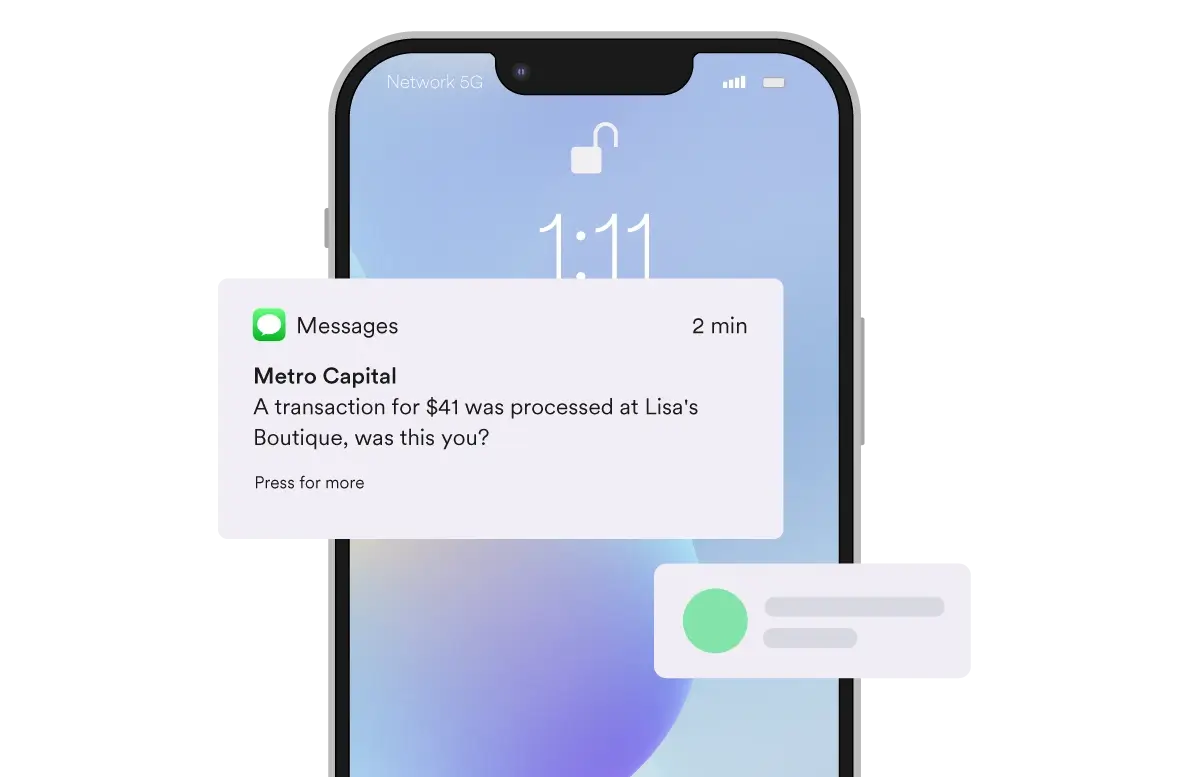
Banking Trends and Behavior 2023
Let’s look at the top consumer trends in the BFSI industry.
India
- 5 out of 8 Indians use Banking and Fintech platforms at least 2-3 times a week.
- Customer stickiness has grown by 11% for Banking platforms.
- New downloads for Cryptocurrency platforms has fallen by 60%.
North America
- MAUs have grown by 61% for Banking platforms.
- 1 in 2 North Americans visit Banking and Fintech platforms at least 2-3 times in a week.
- Customer stickiness has grown by 33% for Fintech platforms.
Europe
- 65% of Europeans prefer visiting Banking and Fintech platforms at least 2-3 times in a week.
- 18.8% of Europeans use Banking platforms to manage mortgage, loan, or bill payments.
Latin America
- 74% of Latin American consumers prefer visiting banking and fintech apps at least 2-3 times weekly.
- 1 out of 3 Latin American consumers use banking and fintech apps to view balances and review account activity.
Southeast Asia
- 62% of Southeast Asians visit Banking and Fintech platforms at least 2-3 times weekly.
- 37.9% of Southeast Asians use Banking and Fintech platforms to view balances and review account activity.
- 14% growth in MAU for Fintech platforms.
The Middle East
- 34.8% of the Middle East consumers use Banking and Fintech platforms to view balances and review account activity.
- 5 out of 9 consumers in the Middle East use Banking and Fintech platforms at least 2-3 times a week.
- 26% Increase in MAU for Banking platforms.
Learn how consumer demands and preferences have evolved globally in 2023!
Download Report2023 Global Consumer Trends in
The consumer trend in India shows that Indians have shifted their attention away from Crypto and Logistics platforms and have become more active on Shopping, Travel, and Streaming platforms. Additionally, our report shows that brand loyalty towards gaming brands has sharply risen.
Frequently Asked Questions
The Global Consumer Trends Report is a collection of the voice of the global customer and the latest benchmarks from the Shopping, Banking, Media & Entertainment, and Travel industry. The Consumer Trends Report helps marketing teams in global companies understand consumer demands and brand loyalty trends across geographies and strategies on how they can leverage it to grow sustainably. Apart from analyzing platform data, there were over 3200+ consumers surveyed for the report.
MoEngage is an insights-led Customer Engagement platform that helps global businesses and companies understand customer preferences, likes, and behavior to send the right communication across multiple channels to drive Northstar metrics like revenue, LTV, retention, DAU (Daily Active Users), and MAU (Monthly Active Users).
Brands can significantly improve customer retention by focusing on loyal consumers. This is because they drive revenue growth and attract new customers through brand advocacy. And there are multiple ways how brands can build loyalty. For example, brands can identify loyal customers through RFM segmentation and add them to loyalty programs. Another way to build loyalty is through referral campaigns.
Digital Customer Engagement is the interaction between your company and your customers over digital channels. Data shows that technology like AI and machine learning can improve your Customer Engagement metrics by determining the right message to send to the right customer at the most optimum moment and on the best channel.


