


Global Mobile Consumer Trends from 1.50 billion Mobile App Users [2020]
-
📈 Understand the shift in consumer confidence in different regions and industry verticals.
-
⚖️ Evaluate your mobile app’s performance against industry benchmarks across different regions.
-
💡 Know how downloads, DAU, and the average session duration of different mobile apps have changed.


What's in store for you
How the statistics changed in Q2, 2020 across
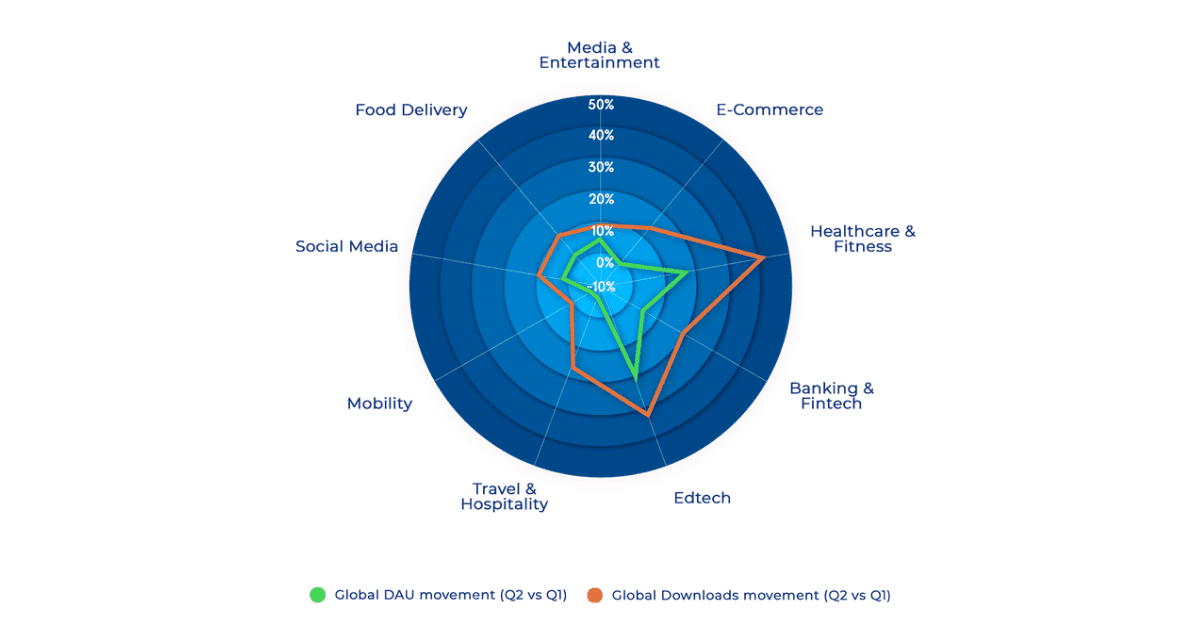
Globally, Media & Entertainment apps have seen a 10.10% increase in new users and 5.52% more active users from Q1, 2020.
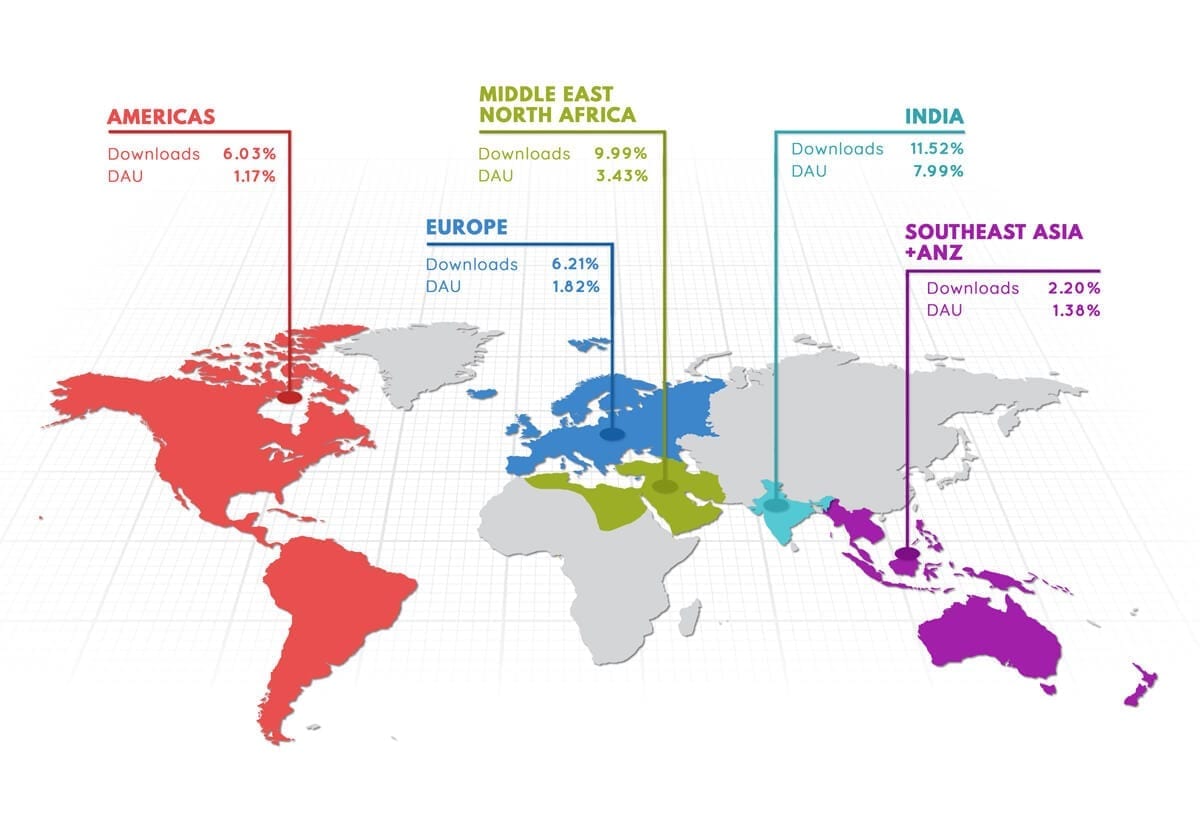
How has consumer behavior in different regions changed?
- The Americas
- Europe
- Middle East and Africa
- India
- South East Asia and the Pacific
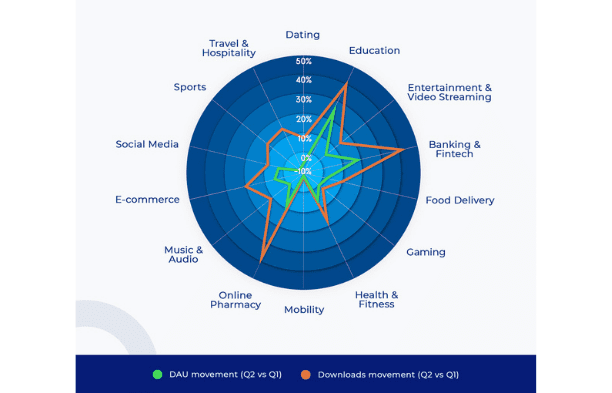
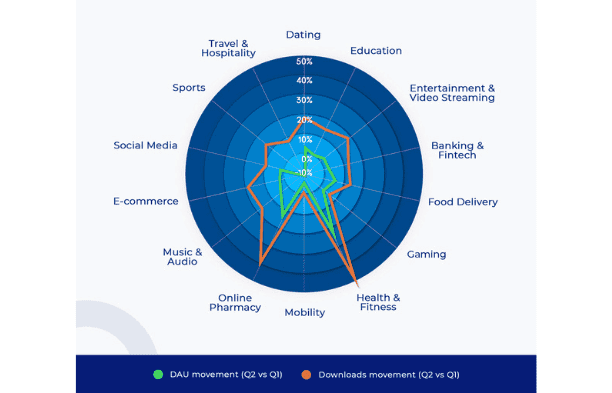
Only Mobility apps have seen a decrease in both downloads and DAU from Q1, 2020. Although Sports apps and Travel & Hospitality apps see a decrease in DAU, there is an increase in the number of downloads of these apps in the Americas.
Apart from Food Delivery, Mobility, and Sports apps, all other industry verticals have seen an increase in both downloads and DAU. In Europe, while the aforementioned industry verticals have seen a slight decrease in DAUs, the number of downloads has increased from Q1, 2020.
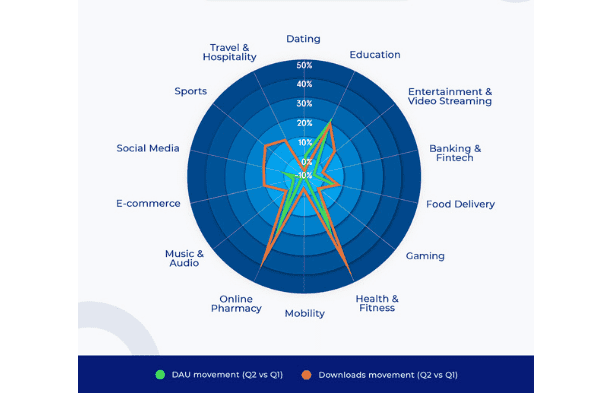
In the MENA region, the number of DAUs of Mobility, Sports, and Travel & Hospitality apps has decreased, while the number of downloads for apps in all the industry verticals has increased relative to Q1, 2020.
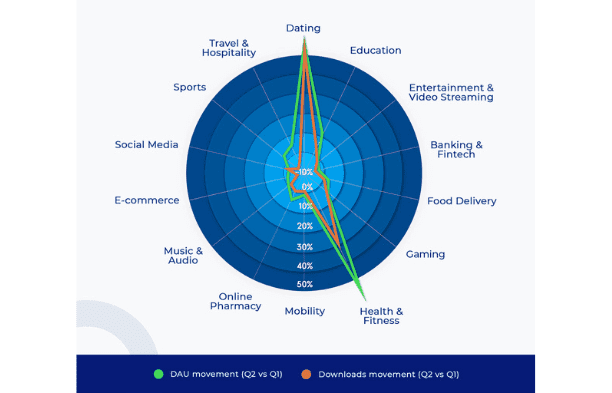
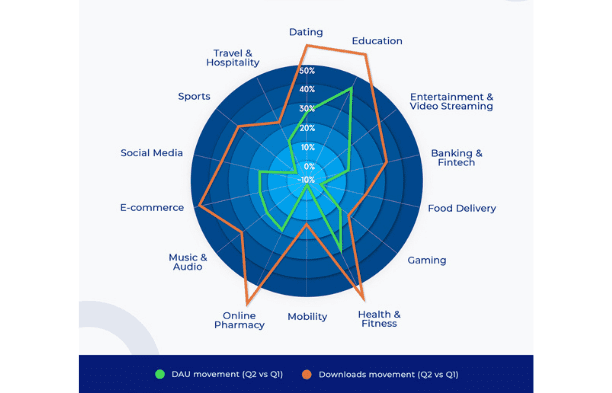
Entertainment & Video streaming, Banking & Fintech, and Online Shopping apps have seen a decrease in both new and active users from Q1, 2020, in India. On the other hand, India is responsible for driving the highest growth in Dating and Healthcare & Fitness apps.
In the SEA+ANZ region, only Mobility apps have seen a decrease in both downloads and DAU. While Online Shopping, Travel & Hospitality, Sports, and Music & Audio streaming apps see a decrease in DAUs, the number of downloads has increased from Q1, 2020.
Global Mobile Consumption Trends, 2020
Frequently Asked Questions
We’ve captured trends and insights of over 1.50 billion mobile app users from multiple industry verticals and sub-verticals (Entertainment and OTT Video streaming, Music and OTT Audio streaming, Gaming, Sports, Online Shopping, Grocery, Healthcare, Online Pharmacy, Fitness, Online Banking, Fintech, Edtech, Travel, Hospitality, Mobility, Social Media, and Food Delivery) across 5 regions for this report.
This report contains data about changes in mobile app downloads, daily active users, and the average session duration of apps in multiple industries. All data is relative to Q1 of 2020.
We have consumer trends from the Americas (AME), Europe (EU), the Middle East and North African region (MENA), India (IN), Southeast Asia (SEA), and the Pacific (ANZ).
Globally, Media & Entertainment apps have seen a 10.10% increase in new users and 5.52% more active users from Q1, 2020.
Online Shopping apps have seen a 15.09% increase in new users, while active users remain more or less the same (fall of 0.10%) versus Q1, 2020.
Online Banking and Fintech apps have seen an increase of 20.28% and 5.96% in new and active users respectively. All stats are relative to Q1, 2020.
Health & Fitness apps have seen the highest increase in both new and active users from Q1, 2020. There is a 42.88% increase in downloads and 18.70% increase in DAU.
While Travel & Hospitality apps have seen an increase of 17.25% in downloads, there is a 5.36% decrease in the number of DAUs versus Q1, 2020.


