


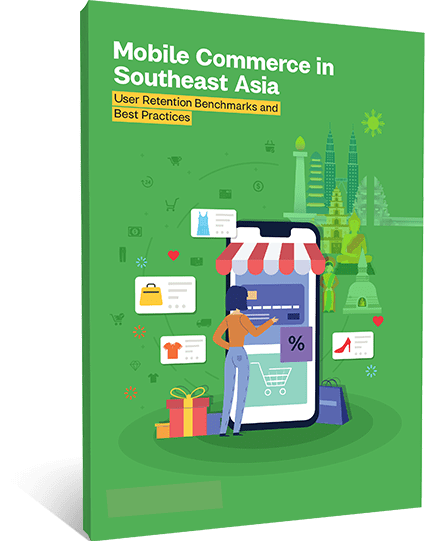
Mobile Commerce Trends in SEA: Retention Benchmarks
What's inside?
KEY FINDINGS
Uninstall trends for e-commerce apps in SEA and factors influencing these trends such as sessions, transactions, notifications, device type, user demographics, and more.
INSIGHTS
Actionable data-backed insights to optimize your app user engagement strategy.
BEST PRACTICES
Tips to translate these insights into real and measurable engagement campaigns.
Download Guidebook for Best Practices to Retain E-Commerce App Users
GET A FREE COPY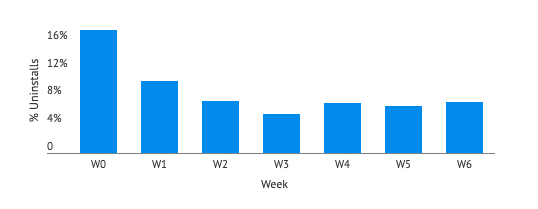
2 Weeks
Most users uninstall an app within the first two weeks of install.
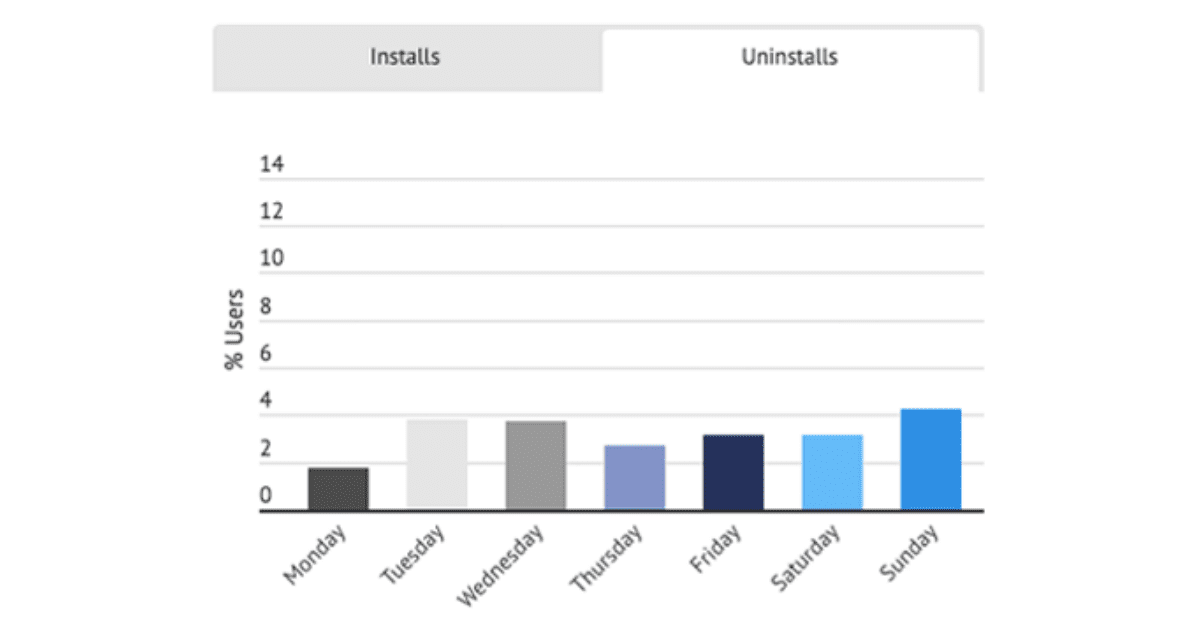
Sundays
The highest number of uninstalls takes place on Sundays.
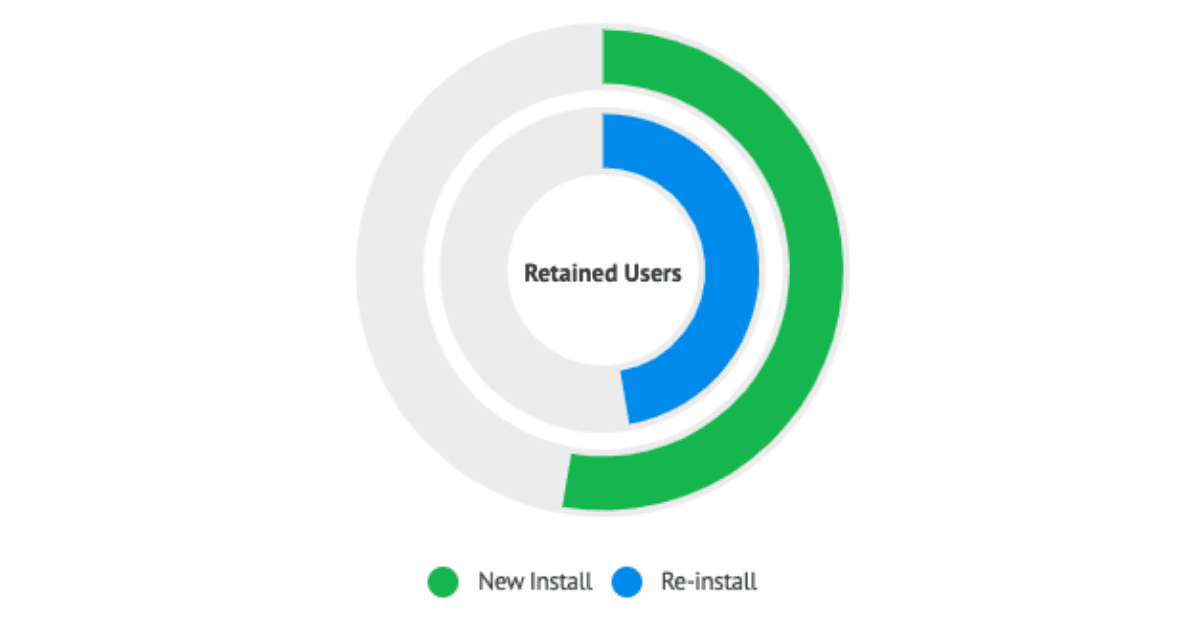
Retaining new users is easier
and economical when compared to re-installed users.
1 Transaction on D0
Users that perform at least one transaction on the day of app install are more likely to be retained.