


60+ Email Marketing Statistics & Trends You Need for 2025 [Original Research]
![60+ Email Marketing Statistics & Trends You Need for 2025 [Original Research]](https://www.moengage.com/wp-content/uploads/00-Header-Image-1200x628-1.png)
Think email is losing its edge? Think again.
Time and time again, email marketing defies predictions of decline, holding its place as the most relied-upon and effective marketing channel. In fact, over 82% of marketers use email, and 73% rank it as the #1 channel for driving results, according to The State of Cross-Channel Marketing 2025 Report. Even in today’s mobile-first world, email remains essential for digital communication. With global email users projected to reach 4.85 billion by 2027, it’s clear this channel isn’t going anywhere.
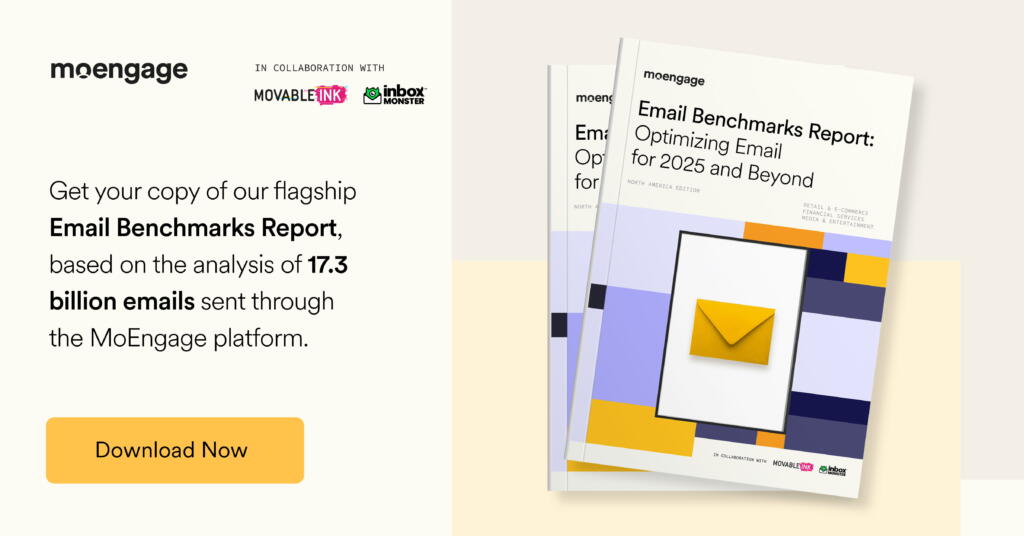
To help you navigate this ever-evolving channel, we’ve compiled email marketing statistics by industry based on the findings from Email Marketing Benchmarks Report 2025 and The State of Cross-channel Marketing 2025 Report.
From campaign performance benchmarks to emerging trends, these insights will empower you to create smarter, more impactful email strategies in 2025.
Now, let’s dive into the numbers shaping the future of email marketing!
60+ Email Marketing Statistics by Industry
Email marketing isn’t one-size-fits-all, and performance can vary dramatically by industry. In this blog, we uncover email marketing campaign statistics specific to Retail and Ecommerce, Banking and Financial Services, and Media and Entertainment. You’ll learn about key performance benchmarks, the best/worst days and months to send emails, trends for different types of emails, and actionable insights to fine-tune your email strategy for 2025 and beyond.
Retail & Ecommerce Industry
General Email Marketing Statistics
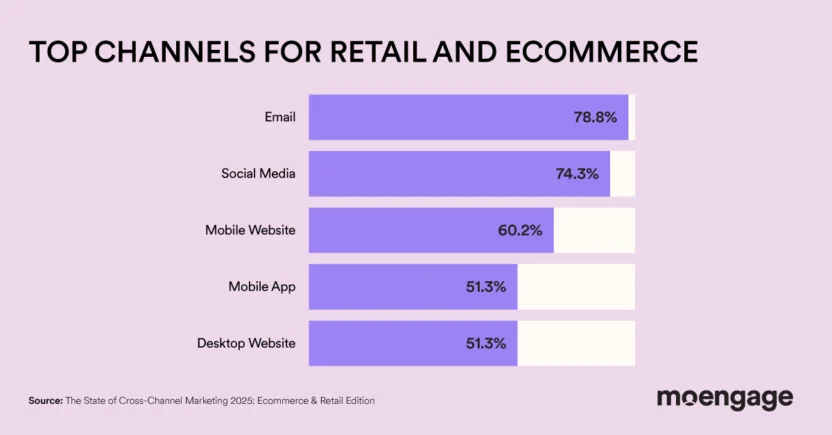
- 78.76% of Retail & Ecommerce marketers are using email as a marketing channel.
- 71.56% of Retail & Ecommerce marketers consider email to be the most effective marketing channel.
- 58.85% of Retail & Ecommerce marketers use AI for optimizing emails for email subject lines and other content based on customer behavior.
General Email Marketing Benchmarks
- The average email open rate for the Retail & Ecommerce industry is 32.59%.
- The average email CTOR for the Retail & Ecommerce industry is 13.57%.
- The average email conversion rate for the Retail & Ecommerce industry is 2.68%.
- The average email unsubscribe rate for the Retail & Ecommerce industry is 0.25%.
- The email deliverability benchmark for the Retail & Ecommerce industry is 98.03%.
General Email Marketing Trends
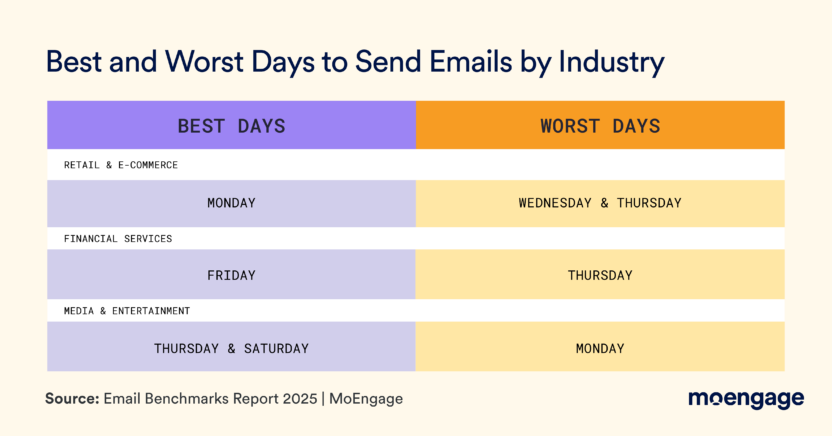
- The best day for Retail & Ecommerce brands to send emails to their customers, based on conversion rates is Monday.
- The worst days for Retail & Ecommerce brands to send emails to their customers, based on conversion rates are Wednesday & Thursday.
- The best month for Retail & Ecommerce brands to send emails to their customers, based on conversion rates is March.
- The worst month for Retail & Ecommerce brands to send emails to their customers, based on conversion rates is April.
Email Marketing Statistics for Broadcast Emails
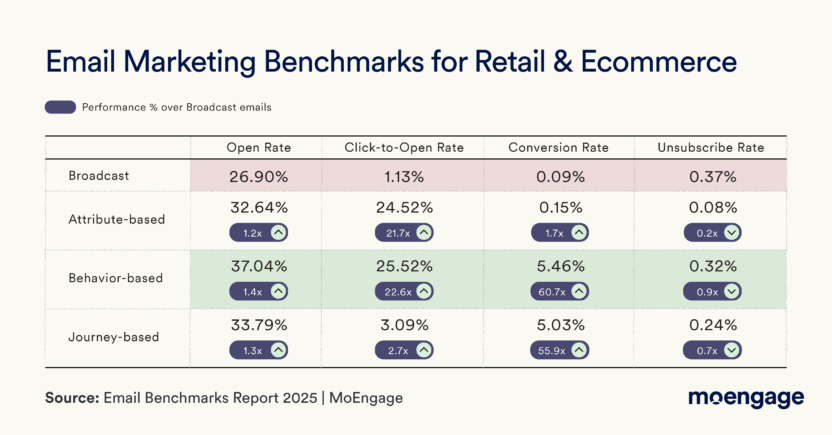
- Broadcast emails have the lowest performance in terms of open rates (26.90%), CTORs (1.13%), conversion rates (0.09%), and unsubscribe rates (0.37%) for Retail & Ecommerce brands.
- YOY open rates for broadcast emails have dropped from 30.58% to 26.90%.
- YOY conversion rates for broadcast emails have dropped from 0.18% to 0.09%.
Email Marketing Statistics for Behavior-based Emails vs. Broadcast Emails
- Customers are 22.6x more likely to click on emails from Retail & E-commerce brands that are personalized based on their behavior (as compared to broadcast emails).
- Customers are 60.7x more likely to convert through emails from Retail & E-commerce brands that are personalized based on their behavior (as compared to broadcast emails).
- Customers are 0.9x less likely to unsubscribe from emails from Retail & E-commerce brands that are personalized based on their behavior (as compared to broadcast emails).
Email Marketing Statistics for Journey-based Emails vs. Broadcast Emails
- Customers are 2.7x more likely to click on emails from Retail & E-commerce brands that are personalized based on their journey stage (as compared to broadcast emails).
- Customers are 55.9x more likely to convert through emails from Retail & E-commerce brands that are personalized based on their journey stage (as compared to broadcast emails).
- Customers are 0.7x less likely to unsubscribe from emails from Retail & E-commerce brands that are personalized based on their journey stage (as compared to broadcast emails).
Banking & Financial Services Industry
General Email Marketing Statistics
- 81.05% of Financial Services marketers are using email as a marketing channel.
- 75.17% of Financial Services marketers consider email to be the most effective marketing channel.
- 55.56% of Financial Services marketers use AI for optimizing emails for email subject lines and other content based on customer behavior.
General Email Marketing Benchmarks
- The average email open rate for the Banking & Financial Services industry is 27.42%.
- The average email CTOR for the Banking & Financial Services industry is 13.43%.
- The average email conversion rate for the Banking & Financial Services industry is 21.26%.
- The average email unsubscribe rate for the Banking & Financial Services industry is 0.23%.
- The email deliverability benchmark for the Banking & Financial Services industry is 98.37%.
General Email Marketing Trends
- The best day for Banking & Financial Services to send emails to their customers, based on conversion rates is Friday.
- The worst days for Banking & Financial Services to send emails to their customers, based on conversion rates is Thursday.
- The best month for Banking & Financial Services to send emails to their customers, based on conversion rates is April.
- The worst month for Banking & Financial Services to send emails to their customers, based on conversion rates is February.
Email Marketing Statistics for Broadcast Emails
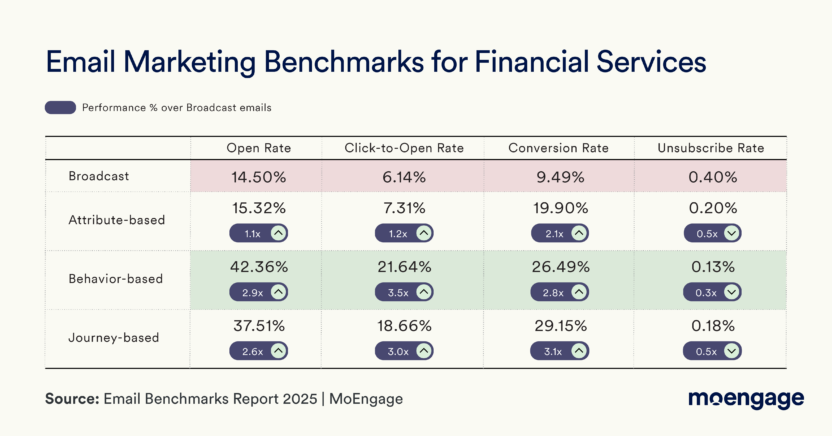
- Broadcast emails have the lowest performance in terms of open rates (14.50%), CTORs (6.14%), conversion rates (9.49%), and unsubscribe rates (0.40%), for Banking & Financial Services brands.
- YOY open rates for broadcast emails in the BFSI industry have dropped from 25.04% to 14.50%.
- YOY unsubscribe rates for broadcast emails have increased from 0.27% to 0.40%.
Email Marketing Statistics for Behavior-based Emails vs. Broadcast Emails
- Customers are 3.5x more likely to click on emails from Financial Services that are personalized based on their behavior (as compared to broadcast emails).
- Customers are 2.8x more likely to convert through emails from Financial Services that are personalized based on their behavior (as compared to broadcast emails).
- Customers are 0.3x less likely to unsubscribe from emails sent by BFSI brands that are personalized based on their behavior (as compared to broadcast emails).
Email Marketing Statistics for Journey-based Emails vs. Broadcast Emails
- Customers are 3x more likely to click on emails from Financial Services that are personalized based on their journey stage (as compared to broadcast emails).
- Customers are 3.1x more likely to convert through emails from Financial Services that are personalized based on their journey stage (as compared to broadcast emails).
- Customers are 0.5x less likely to unsubscribe from emails sent by BFSI brands that are personalized based on their journey stage (as compared to broadcast emails).
Media & Entertainment Industry
General Email Marketing Statistics
- 73.74% of Media & Entertainment marketers are using email as a marketing channel.
- 67.71% of Media & Entertainment marketers consider email to be the most effective marketing channel.
- 52.53% of Media & Entertainment marketers use AI for optimizing emails for email subject lines and other content based on customer behavior.
General Email Marketing Benchmarks
- The average email open rate for the Media & Entertainment industry is 25.78%.
- The average email CTOR for the Media & Entertainment industry is 15.25%.
- The average email conversion rate for the Media & Entertainment industry is 12.18%.
- The average email unsubscribe rate for the Media & Entertainment industry is 1.98%.
- The email deliverability benchmark for the Media & Entertainment industry is 99.59%.
General Email Marketing Trends
- The best days for Media & Entertainment brands to send emails to their customers, based on conversion rates are Thursday & Saturday.
- The worst days for Media & Entertainment brands to send emails to their customers, based on conversion rates is Monday.
- The best month for Media & Entertainment brands to send emails to their customers, based on conversion rates is November.
- The worst month for Media & Entertainment brands to send emails to their customers, based on conversion rates is July.
Email Marketing Statistics for Broadcast Emails
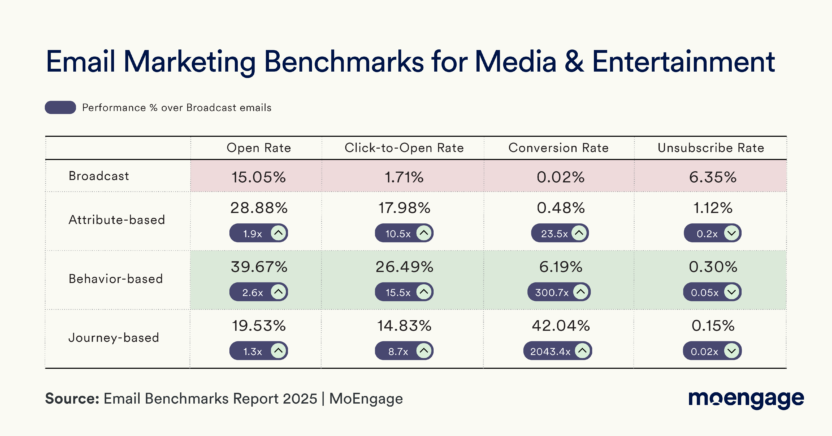
- Broadcast emails have the lowest performance in terms of open rates (15.05%), CTORs (1.71%), conversion rates (0.02%), and unsubscribe rates (6.35%) for Media & Entertainment brands.
- YOY conversion rates for broadcast emails have dropped from 1.85% to 0.02%.
- YOY unsubscribe rates for broadcast emails have increased from 0.56% to 6.35%.
Email Marketing Statistics for Behavior-based Emails vs. Broadcast Emails
- Customers are 15.5x more likely to click on emails from Media & Entertainment brands that are personalized based on their behavior (as compared to broadcast emails).
- Customers are 300.7x more likely to convert through emails from Media & Entertainment brands that are personalized based on their behavior (as compared to broadcast emails).
- Customers are 0.05x more likely to unsubscribe from emails from Media & Entertainment brands that are personalized based on their behavior (as compared to broadcast emails).
Email Marketing Statistics for Journey-based Emails vs. Broadcast Emails
- Customers are 8.7x more likely to click on emails from Media & Entertainment brands that are personalized based on their journey (as compared to broadcast emails).
- Customers are 2043.4x more likely to convert through emails from Media & Entertainment brands that are personalized based on their journey (as compared to broadcast emails).
- Customers are 0.02x more likely to unsubscribe from emails sent by Media & Entertainment brands that are personalized based on their journey (as compared to broadcast emails).
Leverage Email Marketing Statistics to Drive Success in 2025
These email marketing statistics and benchmarks by industry are just the tip of the iceberg when it comes to optimizing campaigns. For a deeper dive into email marketing, along with pro tips from industry practitioners, check out our Email Benchmarks Report 2025—the ultimate guide to email marketing success!


