


Customer Engagement Metrics & KPIs to Track in 2026
Brands live and die by their ability to engage customers. If your customers aren’t interacting with your product or service, you won’t be driving interest, adoption, or conversions, let alone deep brand loyalty that lasts.
To get — and keep — customers invested, brands need to develop dynamic, inspiring experiences for their customers. For brands to make informed, data-driven decisions about the customer experiences they build, the journeys they orchestrate, and the campaigns they create, they need to be making them based on insights about how customers actually interact and engage with their products and services.
One of the biggest challenges in achieving this is determining how to quantify customer engagement with your brand. The fact is that engagement looks different in different industries, for different service types, and for individual companies. It’s often challenging to know what good or bad performance looks like, and it’s even more challenging to decipher which metrics are most important for understanding customer behavior.
Luckily, we’ve compiled a list of the top twenty customer engagement metrics for brands of any industry. We cover what each metric is and explain how brands can use each metric to measure customer engagement. We also identify which stage in the customer journey each metric is most useful for analyzing. This way, you should be able to find out which metrics are most impactful for your organization.
We also interview leading industry experts about how they use customer engagement metrics to maximize impact with their audience. With real-life insights, you can learn how to actually use the metrics in a practical way.
Let’s start with what customer engagement metrics are and why they are so important for brands looking to understand customer activity and improve customer experiences.

What Are Customer Engagement Metrics?
Customer engagement metrics are units of measurement that help brands quantify, analyze, and understand customer engagement with their brand and its products and services. These include various KPIs that look at how customers interact, communicate, and connect with a brand over time.
Customer engagement analysis is the process of using these KPIs to study customer engagement with a brand. Brands then leverage this information to optimize and improve their customer experience and marketing campaigns.
5 Benefits of Measuring Customer Engagement
For brands to connect with their customers successfully, they need to understand what customers do (and don’t) like about their brand experience.
Below, we examine the essential benefits customer engagement metrics provide companies seeking to engage their customers at scale.
- Make data-driven decisions: Measuring customer engagement allows you to quantify engagement in a meaningful, actionable way and ensures your future decisions are data-driven.
- Understand customer behavior: Detailed analytics about where, when, and how customers engage with your brand allow you to deeply understand customer activity, behavior, and buyer intent.
- Increase customer engagement: Having meaningful, actionable insights about customer engagement empowers you to optimize your experiences and campaigns to maximize engagement, helping you increase conversions, retention, and brand loyalty.
- Build customer-centric experiences: When all of your customer experiences are developed based on customer engagement data, you naturally build experiences that are centered around what they want.
- Set realistic, achievable goals: With a solid means of tracking engagement and clearly defined benchmarks for measuring success, brands can develop achievable (yet challenging and motivating) goals that drive their brand forward.
Ultimately, measuring customer engagement enables brands to quantify customer engagement. This allows them to analyze engagement meaningfully and develop actionable steps to improve the overall experience and increase both satisfaction and engagement.
20 Key Customer Engagement Metrics & KPIs to Measure
Measuring customer engagement is objectively challenging because it spans the entire customer lifecycle. To understand it, brands examine a broad span of time and numerous customer interactions, attempting to attribute meaning to each one.
The difficulty lies in the fact that with so many different customer engagement metrics available, it’s hard to know which one to apply at a specific time or in a certain circumstance. Which metrics are best for analyzing engagement in the awareness stage versus the retention stage?
Are the metrics providing information on the quantity or quality of the engagement? Beyond that, you also need to consider which metrics provide the best signals of engagement for your brand and your particular use case.
Below, we look at some of the most important metrics for measuring, quantifying, and qualifying customer engagement. To help brands use these key performance indicators (KPIs) effectively, we not only explain what each metric is and how to calculate it; we also indicate which stage of the customer journey it’s most useful for measuring engagement and explore how brands can use this metric to understand—and improve—customer interactions.
1. Views
Customer Journey Stage(s): Awareness
Views are simply the total number of views a website, advertisement, or marketing message gets.
These are commonly simply called views in social media and digital advertising in general; they are often referred to as page views for websites.
It’s calculated by simply counting the number of total views an advertisement or message receives.
Views, or page views, are one of the most basic customer engagement metrics. It’s particularly significant for analyzing the earliest stage of the customer journey — awareness. It’s a solid indicator of how much reach and exposure your campaigns are getting.
While views certainly don’t paint a complete picture of engagement, they are useful for calculating other important metrics and are vital for comparing a number of other metrics in order to fully understand the relationship between engagement and exposure.
2. Bounce Rate
Customer Journey Stage(s): Awareness
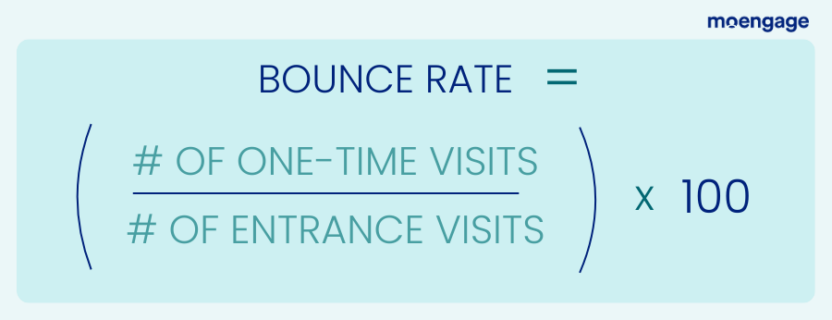
The bounce rate is the percentage of visitors who land on a webpage for the first time and leave without taking any further action, such as clicking a link or visiting a second page on the site. It is an important on-page engagement metric for a brand’s desktop and mobile websites.
It’s calculated by dividing the number of single one-page visits by the total number of first-time visitors (or entrance visits).
The bounce rate is often confused with the exit rate, which measures the rate at which visitors exit a page. However, the exit rate does not strictly measure single-page visits and could come at the end of a sequence of page views or other on-page actions. Instead, the bounce rate only measures visitors who leave after a single page view.
This makes the bounce rate a significant indicator of poor early-stage customer engagement. Typically, a high bounce rate means most visitors are leaving with a negative first impression of your brand.
3. Social Media Impressions
Customer Journey Stage(s): Awareness
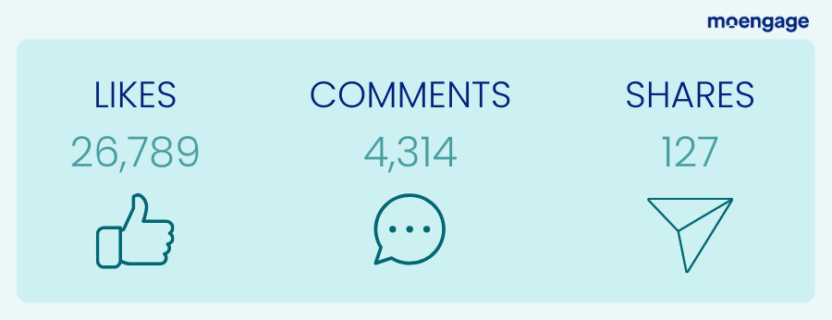
Impressions are used to measure social media engagement from customers and followers and include different types of quantifiable interactions such as likes, comments, shares, and more.
These values are simply calculated by totaling the number of interactions of a specific type.
Social media impressions are extremely valuable, as they are quantifiable metrics that allow brands to measure early-stage visibility and engagement. These values provide significant insights into the success of lead generation and early customer acquisition efforts and can be used to analyze the performance of the awareness stage of the customer journey.
That being said, social media can also be used as a tool for fostering long-term retention, encouraging consistent engagement, community-building, and brand loyalty. It can also provide further insights when brands begin to analyze which impressions actually lead to click-throughs and result in conversions (versus those that lead to churn).
Brands can even find creative ways of using impressions to properly value their impact on engagement. For example, since shares show a deeper level of brand advocacy, companies could weigh these higher to attempt to quantify the value of these impressions beyond their total values.
4. Average Time on Page
Customer Journey Stage(s): Consideration
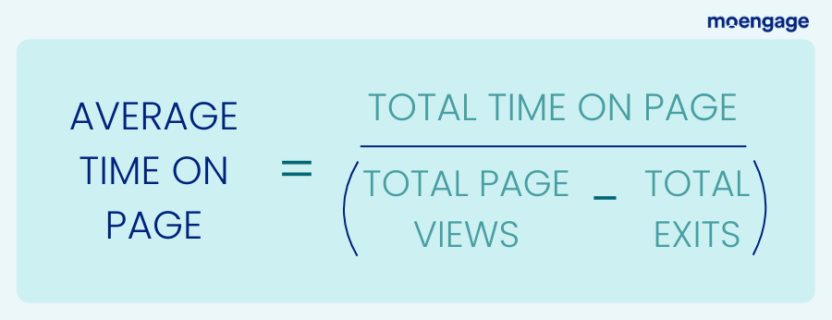
Average time on page is a metric that measures the amount of time the average customer spends on an individual webpage. It’s important to note that time on a page does not factor in exit pages.
Time on the page itself is tracked from the moment a customer lands on a page to the point that they click a link to proceed to the next page. The average time on the page is calculated by dividing the total time spent on the page by the total number of views (minus the total exits).
Brands can look at the average time on page across the entire site, for specific groups of pages (product pages, landing pages, etc.), or for individual pages, enabling them to drill down deeper to understand customer engagement across the website.
Because of this, time on the page is an extremely valuable customer engagement metric. However, while it indicates customer engagement, time on the page isn’t always a positive engagement signal in all contexts. For example, an E-commerce site may spend a lot of time on page for their product pages.
This is certainly a positive, as customers are seriously considering their product as an option. However, there are situations where lengthy time on page metrics could be a sign of an issue, like friction in the customer journey.
For brands to truly understand the engagement they’re seeing, they’ll need to analyze time on the page alongside a number of other key customer engagement metrics, particularly average session duration and bounce rate.
5. Average Session Duration
Customer Journey Stage(s): Consideration
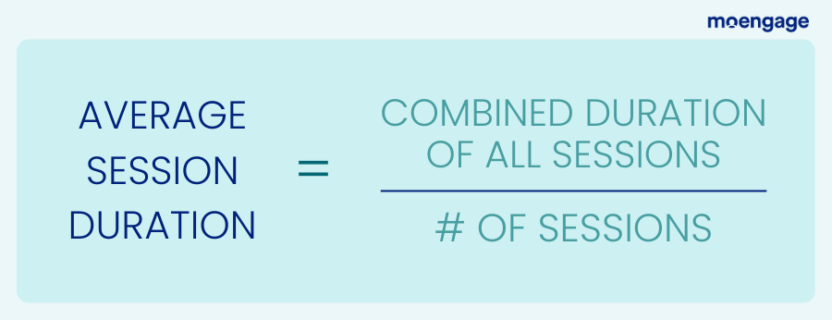
Average session duration measures the average length of time a customer spends on a website during a single visit. A session begins when a customer visits the website for the first time and ends when they click an exit page.
While time on page measures the time a customer spends on a particular webpage, average session duration measures the amount of time they spend on all pages within a single session.
It’s calculated by dividing the total duration of all sessions by the total number of sessions.
Average session duration is a critical metric used in web analytics to understand customer engagement. After all, it directly measures how long customers engage with a website. Not only that, but it actually empowers brands to analyze where and how customers are spending their time on your website. This can be used to identify which pages are performing best and which ones are underperforming so you can double down or make improvements.
Average session duration is particularly useful for analyzing early-stage engagement during the awareness and consideration stages of the customer journey.
Naturally, longer session durations indicate more engagement, which is almost always a positive sign. This shows customers are spending more time considering your product, which increases the chances of a conversion. For this reason, longer average session durations are often seen as a signal of higher customer intent.
As with other metrics, looking exclusively at average session duration can paint a skewed picture of customer engagement on your site. For this reason, average session duration is often analyzed alongside other related metrics, most notably bounce rate.
A high bounce rate can have a strong negative impact on session duration, as sessions with high bounce rates are very short.
A high average session duration isn’t exclusively a positive metric, though. For example, a long average session duration on a checkout page can indicate issues with the checkout process or purchase journey.
Similarly, a long average session duration on a customer support page that’s meant to help customers quickly and conveniently solve customer issues could be a sign customers aren’t getting the answers they need (or at least not fast enough).
Always remember that the average session duration can mean different things in different contexts and can signal both positive and negative customer engagement issues. When used properly, it’s a crucial metric that provides direct insight into customer activity and engagement on your website and allows you to measure engagement in the awareness and consideration stages of the customer journey.
6. Pages Per Session
Customer Journey Stage(s): Consideration
Pages per session is the average number of web pages a visitor accesses per session. This includes all pages that are visited, not only unique pages. Even if someone revisits a page they’ve already visited in the session, that page would still count towards this total.
It’s calculated by dividing the total number of page views by the total number of sessions.
The number of pages a visitor sees per session indicates the level of customer engagement across your website and can be a positive or negative signal in different contexts. It helps brands understand how easy their website is to navigate, how compelling their content is, and whether or not customers are interested in what you have to offer.
Average session duration and average time on the page show how long customers spend engaging with your brand, whereas pages per session provide insights into the depth of this engagement.
It provides insights into whether or not customers progressed to other pages, which is a sign of general satisfaction, interest, and, potentially, buying intent. Put simply, it helps speak to the value (rather than volume) of the engagement you’re getting across your website.
After all, a customer who explores 2 blogs, 3 product pages, and 7 testimonials likely has higher buyer intent than a customer who spends more time on-site but only views 2 blogs and your ‘About Us’ page.
For this reason, pages per session have relatively little meaning when analyzed alone; instead, it’s often used alongside average session duration, average time on page, and even bounce rates to paint a comprehensive picture of customer engagement. It’s critical to use these customer engagement metrics together to fully understand website engagement.
7. Delivery Rate
Customer Journey Stage(s): Awareness
The delivery rate is the percentage of messages that are successfully delivered to recipients.
It’s calculated by dividing the number of messages delivered by the total number of messages that were sent.
In general, message deliverability measures the reach of your campaigns, or at least their potential reach. It represents the exposure your messages get. Delivery rates are most commonly associated with email marketing, but they apply just as well to SMS and mobile push marketing.
While the delivery rate has limited value on its own, it’s frequently used in conjunction with other metrics from the awareness stage — particularly the open rate and click-through rate — to understand and analyze early-stage customer engagement and journey progress.
8. Open Rate
Customer Journey Stage(s): Awareness / Consideration
The open rate is the percentage of customers that open an email, SMS, or mobile push notification that they’ve received.
It’s calculated by dividing the number of messages opened by the number of messages delivered.
The open rate is another metric that measures the reach, effectiveness, and relevance of your campaigns. Since customers have to take action to open the email, SMS, or mobile push they received, it’s one of the first real instances of engagement and represents your ability to capture customer attention.
However, this is still in the early stages of the customer journey, and there is no guarantee that the customer will complete a conversion or become a brand advocate.
In particular, the open rate measures how impactful your email subject lines, mobile push taglines, and rich media content is at enticing customers to interact with your marketing messages in the first place.
9. Click-Through Rate (CTR)
Customer Journey Stage(s): Awareness / Consideration
The click-through rate (CTR) is the percentage of customers that click an email, mobile push notification, SMS message, or digital advertisement that they’ve opened or viewed.
It’s calculated by dividing the number of clicks by the total number of opens or views.
The CTR is an early — but extremely significant — marker of engagement and a common measure of how successful your marketing campaigns are at generating leads.
While delivery and views really only mark the reach of your campaigns, the first click marks the first high-intent action you elicited from your customers.
In general, the click-through rate represents how effective a particular ad or message is at capturing customer attention and — arguably more importantly — getting customers to act on that attention.
It’s therefore frequently used to measure the success of marketing campaigns, particularly in terms of their ability to engage customers early in the customer journey and nudge customers towards product adoption and conversions.
10. Conversion Rate
Customer Journey Stage(s): Decision
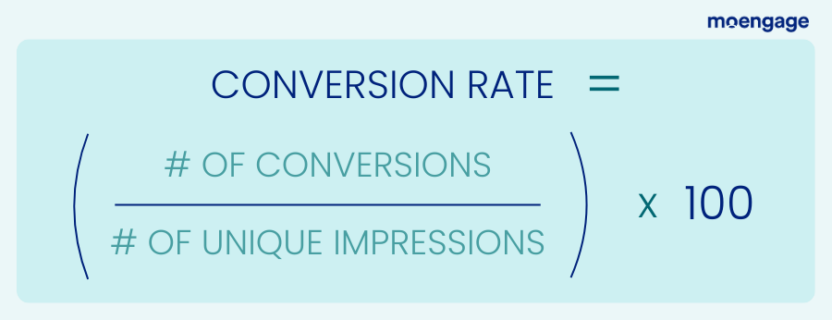
The conversion rate is the rate at which customers complete a conversion event. Typically, the conversion rate measures purchases, but it can also be used to measure other conversion events, such as subscription renewals, newsletter opt-ins, or account registrations.
The conversion rate is calculated by dividing the number of customers who completed a conversion event by the number of unique impressions.
Digital conversions could include a customer who visited a website, viewed an advertisement, or received an email, whereas physical conversions could include customers who visit a store, receive a paper ad, or see a billboard.
The conversion rate is a valuable KPI that brands use for various purposes, including understanding overall sales performance, analyzing the purchase funnel in detail, and isolating pain points in the checkout process.
However, it’s also particularly useful from a customer engagement perspective. First and foremost, customers who complete a conversion have certainly engaged with a brand to some degree, no matter how streamlined the purchase journey was.
More than that, though, comparing the conversion rate to other customer engagement metrics provides brands with deeper insight into engagement behavior.
By comparing the conversion rate to initial page visits and social media impressions, brands can see how many visitors become customers. By comparing the conversion rate to average order value (AOV) and customer lifetime value (CLV), they begin to understand what’s driving revenue the most.
Overall, the conversion rate is one of the most important metrics for understanding the success of your engagement initiatives. While it has limited value in assessing the actual quantity of engagement your brand is receiving, it’s critical for understanding the direct impact that engagement has on generating revenue.
11. Customer Retention Rate
Customer Journey Stage(s): Retention
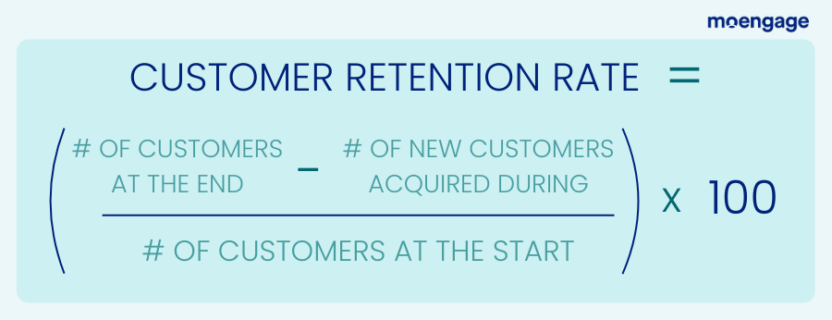
The customer retention rate is the percentage of customers a brand retains over a given period of time. It’s a critical metric for brands looking to understand how well their campaigns, customer journeys, and brand experiences are at keeping customers.
The customer retention rate is calculated by dividing the number of customers at the end of a time period by the number of customers at the beginning of the period, excluding the number of new customers acquired during that same period.
Plain and simple, customers who stick around continue to engage with your brand. For this reason, the customer retention rate is a common signal of a brand’s sustainability, growth, and overall success. It’s also often considered an early indicator of brand loyalty and future advocacy and typically leads to increased repeat purchases and customer lifetime value (CLV).
Although not a great way of measuring the quality or impact of engagement, the customer retention rate does indicate the percentage of customers who regularly engage with your brand. It’s good practice to track your customer retention rate consistently over time.
Still, it’s also valuable to compare the retention rate based on customer acquisition channels and journeys to see which ones develop customers with greater engagement and retention rates.
12. Churn Rate
Customer Journey Stage(s): Decision / Retention
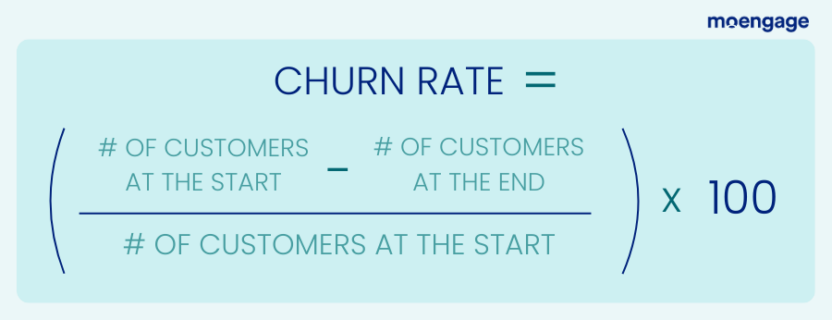
The churn rate is the number of customers who stop using your products or services in a given time period. The inverse of the customer retention rate, the churn rate, is a strong indicator of poor or inadequate customer engagement and signals where customers are dropping off in the customer journey.
The churn rate is calculated by dividing the number of customers who left in a specified period by the sum of the customers at the beginning of the period and new customers gained in that same period.
The churn rate is an extremely useful customer engagement metric. It allows brands to measure customers who stop engaging with their brand, products, or services over a specific period of time.
Brands can measure churn in various ways, such as the number of customers who delete, uninstall, or simply stop using their services consistently.
Brands have complete control over the period they analyze; while brands typically look at a week, a month, or a year, brands can track any period of time, from hours to decades. This empowers brands to analyze not only overall customer engagement but also churn during specific seasons or for particular campaigns.
With this information, brands can better understand where customers leave customer journeys to isolate the performance of individual campaigns, channels, and messaging.
Because churn rate directly tracks lost customers, it’s often seen as a strong indication that your customer engagement strategies and efforts are underperforming.
It’s most commonly used to identify where retention and engagement efforts need improvement. Modern Customer Engagement Platforms (CEP) help marketers predict churn before it happens so they can correct it in a timely manner and keep customers on track.
13. Active Users
Customer Journey Stage(s): Retention
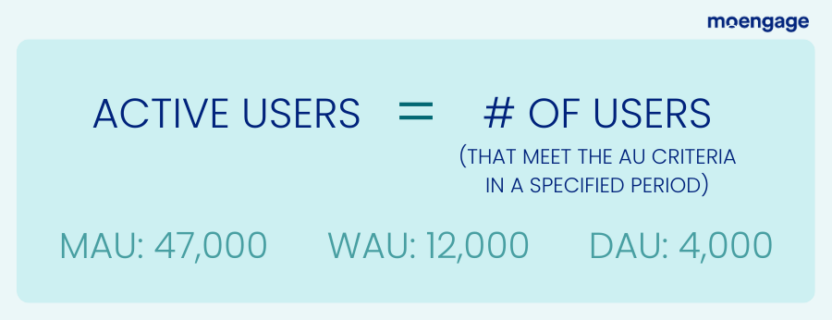
Active users is a metric that measures the number of customers that use a brand’s app, platform, or service within a specific period of time.
It’s calculated by simply totaling the number of customers that access a service within a specific time frame. Some brands choose to be more strict, setting refined parameters for what qualifies as an active user.
Theoretically, this can be measured using any period of time. However, brands commonly use one of the following two metrics when measuring active users: daily active users (DAU) or monthly active users (MAU). Some brands also measure weekly active users (WAU).
While Active Users refer simply to the actual count of monthly or daily active users, this raw data also enables brands to calculate averages and active user rates. For example, brands can average the MAU across a year (or multiple years), helping them both analyze past behavior and anticipate future usage.
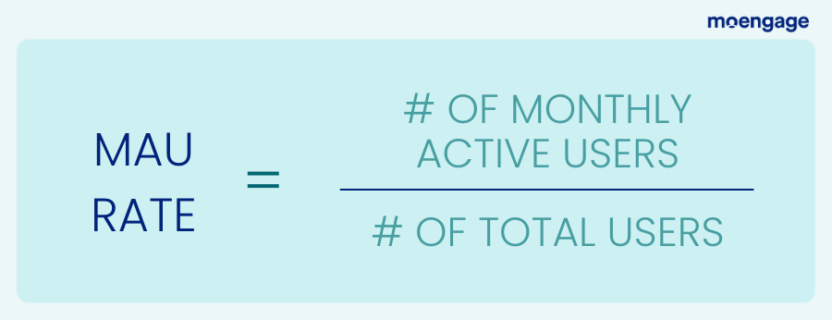
Brands can also determine the percent of customers that are DAU, MAU, or WAU.
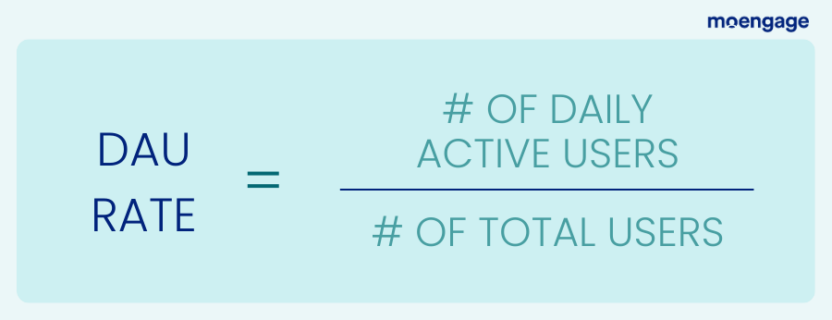
The active user rate helps brands understand the percentage of customers who consistently engage with their brand. This can be used to identify gaps in user engagement and determine how to increase retention.
Overall, active user metrics enable brands to calculate the frequency with which customers are actively engaging with your brand and its products or services.
14. Stickiness
Customer Journey Stage(s): Retention
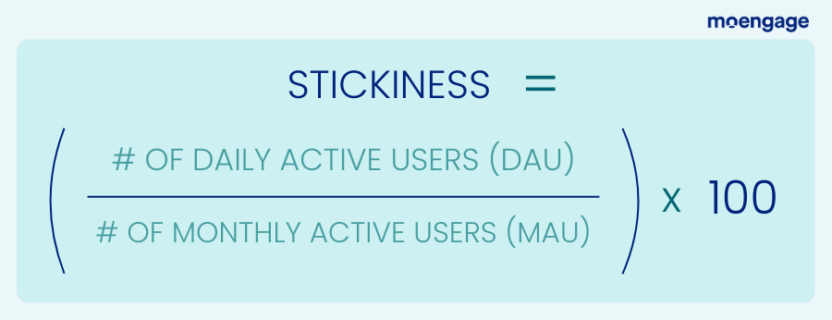
Stickiness is a customer engagement metric that allows brands to measure traction and retention by determining the ratio of customers that engage with your service more consistently.
It’s calculated by dividing the active users from a specified period of time to active users from another (longer) specified period of time, and results in the ratio of customers that engage more consistently.
While brands can theoretically use any parameters, they typically calculate stickiness using Daily Active Users (DAU), Monthly Active Users (MAU), or Weekly Active Users (WAU).
The most common method is to divide Daily Active Users (DAU) by Monthly Active Users (MAU).
Stickiness is commonly used for measuring app engagement, but it can be used to measure service usage in general. Brands simply need to define the parameters that qualify an active user each day.
For some brands, that may mean simply accessing the app, while for others, it may mean watching a video, playing a game, or completing some other type of action (or even a specific series of actions).
Stickiness is a strong signal of whether a brand is driving more consistent engagement and traction from its customers since it actually indicates the ratio of active customers.
Therefore, a rise in stickiness would mean more customers are engaging more regularly, while a decrease would mean that customer engagement is dwindling.
In particular, brands use stickiness to understand customer engagement and retention, as it reflects a brand’s ability to drive more consistent, frequent engagement from its existing customers.
15. Feature Adoption Rate
Customer Journey Stage(s): Retention
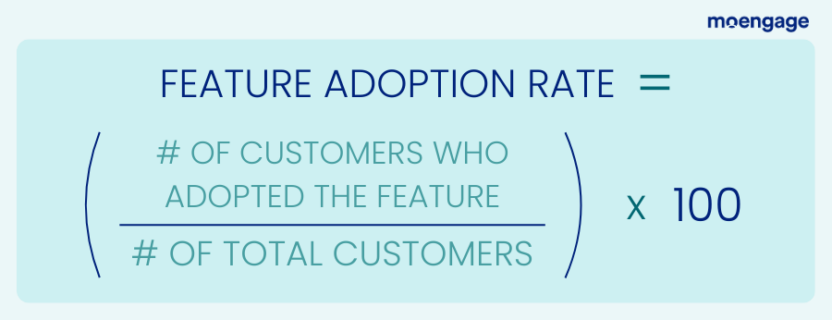
The feature adoption rate measures the percentage of customers that use a specific feature of your product or service at least once. It allows brands to quantify feature adoption to understand how many customers engage with new features.
It’s calculated by dividing the number of customers who use a feature at least once by the total number of customers.
Feature adoption rates give brands direct insights into which features are seeing the most engagement.
In general, this helps brands identify their priority features so they can properly allocate their attention and focus. With this information, companies can better manage product development initiatives, engineering support, and budget planning.
In the most basic sense, this helps brands uncover which features are irrelevant (and may need to be sunsetted) versus those that are impactful (and may need to be improved).
This also provides insight into which customer cohorts or segments are most likely to use certain features, and it can help brands develop a roll-out strategy that increases feature adoption rates. If a brand finds that a certain feature is only used by long-time customers, they can avoid nudging new customers towards that feature and instead focus on promoting it to active, repeat customers for greater impact.
16. Customer Lifetime Value (CLV)
Customer Journey Stage(s): Decision / Retention
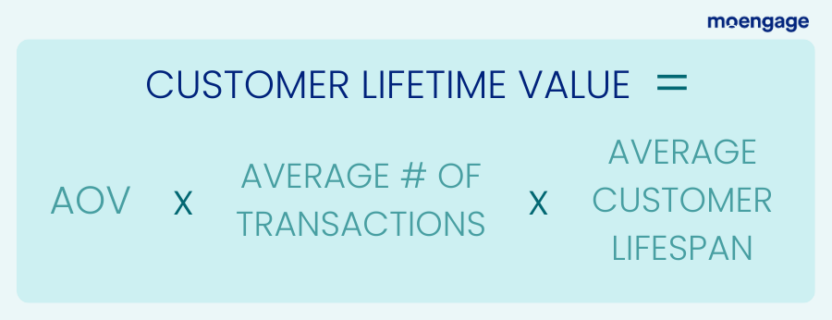
Customer lifetime value (CLV), sometimes stylized as customer LTV, is the average value a customer will generate for your brand over the course of their lifetime as a customer. Essentially, it represents what each customer is worth to you.
It’s calculated by multiplying the average order value by the average number of transactions (per year) by the average customer lifespan (in years).
Unlike click-through, conversion, and churn rates, the customer lifetime value doesn’t actually allow brands to measure the quantity of customer engagement. That is, it doesn’t measure individual actions with your brand. However, CLV is incredibly useful for measuring the quality of customer engagement.
Since a rising CLV means customers are either converting more frequently or increasing their order values, a rising CLV means an increase in the volume or value of conversion. At the same time, it signals an increase in the volume or value of your customer engagement.
This makes CLV an extremely strong signal of the value of your engagement and allows you to track how this changes over time.
When using the CLV to analyze customer engagement, brands should never take it at face value. Instead, brands need to look at where this increase is coming from.
If it’s an increase in volumes, it means a significant increase in engagement as more customers are converting. However, if the lift is more associated with higher order values, it’s less indicative of a spike in engagement and instead a reflection of engagement value.
17. Customer Satisfaction Score (CSAT)
Customer Journey Stage(s): Retention / Advocacy
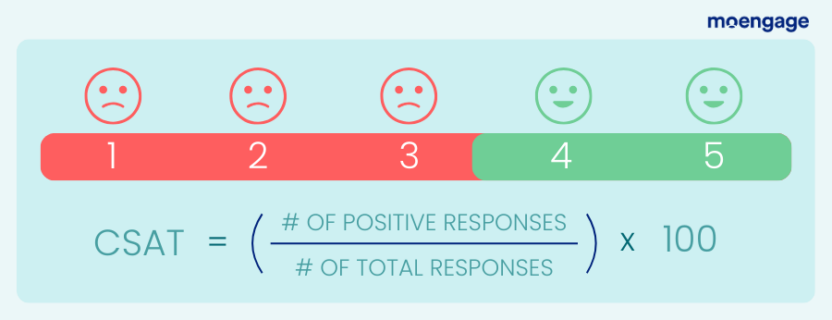
The Customer Satisfaction Score (CSAT) is a score used to quantify customer satisfaction with a brand and its products or services. It’s determined using survey results, where customers are asked to rate their satisfaction on a sliding numerical scale (typically from 1 – 5, 1 – 7, or 1 – 10).
The CSAT score is then calculated by dividing the sum of all positive responses by the total number of responses.
Obviously, the CSAT score is used mostly to determine customer satisfaction, whether that’s their general perception of a brand or more focused feedback on a specific product, feature, or campaign.
However, the CSAT score can be applied to almost any scenario, including customer engagement. Brands can ask their customers about their satisfaction with a particular marketing campaign, the channel they’re receiving communications on, and so much more.
Brands can use these scores to quantify customer satisfaction with particular customer journeys and experiences, allowing them to hone in on what is (and isn’t) working.
18. Customer Effort Score (CES)
Customer Journey Stage(s): Retention / Advocacy
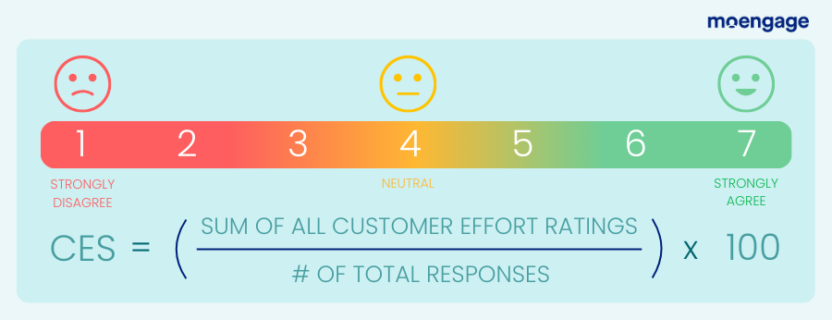
The Customer Effort Score (CES) quantifies how easy it is for customers to interact with a brand and its products and services.
It’s determined using survey results, where customers are asked to rate how much effort was required to use the brand’s product or service, find relevant information, or resolve an issue. This is done by asking questions that customers can answer using a sliding numerical scale (typically of 1 – 5 or 1 – 7).
The CES is then calculated by dividing the sum of all customer effort ratings by the total number of responses, resulting in the average score.
The Customer Effort Score (CES) gives brands a direct way of quantifying ease of use for their products, services, and overall brand experiences. Brands can use this both at a high level and more granularly to understand engagement with particular customer experiences.
For example, brands can ask customers how easy it was to adopt and use a feature, potentially even for different use cases. Similarly, brands can ask customers how easy it was to submit a customer support request, how simple it was to get a resolution, and how seamless the process was.
The challenge is that as you ask your customers more questions, you require more feedback, leaving you increasingly dependent on customer participation.
Rather than measuring overall satisfaction, the CES aims to measure how easy a specific experience was, helping brands identify pain points and friction in their customer journeys, whether it be onboarding or checkout.
This empowers brands to quantify and measure how customers feel about their experiences with your brand and make meaningful, data-driven improvements that foster engagement.
19. Net Promoter Score (NPS)
Customer Journey Stage(s): Advocacy
Net Promoter Score (NPS) is a score (determined from survey results) that indicates how likely a customer is to recommend your brand, product, or service. It’s a common metric used to measure customer satisfaction, loyalty, and — in particular — advocacy.
Customers are directly asked how likely they are to recommend your brand to someone else on a scale of 0 to 10. They are then divided into three main groups: promoters (those who answered 9 or 10), passives (those who answered 7 or 8), and detractors (those who answered 0 – 6). The NPS is then calculated by subtracting the percentage of detractors from the percentage of promoters using the following formula.
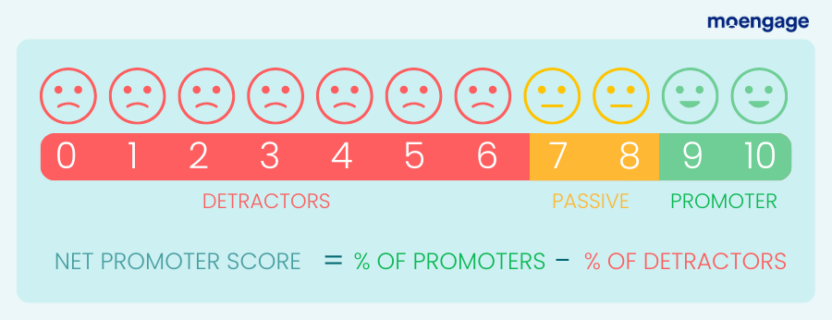
The net promoter score can range from its lowest point of -100 (if all customers are detractors) to its highest point of 100 (if all customers are promoters).
While it’s often (rightly) used as an indicator of customer satisfaction and advocacy, it’s also a major signal of customer engagement levels. After all, promoters are customers who engage frequently with your brand and likely plan to keep doing so.
For this reason, NPS is often seen as a direct indicator of a brand’s current customer engagement level.
At the same time, NPS is a solid indicator of future growth. That’s because the actual referrals these promoters say they are likely to make haven’t come to fruition yet. Once they do, you’ll see more customers flocking from referrals to get the same quality service your existing customers shared with them.
For these reasons, the NPS is most notably a measure of loyalty and advocacy while also being an indirect measure of satisfaction and engagement.
20. Ticket volumes by customer support channel
Customer Journey Stage(s): Retention
The ticket volumes for customer support channels refer to the number of support tickets each unique customer support channel is getting. Brands can use this information to analyze which channels have the highest engagement, as well as identify what the associated queries and issues commonly are.
In the most basic sense, ticket volumes are a great indicator of which channels are receiving the most engagement. More significantly, they provide valuable insights into the various channels’ biggest strengths and weaknesses and help brands understand which channels customers prefer for different scenarios.
For example, high phone call ticket volumes for high-stakes problems indicate that customers prefer to handle more important, intimate issues via the phone, while high email response rates for low-stakes problems indicate that customers prefer to handle simple, one-off issues digitally.
Similarly, a change in ticket volumes after the deployment of an on-site FAQ section could be used to measure the success and impact of this customer support feature.
Ultimately, ticket volumes help brands understand the usage — and performance of — customer support channels. They also help brands isolate pain points and hurdles their customers are experiencing so they can resolve these issues in the customer journey.
As you can see, these metrics are vital for brands, enabling them to actually measure and quantify customer engagement. But still, these measurements are only as good as the insights that marketers can extract from the data. Marketers still need to know what to do with these metrics, which takes time, repeated iterations, and experience.

How to Measure Customer Engagement: Tips from 3 Industry Experts
Here at MoEngage, we believe what can’t be measured can’t be managed. For marketers and product developers alike to build intuitive, omnichannel experiences, they need to rely heavily on omnichannel analytics that can help them deliver best-in-class experiences for their customers.
But simply having customer engagement data isn’t enough; brands need to be able to use these metrics to gain meaningful insights into how customers interact with them.
After all, there is a major difference between collecting customer engagement data and attributing those numbers to customer behavior at various stages in the customer journey.
Fortunately, we’ve connected with leading experts who have devised strategies to hone this data for the greatest impact. With the help of the following experts, we explore how leading brands use analytics to both measure and judge customer engagement.
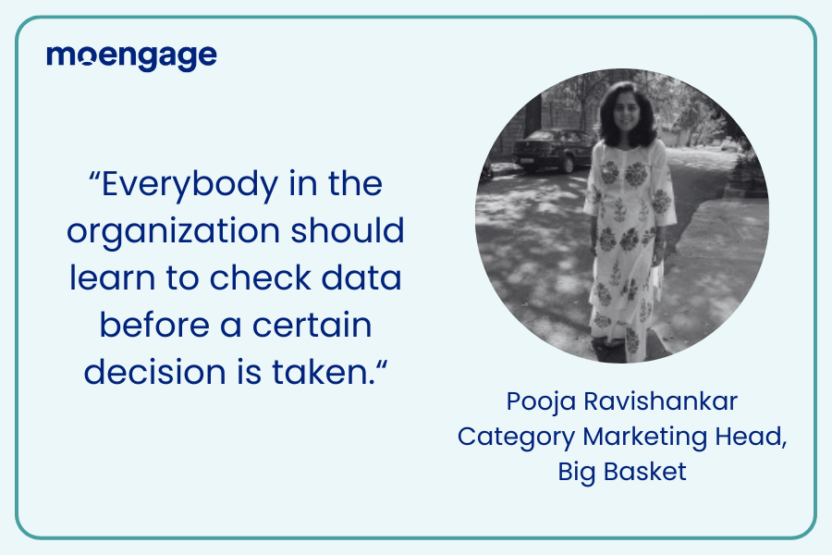
- Pooja Ravishankar as Category Marketing Head of Big Basket, one of the first online grocery retailers in India.
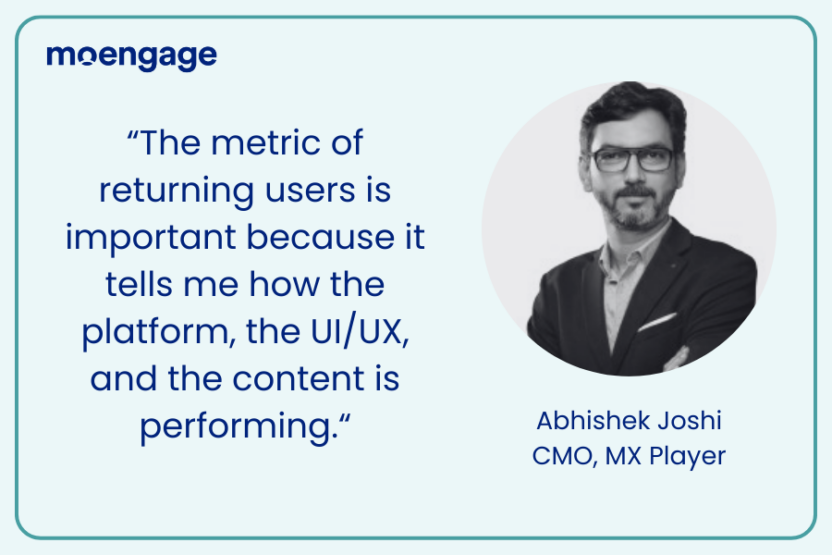
- Abhishek Joshi is the CMO of MX Player, an on-demand and over-the-top streaming service in the media and entertainment industry.
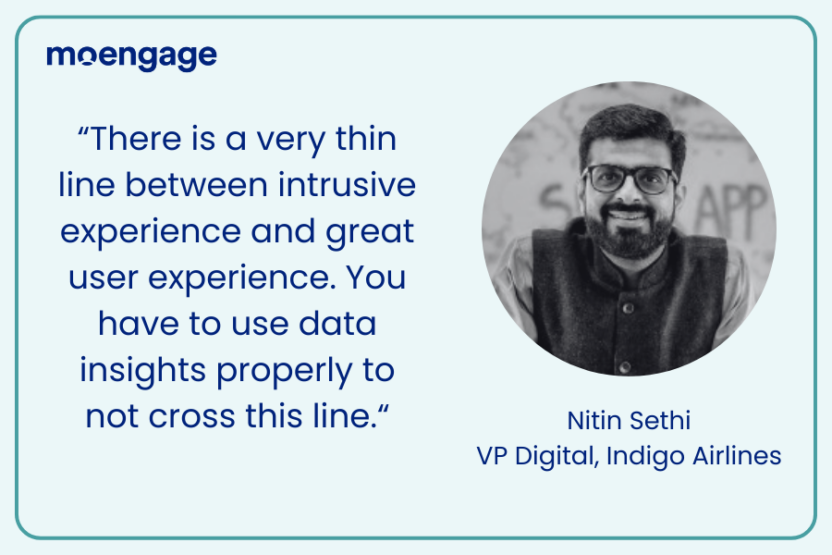
- Nitin Sethi as VP Digital of Indigo Airlines, a low-cost airline in the travel and hospitality industry.
The following excerpts came from a panel discussion with these experts that was moderated by Mr. Gaurav Chhaparwal, Analytics Leader and Advisor here at MoEngage.
Choosing the right customer engagement metrics
Question 1: In analytics, we say what gets measured gets done. What’s that one metric that best represents your customer engagement, and why do you think it is the best metric?
Nitin:
For us, the most important metric is of people who have flown with us in the last three months. We analyze how many of them are flying with us again, i.e., is it their second or third trips within 3-6 months. It helps us to find ways to retain the customer. It adds to the top line, bottom line, and customer retention. This is the best parameter for any transactional service-driven platform.
Pooja:
In the grocery sector, everyone requires fruits and vegetables at least once a week. That is the frequency of purchase we look at in Big Basket. Another important metric is how many times has a customer come back every calendar month of a year. It helps us to determine that the customer has not fallen off the bridge and is still active on the app.
We analyze how much a customer purchases from us in a month, how many times he comes back in a year, and how diverse the number of categories is across the lifetime. For example, does the person who typically orders rice and lentils also purchase fruits and vegetables or other FMCG products on the app? We have found that our loyal customers are the ones who buy from a wide variety of categories.
Abhishek:
Two metrics make a lot of sense in my business. One is returning customers, i.e., how many customers are coming back to my platform. MX Player was launched recently, but it has been in existence for almost five years now. It is one of the unique platforms that has seen a transition in offerings because we kept adding new offerings to the platforms.
The metric of returning customers is important because it tells me how the platform, the UI/UX, and the content is performing. The second metric we measure is the time spent by the customer on a piece of content as it adds to the revenue, engagement, and loyalty.
Rely on the data you ingest
Question 2: How do you act upon the data you receive? Can you give us an example of how you make decisions based on specific data points?
Nitin:
Our business has four to five core segments. There are millennials, there are first time travelers, business travelers who take flight in the morning and return in the evening, family travelers, and leisure travelers.
First, we understand these segments well. For example, we know somebody who is on a short trip or traveling alone will be fine sitting anywhere on the plane. They usually do not have any specific seat preferences and may not buy a meal. On the other hand, a passenger traveling with a wife and kids would be willing to pay extra for a preferred seat and meals.
Once you get these insights, you will find a pattern that will help you to decide what to offer to each segment. You need to personalize the solution for all types of audiences who interact with you.
Pooja:
The audience knows that data has multiple applications. However, I will give you an example of a tool that we built, which is analytical in nature. Typically, grocery buying works in two modes.
There is one set of products that you repeatedly buy, like vegetables, fruits, and staples. The other set is where you keep discovering as newer products get launched in the market. For the first set, we have built something called ‘the smart basket,’ which runs on an algorithm that predicts what you are running out of in your kitchen.
We keep moving up the items in the list. The smart basket has been in existence for the last five years. We are constantly making it smarter by adding new elements to it.
For example, we notice a shift in consumer buying, with most of them shifting from regular products to organic products. So, we have both organic potatoes and regular potatoes.
Once the customer purchases the organic potato, we start moving the regular potato down the list to upsell the organic ones to the customers. With mango season around the corner, we will start adding it to the list.
These are a few smart things that we do to personalize the offerings of the app and to improve the product and convenience for the customer. However, we also face challenges because there cannot be a uniform solution to everything. For example, we have to be careful not to offer non-vegetarian recommendations to vegetarians while making basket recommendations.
Abhishek:
MX players may have launched recently, but we already have 75 million Daily Active Users (DAU) and 175 million Monthly Active Users (MAU) because we have been there for five years.
The journey from data to information to insights does not happen overnight. You need to spend time on it. Once your insights come in, you have to know how to develop a strategy for programming and content, customer acquisition, etc. That is why we waited for a year or a year and a half to announce our official launch.
In three weeks, we were declared the No.2 OTT platform in the country. We are not a platform that showcases content aggregated from the outside world; we make our own content.
However, one must remember that the content can’t come from thin air because even if the content is based on creativity, it is also backed by science that includes determining who will see it, which geography to reach/engage, and so on. It is a continuous 24-hour job wherein we collect close to 400 billion data points a day.
We do not analyze every data point, but we pull out the relevant ones to see how it works.
Turn insights into action
Question 3: How do you act upon the insights once you receive them?
Nitin:
In our business, customer acquisition happens on different channels. For example, a fair number of bookings come from online travel agencies (OTAs) and direct channels such as mobile apps and websites, SMEs, and agents.
Once all this information is collected and the booking pattern is evaluated, you will find that people who come from OTA have a different way of transacting because the enablement happened from them, and you don’t have the information of those users until they check their flight status or do web check-in.
You have limited scope to cross-sell and upsell to them compared to someone who comes directly to your platform and is acquired by you. In this case, you can do a meaningful cross-sell and upsell.
There is a very thin line between intrusive experience and great customer experience. You have to use these insights properly to not cross this line. For example, 30-40% of the bookings come from our SMEs and agents or a personal assistant. There are chances that they may or may not know what meal you would like to have because your preference may change based on morning flight or evening flight. Here, you should know when to cross-sell and up-sell without pushing it onto the customer.
Pooja:
There is a lot of data in the e-commerce and digital context, so it’s important to have a very data-driven culture in the organization. Everybody in the organization should learn to check data before making a certain decision.
They should be trained to interpret data correctly because it can also be misleading at times. The second thing is to have the right technology to back this data. In this ever-evolving landscape, it is important to have the best technology that gives you the right data.
Abhishek:
We keep it simple. For us, knowing and evaluating the consumer’s journey is very important. We analyze data such as why has a consumer come to the app and what has he clicked on. Has he clicked on the content or has he clicked on the thumbnail because of the content he saw?
We further look at what is consumed: whether the customer exits or goes to another piece of content in the app. That is where cross-selling comes in – I should be able to sell him content similar to the one he clicked by using machine learning, the PI tool, and a recommendation engine.
I have also come to the understanding that people who search for content will always consume long-form content, while people who don’t search for content will consume short-form content. 60% of the conversion happens on short-form content. Users consume different types of content at different times.
For example, the customer may be interested in watching the news when he wakes up. In the afternoon, the same person may be interested in watching short-form humor content; at late night, it could be something else. Hence, it’s important for us to show the customer content that is very close to his interest at a particular time of the day.
As they’ve shared, for brands to effectively and continuously increase customer satisfaction and engagement, they need to deeply analyze both the breadth and depth of engagement with their products and services.
As these leaders have stressed, marketers and product owners should be able to interpret the data correctly, as nothing is more dangerous or damaging than the wrong interpretation.
Leveraging MoEngage, A Customer Engagement Measurement Tool
Now that you know what metrics to track and how to use them (with unique insights from leading experts), it’s time to devise a clear strategy for tracking and measuring them yourself.
Consider which metrics will be most useful for your industry and unique business case. Think critically about how each metric can be deployed to help you understand customer engagement with your brand in a meaningful, actionable way.
This will ensure you can consistently deliver better, faster, and smoother experiences that will impress your customers and keep them coming back for more.
MoEngage’s Cross-Channel Marketing solution empowers marketers to build intuitive customer journeys and dynamic campaigns that engage and retain customers across the channels they use. With omnichannel analytics, you can minutely segment customers so you can develop personalized journeys, experiences, and campaigns that they love.
Schedule a demo with our sales team to learn how MoEngage’s customer engagement platform can help you keep and activate more customers.