


How We Improved Our Business Margins by 20%
Meet CostsMetrics - a service that we’ve built in-house to help us walk the tightrope between scale and infrastructure costs.
Every business aims to minimize the production costs of its services while ensuring a top-notch customer experience. In Engineering, you can solve most scaling challenges by throwing the infrastructure at them. However, it requires a competent team to serve at a global scale and also keep the costs in check.
In this blog, I’ve covered how we tackled the challenge of a rapidly growing scale while optimizing our costs. Meet CostsMetrics – a service that we’ve built in-house to help us walk the tightrope between scale and infrastructure costs. I wish I had a better name for this internal tool. We did not spend enough time naming the service; however, its impact on our margins is enormous. After implementing CostsMetrics, we are able to keep the costs in check (20% savings on our infra costs), build proper limits to our services without altering their use cases, and maintain a good pricing book.
Here’s the back story.
Our Pricing Model and the Problem
At MoEngage, apart from the special addons, our pricing is based on a single metric, i.e., MAU (monthly active users) for an app or website. This stems from our core belief that we grow with our customers. When our customers see higher engagement via growth in MAU, MoEngage would have done its bit, reflecting our pricing. Another highlight about the MoEngage platform is that we are open-ended with some products. This means that customers can utilize these capabilities without any limits. We want to keep it that way as we don’t want to limit our customers’ use cases. We want them to think about their customers instead of focusing on costs. However, the open-ended system comes with a price. Depending on the usage, our infrastructure costs could vary but that did not necessarily reflect in the customer’s billing, thus impacting our margins.
Let’s look at an example here. In our campaign system, the infrastructure costs should be based on the number of push notifications, SMS, or emails sent to consumers. However, this does not reflect in our pricing model. A customer with 10 million MAUs, could send 3 billion messages in a month, whereas a customer with 100 million MAUs could be sending 1 billion messages, but they don’t pay equally to us. If we are looking at our campaign’s infrastructure costs, we should have clarity about these usage details. Now that you have some background about our product and the complex nature of our infrastructure vs. pricing problem let’s dig deeper.
The Trigger
Thanks to our CFO, infrastructure cost tracking has been a critical OKR ever since our early days. In 2018, we were part of a costs auditing meeting, and I couldn’t explain why the costs were increasing even though our customers’ MAU count did not change compared to the earlier months.
That’s when we decided to build CostsMetrics, a service that gives us the infra costs incurred when a customer uses all the services at MoEngage. We compare these costs with the customer’s MRR to understand how profitable a customer is for us.
We started monitoring the service usage, and after six months, a new question cropped up. When the service usage increases, we were not able to determine the customers who contribute to this surge. Is it just one or a bunch of them, and how is their usage of a particular service changing month on month? The objective was clear, analyze the costs of each service split by customers. Easy? Not so much. Let’s see what we did here.
The Solution
Before we build any solution/software at MoEngage, we take a lot of time understanding the requirements in the form of PRDs and the solution by writing it down in technical documentation.
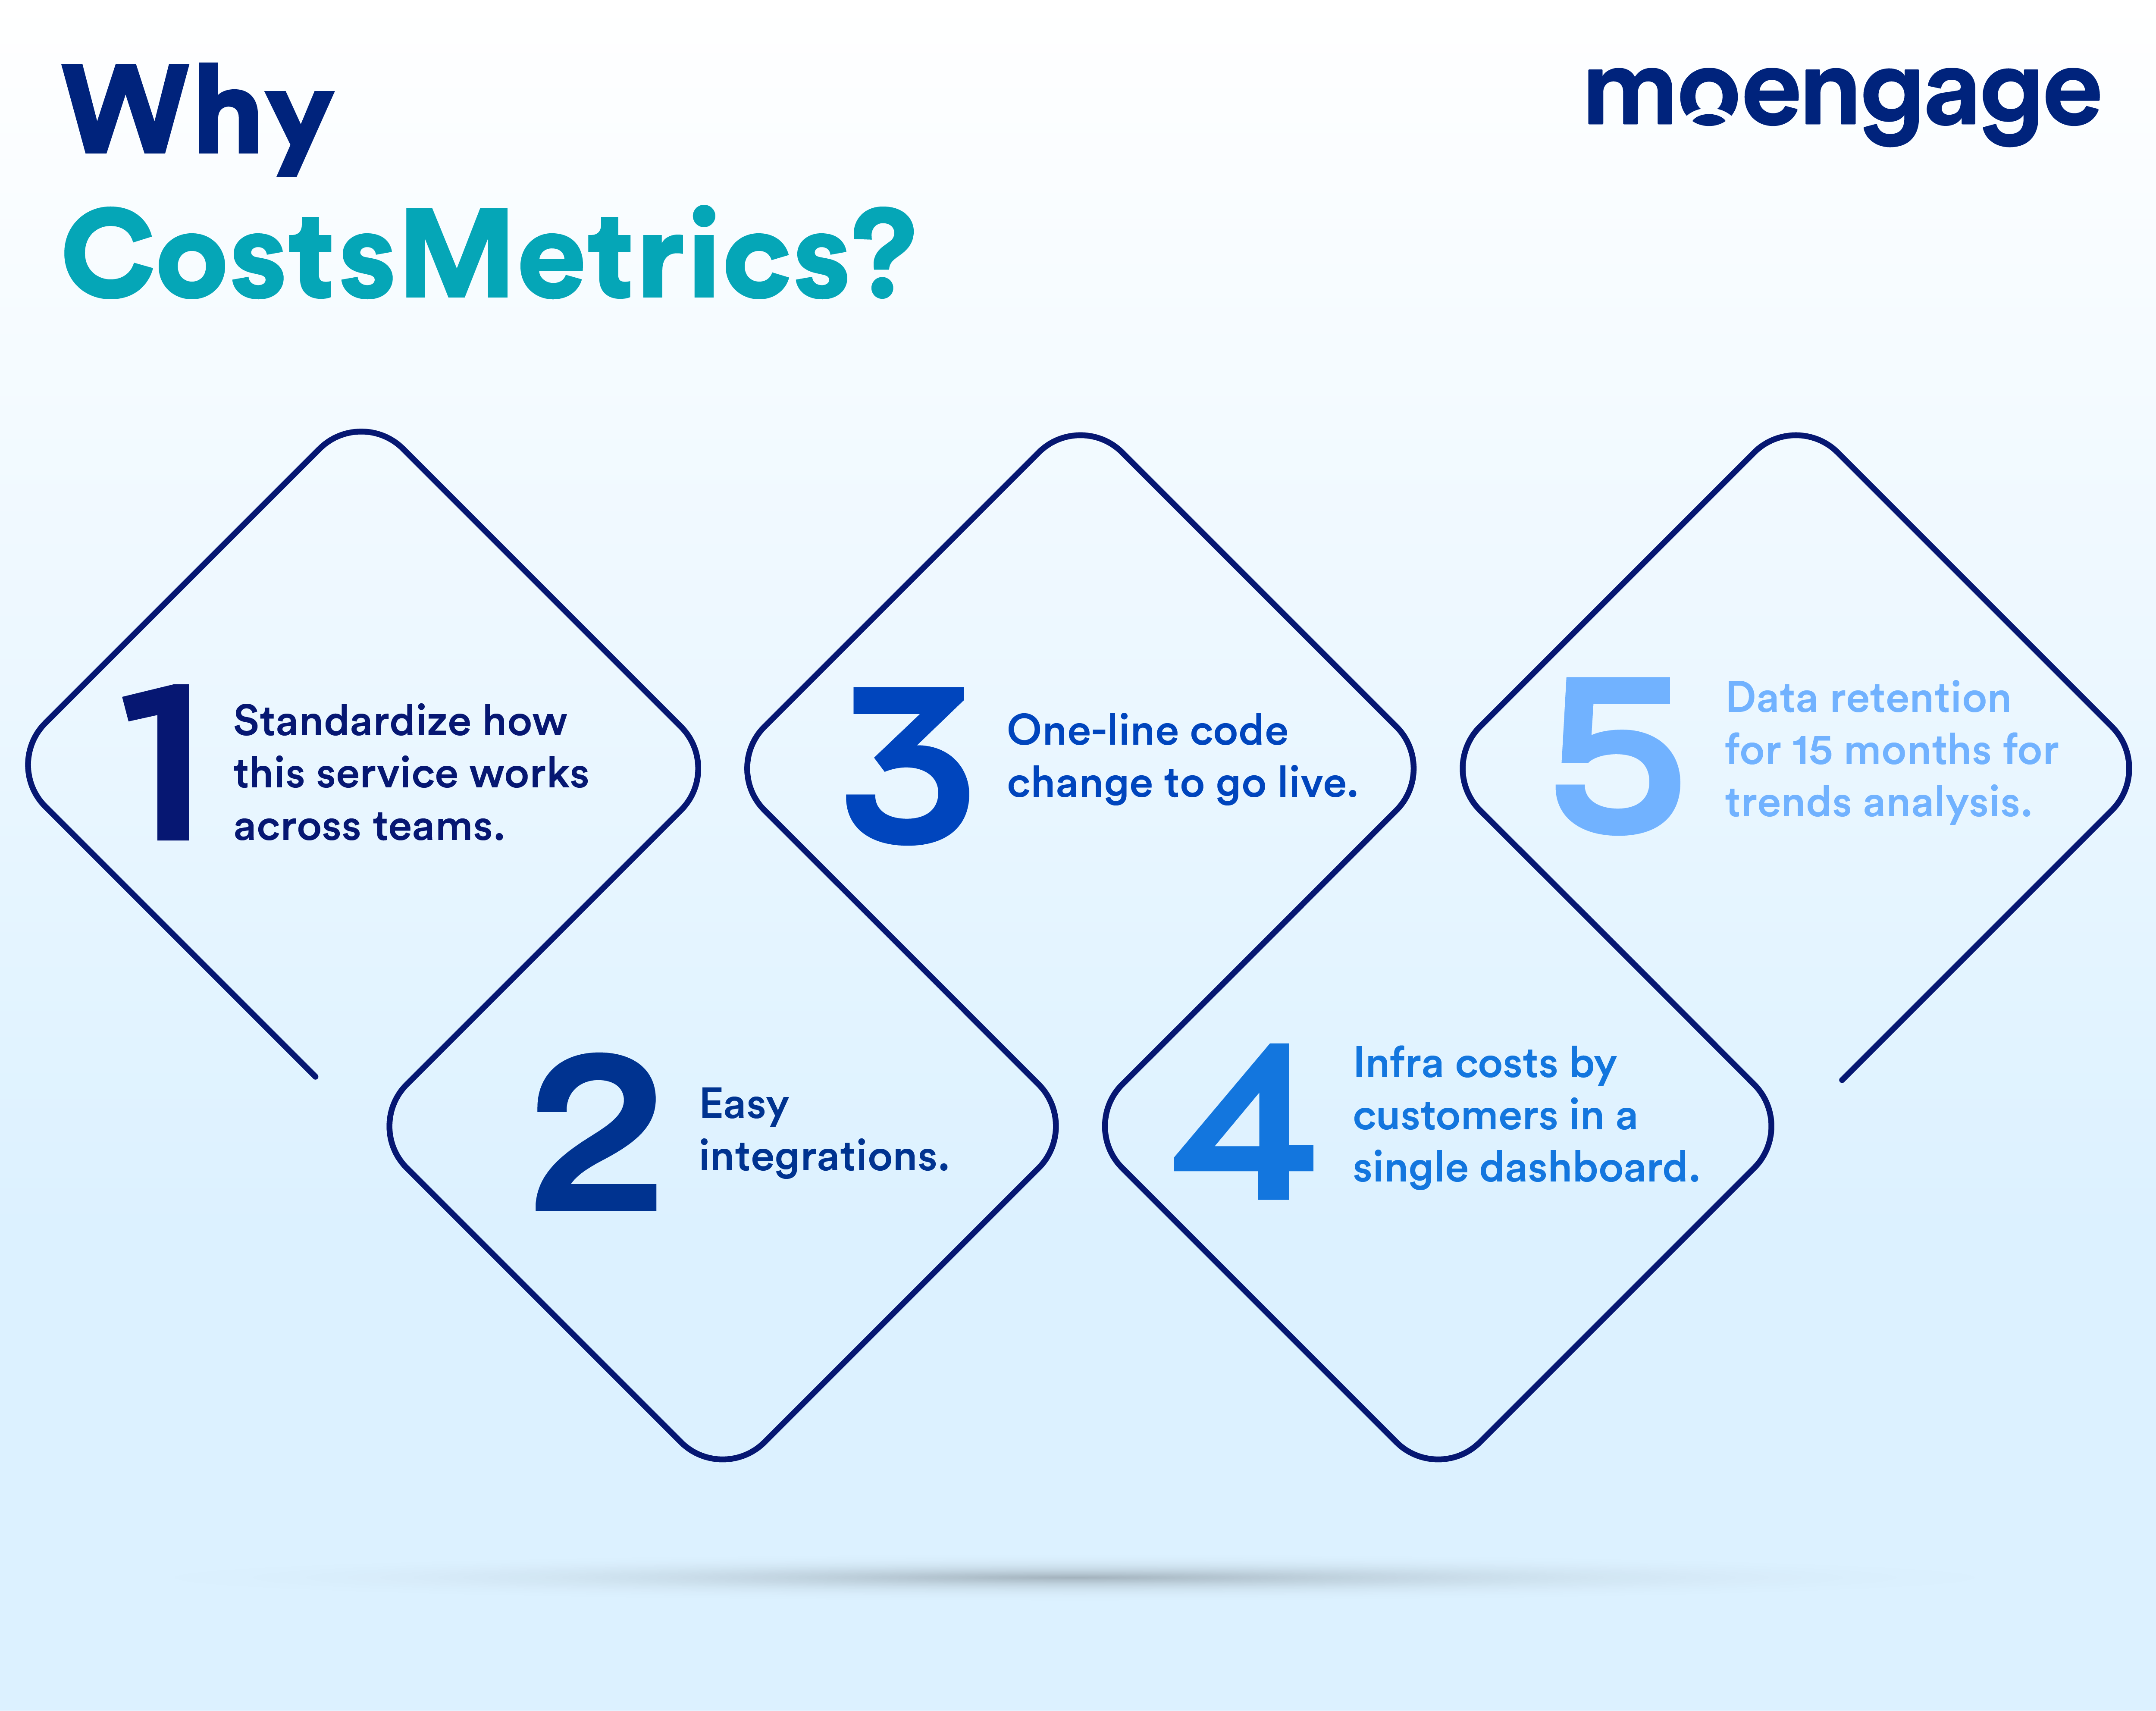
With CostsMetrics, we wanted to build a service that can:
- Bring standardization in terms of how this service would function across teams.
- Integrate with all the teams inside MoEngage easily.
- Go live with a one-line code change to see the magic happen.
- Consolidate the costs by different customers to the stakeholders via a single dashboard.
- Retain data for 15 months to understand the monthly cost trends.
The first hurdle that we needed to cross was to monitor our service usage costs for each customer—for example, the number of push notifications sent from a customer on a specific day. Fortunately, we have an internal tool called Watchdog(internal name), which tracks any metrics in a time-series database, so it’s easy to pull up these reports when needed. We had to build a wrapper on Watchdog to improvise the mandatory parameters for the CostsMetrics service, and the data we needed was flowing seamlessly.
Once we had the service usage by customers, the next step was to map this with infrastructure costs. We had to rely on manual efforts than code to accomplish this and properly tag our infrastructure. At MoEngage, we have each infra tagged with three labels, Business, Service, and SubService. It took us about one year to properly tag our infra with all these three labels. In between, we went from camel case tagging to small case overall tagging, which increased our timelines for this project. CostsMetrics service would monitor the machines that send the usage data and the tags for that machine.
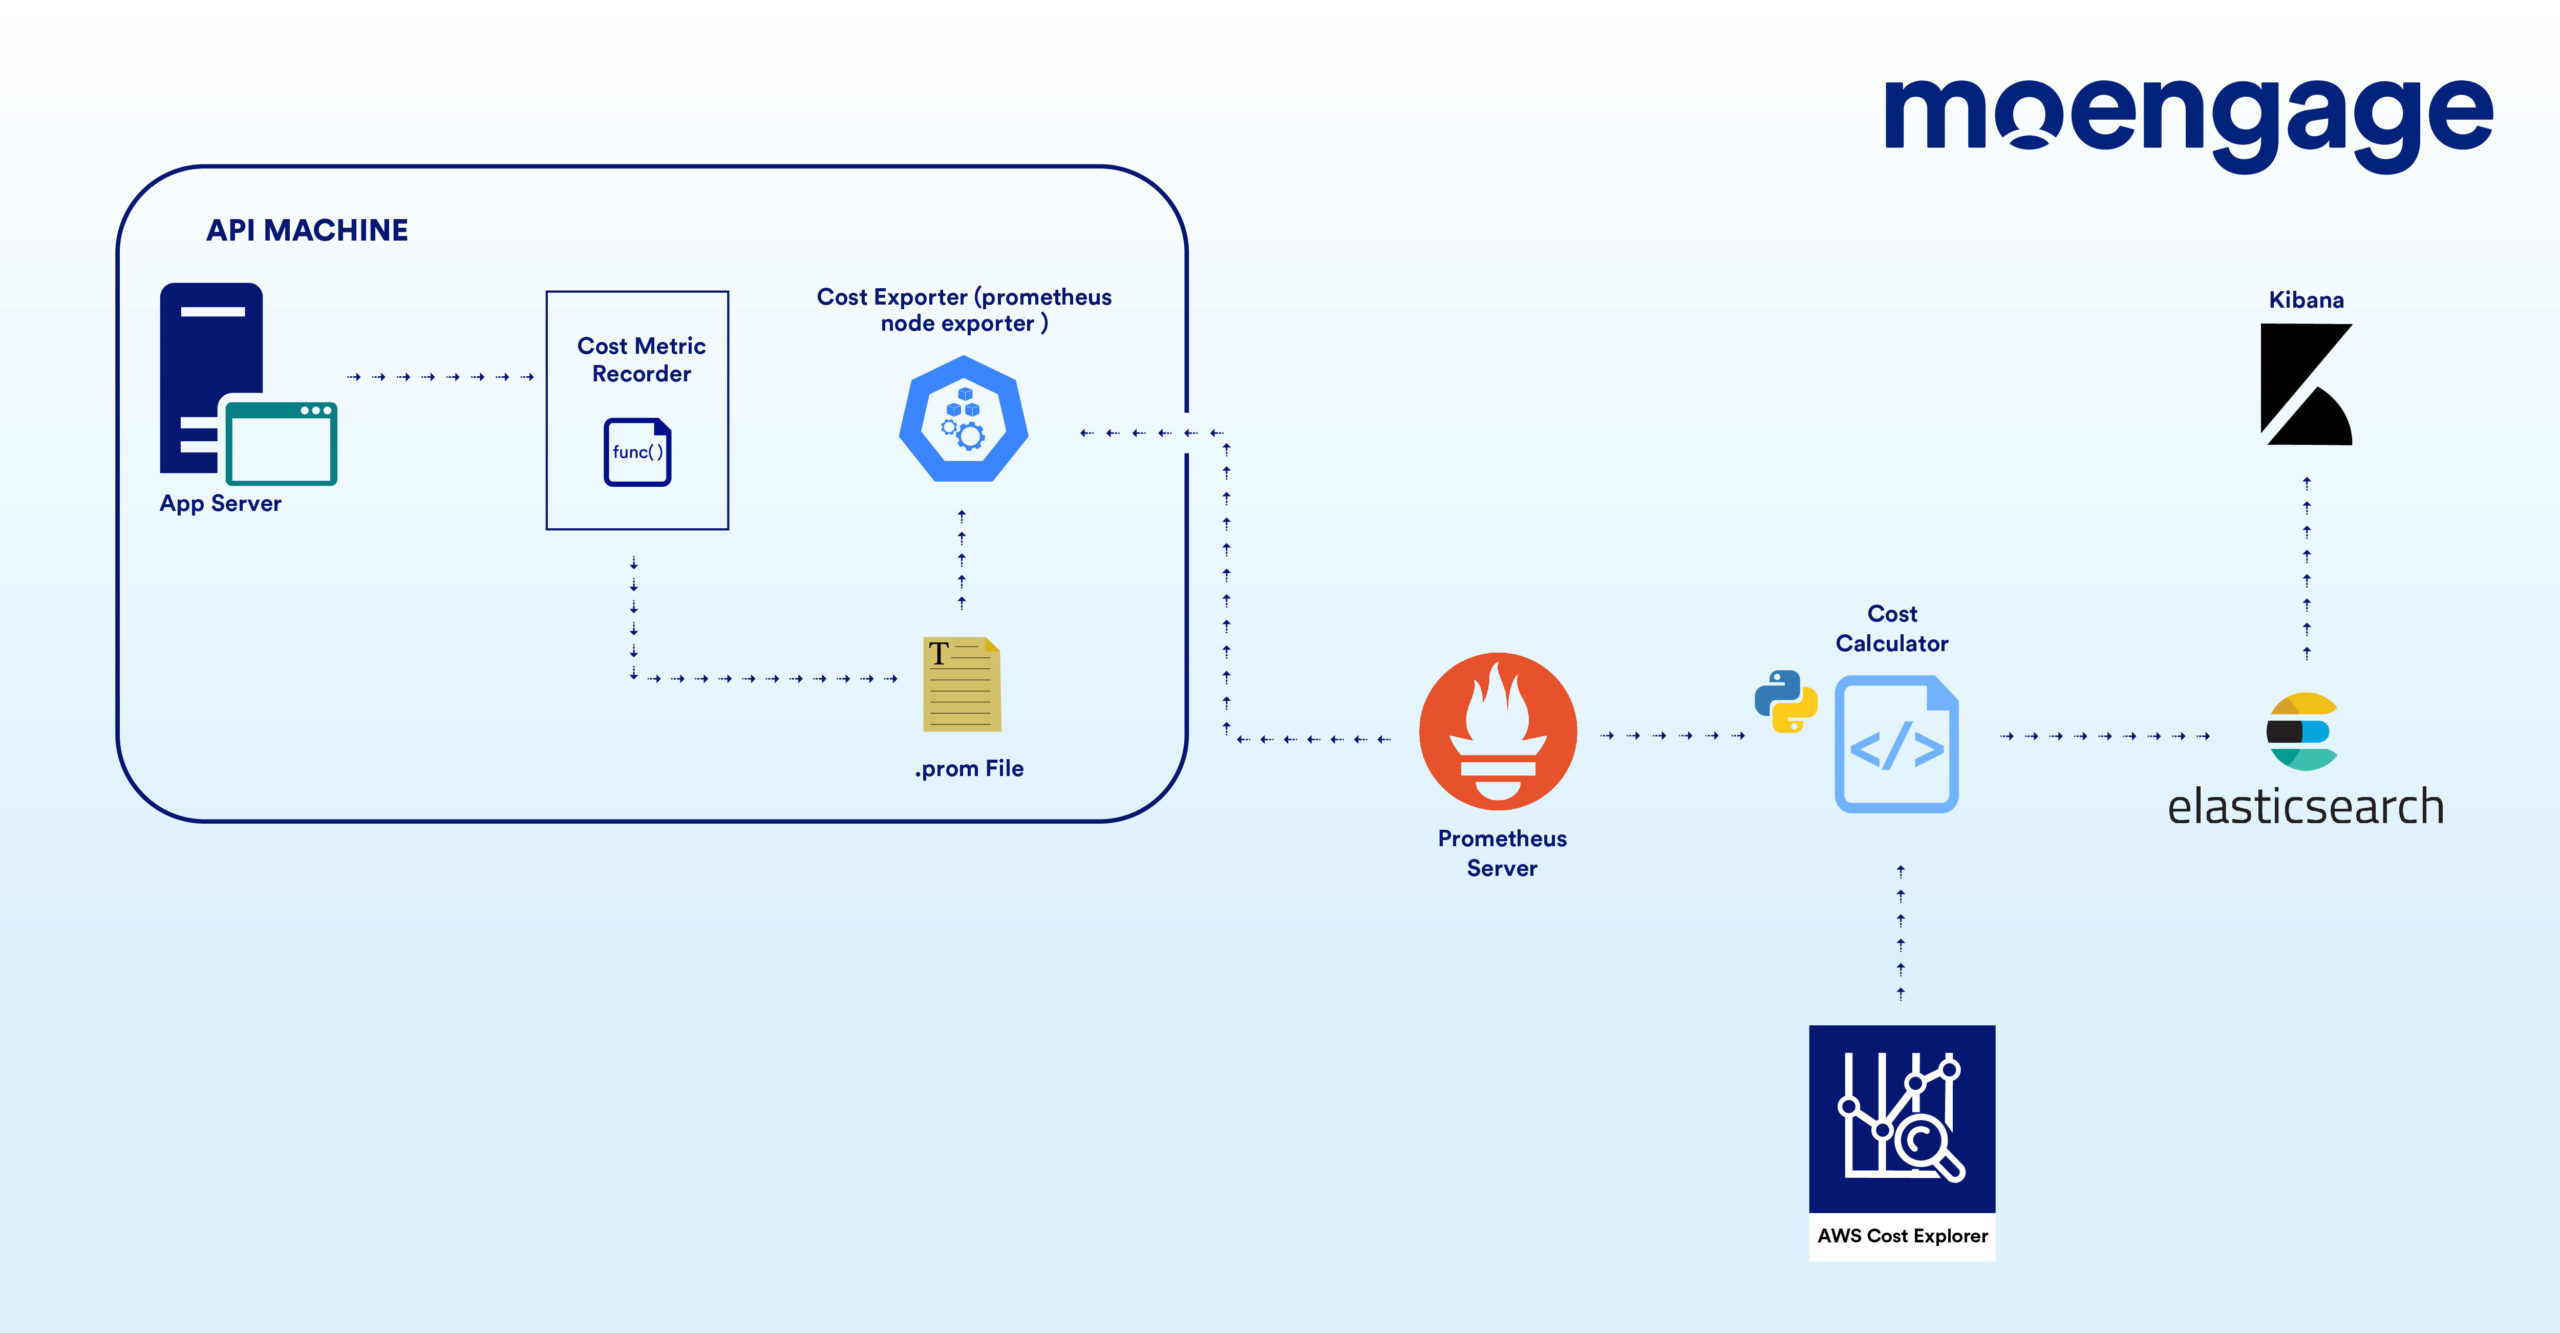
Once we had usage data with tags and the exact infrastructure costs with those tags, a script would run each morning to associate the usage data by the customer to the infrastructure costs. We use Elasticsearch to store this data and Kibana to visualize the data. We also use Prometheus to store the granular data daily. Happy yet? No, there is still a curveball coming our way. How do we attribute shared infra costs such as databases, CloudFront, queues, and more which can’t provide usage metrics per customer?
We had to introduce intelligent tagging and association, where a SubService could have a combination of regex to derive such complex costs. For example, SubService tagging for a database could be – SubService1+SubService2, which tells our code that we can get the usage metrics for these two SubServices and calculate the usage metrics for the database. We also introduced a JSON mapping in the code, where such intelligent tagging wouldn’t be possible.
With this solution, we map all the infrastructure costs per customer. We are still trying to figure out how to do this on k8s, but we will get there. We have spent about a year getting this in place, and now it’s time for the impact analysis.
The ROI
The CostsMetrics service costs us around $1000 every month, but let’s look at the benefits.
- We have a revised pricing book that helps our sales team estimate the costs of complex or big deals based on customer usage metrics.
- We can decide on the FUP limits for our products without affecting the customer use cases. There will always be less than 1% of customers who would breach these limits, and they connect with our sales team to increase the limits.
- Business metrics look great in margins – we saved 20% on our overall infra costs.
- We have day-to-day visibility into customers contributing to higher costs and can act on them immediately.
When I began writing this article, I used the CostsMetrics Service and found that one of our SMB customers uses our platform infra at a level that an enterprise customer would typically use. We alerted the customer about the usage and shared notes to help them bring this down. Our team performed the analysis within a minute, and we could save at least $1000 in this case. There have been cases in the past where we could save thousands of dollars by working with our customers based on the data provided by this service. Excellent from an ROI point of view for our customers and MoEngage.
We have never shied away from executing complicated projects. We achieved this success with the help of multiple teams working together over a long time and a lot of patience despite other priorities in the roadmap.
If you want to be part of such projects, why don’t you look at our Careers page? We are always looking for the right people to join our team – who knows; it could be you telling a similar story next time.