


Improving Reliability by Restructuring Kafka Cluster on MoEngage
Real-time streaming serves as the backbone of the MoEngage product features. Right from the early days of 2015-16, we have extensively used Apache Kafka and Apache Samza for real-time events processing for both stateless and stateful data pipelines.
Over the period of the last 8 years, we have seen both the evolution of our own product and a multifold increase in the scale of data processing needs.
There have been multiple learnings with running and operating a large set of Kafka clusters along with Samza applications. We have performed many upgrades and restructures to achieve the best performances from these systems for our use cases.
Earlier, we published our learning of managing big Kafka clusters Kafka Redesign and Lessons Learned. Currently, we have multiple data centers across geographies in AWS and Azure. We operate with more than 10 clusters in each data center.
In this post, we are writing about how we have been improving and further restructuring one of the biggest Kafka clusters.
State of Kafka Clusters
We have dedicated Kafka clusters for various business use cases based on our product features and client requirements.
This cluster handles traffic of a few million events per minute. There are multiple business-critical jobs that are deployed as Samza applications. For these applications, streaming pipelines are expected to work with a Service Level Agreement (SLA) in single-digit seconds for end-to-end processing.
An example use case for this kind of strict SLA is time-critical actions/notifications sent to customers whenever they go through a journey on an E-commerce website. Another example could be sending a transactional OTP after the customer accesses a security-enabled feature on the client website/mobile app for identity re-verification.
The Need for Restructuring Kafka Clusters
Based on strict SLAs at our data volume, we needed to improve our Kafka infrastructure. One of the biggest Kafka clusters we operate is ‘Kafka-automation’. We follow the nomenclature of naming Kafka clusters based on the domain. We recently restructured this cluster for better performance. This internally serves multiple microservices and streaming jobs required to support this use case.
As mentioned, our streaming data pipeline includes Kafka and Samza stack for processing and intelligent ETL of event-based data. This stack has some inherent limitations, which got aggravated as the number of jobs and traffic on each job increased over time.

As most of these jobs have a lot of legacy code to enable the feature set and maintain SLAs, it’s not feasible to entirely change this architecture. We will now go deeper into some of the significant challenges we were facing:
1. One-to-one mapping of source topic partitions with the number of Samza containers
As mentioned earlier, we have multiple stateful jobs. These Samza jobs have the internal state as changelog topics in the Kafka cluster. Being a stateful application, a challenge will arise to process the event in a defined SLA in the case of a changelog topic that doesn’t have the required state and needs to make a network call to a Database to retrieve the state.
We run Samza on yarn, and each container processes the events from a single partition of the Kafka topic to keep the end-to-end processing time as low as possible. Samza process and window functions follow single-thread semantics.
Now, let’s take a scenario: assume that the average time spent processing a message in stateful applications is 5 ms. Based on this, the maximum throughput from a partition can be 200 messages per second. So, if we have to process 100K msg/sec, it would require 500 partitions in the source topic.
Considering our growth rate and to handle the peak scenarios, we repartitioned this particular topic with 600 partitions in the Kafka cluster.
We use Rocksdb as the local cache for Samza StreamTask. This reduces the need to fetch data from any external source at processing time and keeps on getting updated through database CDC Kafka topics. The way Samza operates, we need to have the relevant cache for event processing routed to the correct yarn container so that no network call is required.
This requires messages in different topics to be produced with the same key/identifier such that they always go into the same partition number and forces these input streams to have the same number of partitions.
So now, other ingestion CDC topics required to replenish the Rocksdb cache must also be created with the same number of partitions.
These jobs can have multiple internal states, too. For example, if an application has 4 internal states and would have corresponding 4 changelogs, which get created with the same number of partitions by the Samza application.
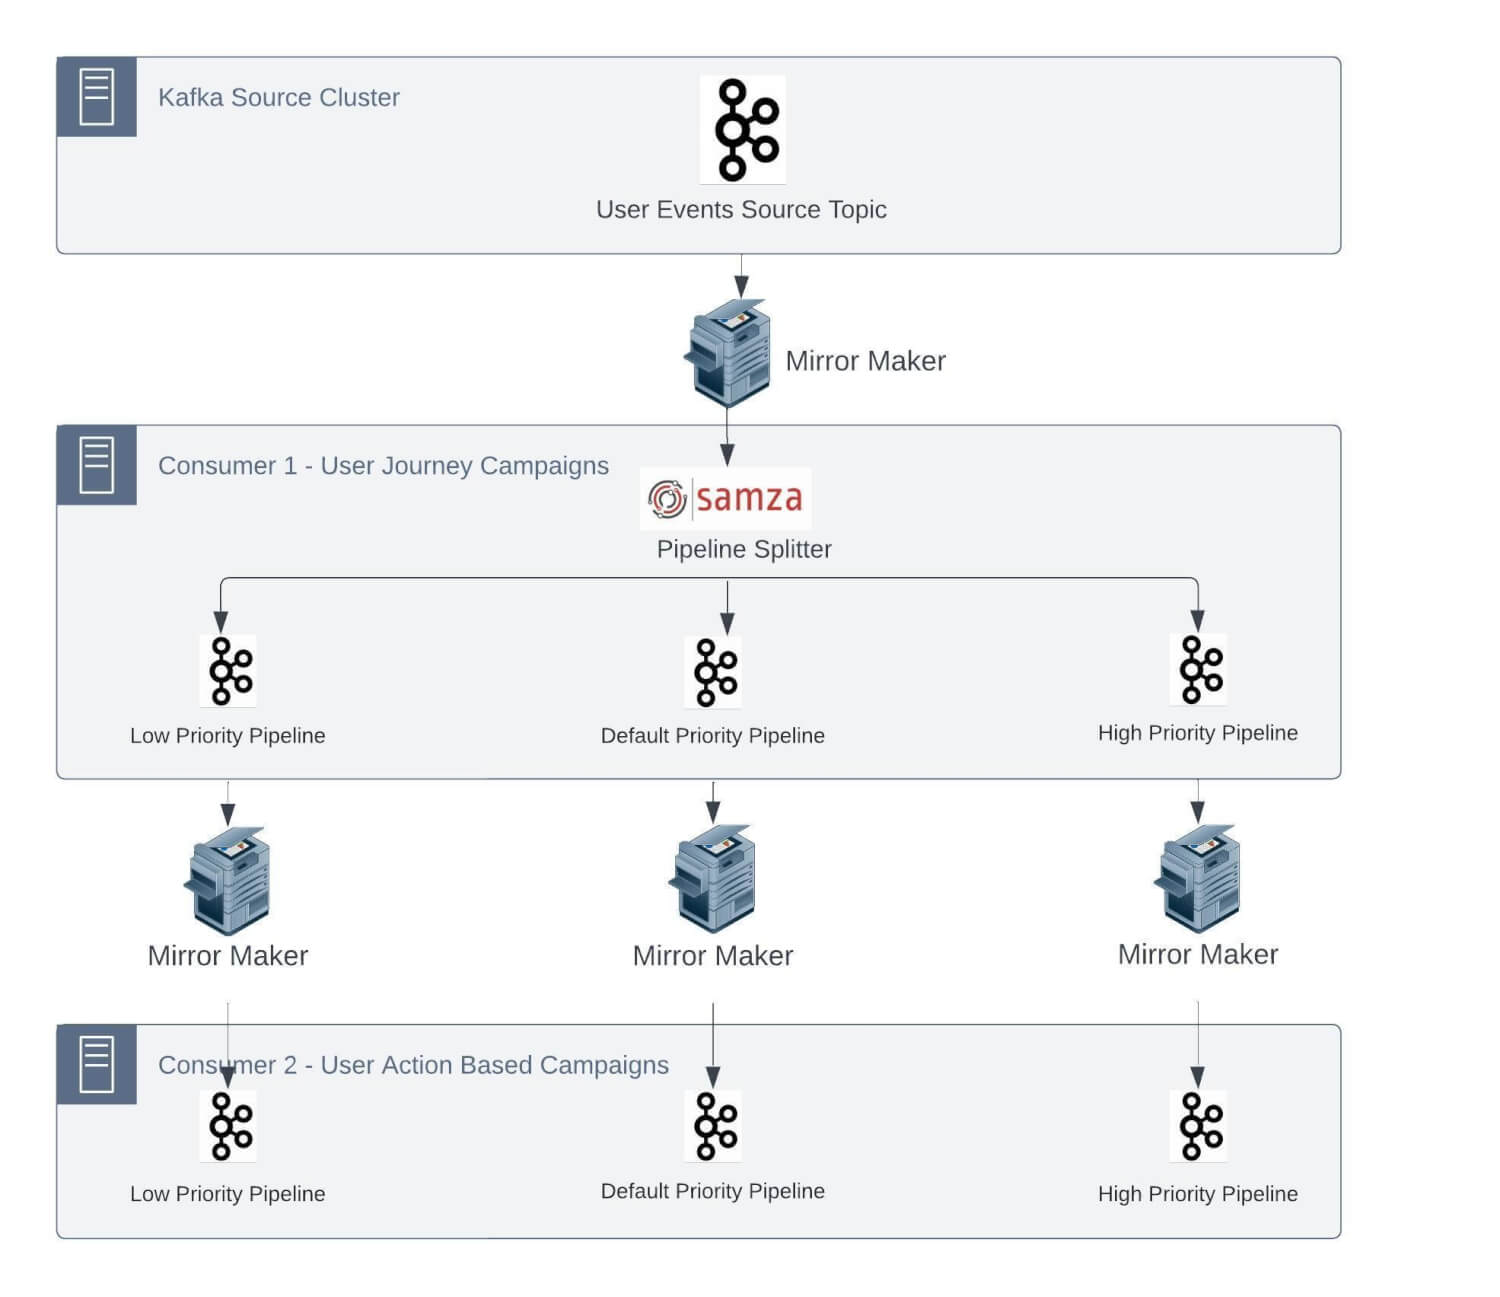
Specific to this use case so far, we have 1 Unified topic, 2 CDC topics, 4 changelog topics, and 7 topics, each with 600 partitions. As time passed, we onboarded more Samza applications, consuming events from the unified stream. We also had low-, medium-, and high-priority topic separations, resulting in even more topics in the Kafka cluster.
This has been an operational nightmare for us, forcing upstream teams to repartition and rebalance topics based on downstream jobs to work properly.
2. Abandoned/Unused changelog topics
Samza creates changelog topics based on its application ID. Sometimes, application IDs must be changed due to version updates or internal job constraints. This results in current changelog topics being abandoned and recreating new changelog topics for new application IDs. Some jobs require frequent application ID changes due to their nature of requirement.
By default, these changelog topics are created as log compact topics. Hence, they retain keyed messages in topics even if these topics are abandoned and will not be used in Sazma applications.
3. Brokers performance degradation
We started facing some critical issues with the brokers as traffic grew over time. 1-to-1 mapping forces even topics with smaller use cases with a low message rate to be created with 600 partitions.
We reached a stage where our Kafka cluster with 8 brokers was running with more than 20K+ partitions on each broker and 100K+ partitions in total, including replicated partitions.
This caused performance degradation for our brokers. We started facing the challenges discussed below regularly.
- Too many open files errors: Each partition on the broker has a logs directory in the file system where it stores the messages. For every partition, brokers keep two files (one for the index and another for appending the actual message data) opened per log segment. There used to be more than 300K+ files opened on each broker. Per our earlier Kafka experience of running Kafka clusters, all the brokers were initially configured with 100K file descriptor limits. As topics grew, the number of file descriptors required started breaching the max limit, and we started receiving errors for brokers being either down or restarted due to too many open file errors.
- Issues with compaction topics – Before we dive deeper, have a look at Kafka compaction if you are not aware of the working dynamics of log compaction retention policy in these posts – An investigation into Kafka Log Compaction and https://towardsdatascience.com/log-compacted-topics-in-apache-kafka-b1aa1e4665a7. Let’s understand some of the key configurations used in log compaction and how they impacted our brokers –
-
-
segment.ms– This configuration controls the period of time after which Kafka will force the log to roll even if the segment file isn’t full to ensure that retention can delete or compact old data and the default value is 7 days. So if there are very low message in-rates, log segments are closed after days, and post that, deletion or compaction is performed. -
min.cleanable.dirty.ratio– This configuration controls how frequently the log compactor will attempt to clean the log (assuming log compaction is enabled). By default, we will avoid cleaning a log where more than 50% of the log has been compacted. If there are very low in-rates in topics, then compaction is triggered in longer intervals, and if topics have no new incoming messages, Then compaction will not be triggered at all, and messages/logs-segment will retain the desk space forever. -
cleanup.policy=compact,deletetypes of applications, you may have windows of time with many versions of the key. During the window, you only want to retain the latest version of the key. However, once the window has expired, you would like to have the segments for the window deleted. With both compact and delete-enabledretention.msof the changelog would be set to a value greater than the retention of the window. Although old windows won’t automatically be removed on expiration, the broker will eventually remove them as the old segments expire. -
cleanup policy–compact -> deleteSome changelog topics simply work a caching where the state can be built by querying the database.
-
-
High CPU usage – With our experience of running a Kafka cluster, we have learned that there is a direct relation between ProduceRequests and Latency. Higher ProduceRequests lead to higher CPU usage on brokers and increased latency. To keep our cluster stable, we anticipated reducing ProduceRequest counts as much as possible. It can be assumed that a Kafka producer will generate more ProduceRequests if a topic has more partitions. Since we created topics with 600 partitions and added more topics, we reached a stage where Kafka brokers always had ~90% CPU usage.
-
High disk usage alerts – Many topics had retention of weeks and month(s). A lot of high disk usage alerts were caused due to such topics.
Due to these problems, we have been bombarded by Pager Duty alerts one after the other, which has caused degradation in the quality of service we want to maintain. We still manage the margin of safety with additional infra so we don’t breach any client-side SLAs. This additional margin of safety has inflated the infrastructure cost for the clusters.
Further, scaling and pushing new features has been difficult due to these issues. Every time a new feature was planned for release, we needed to do a viability study on our current infrastructure and plan according to that. This has increased the launch time for a couple of our products.
Multi-pronged Solutions For Major Issues
With running a cluster with all the above challenges, we realized that creating topics with many partitions does not bode well for maintenance and smoother operations.
We implemented some of the solutions listed below to handle the major challenges detailed in the above section:
-
We cannot get out of Samza immediately. Due to this, we cannot completely resolve 1 to 1 mapping of topic partitions to Samza job containers. We decided to reduce the number of partitions and containers on the Samza side and increase the processing capacity of individual containers to accommodate for the processing speed. We revisited Samza application configurations such as producer batch size, linger ms, compression type topic replication factor, etc. to reduce the end-to-end processing time.
We also segregated stateless and stateful jobs so that we could have an easy scaling process.
-
As mentioned earlier, when the application ID for a Samza job is changed, a new set of changelog topics is created, and older changed topics are simply abandoned.
We typically see a lot of changelog topics resulting in huge numbers of opened files, numbers of partitions on brokers, and the broker as the leader for partitions.
Our approach for cleaning these topics was simple: we listed all the topics that did not receive any traffic in the last week and considered them as abandoned/unused. We changed the cleanup policy to delete and reduced retention to 1 minute.
With these changes, messages were cleaned from disks, but to reduce the opened file counts, we also had to get rid of these partitions-metadata from the disk too. Since we have topic deletion disabled for our business requirement, it’s not feasible to enable topic deletion temporarily by changing the broker’s configuration and deleting them as it requires broker restarts. So, we have added a dummy broker instance in the cluster and moved all such abandoned topics to this broker by reducing the replication factor to 1. With these changes, we have cleaned up the disk space and reduced opened files from brokers significantly.
However, a new challenge arose when a new topic creation could have partitions on this dummy broker. So we had to choose which brokers to use for partition distribution to avoid dummy brokers.
-
We also increased our broker’s file descriptor limits to reduce too many open file errors. This gave temporary relief to the on-call team.
-
We tuned our broker’s configuration to our recent needs. We decreased the segment.ms to 1 day for faster deletion and early compaction triggers. We changed min.cleanable.dirty.ratio = 0.1 to enable an aggressive compaction strategy. This reduced the disk space usage and opened file count. Some topics have very large stateful states. We started enabling both policies and set cleanup.policy=compact, delete for log compaction topics to reduce disk space usage further. We also changed the cleanup policy from compact to delete wherever we could live with the jobs fetching data from sources like databases and not Kafka topics on restarts. This further reduced disk usage.
-
To decrease the latency and reduce broker CPU utilization, we experimented both with horizontal and vertical scaling and found a threshold that a broker can serve within the desired SLA if the ProduceRequests count stays within a limit and found it to be approximately 4K for our use cases. But we needed to add more jobs and topics shortly so horizontal scaling (adding more brokers) became the primary option.
Again, horizontal scaling requires manually redistributing the partitions to newly added brokers. High-volume topics required more time to balance. Redistributing high-volume topics also reduced disk usage on older brokers and increased utilization on newer brokers.
-
We asked our teams to re-access retention for their respective jobs and bring it to the minimum possible period without causing SLA breaches.
With all the above solutions and maintaining standard practices in mind, we created two new Kafka clusters for stateful and stateless jobs. All the topic partitions were reevaluated or recreated with fewer partitions and the right replication factors wherever possible. Post-migration, We have seen a huge improvement in latency and SLA adherence.
NOTE: Not detailed, but we still have some of these challenges because of business constraints, which are not part of this post.
-
We are also creating topics with higher partition counts for low-in-rate topics.
-
We still see the application being changed for Samza jobs and abandoned topics on brokers.
-
A few topics remain where retention is of weeks and months.
-
Samza jobs still require further tuning, such as batch size, linger ms, compression, etc.
Conclusion
Whenever there is an ask for SLA improvement or latency reduction, we should relook at improving application code, network calls, and caching and reevaluating the processing engine itself. Increasing resources like partition count and container counts, etc, should be evaluated with great care.
With a better understanding of Kafka utilization and Samza tuning, we were able to improve the reliability of our system. We can uphold our SLA commitment to our customers much more than we did with our older cluster, and we can do it with a 40% cost reduction.
But many of these fixes are still not solving the real root cause of problems. These have given us breathing space and let us serve the customers quickly.
Most problems related to throughput and latencies are born out of Samza’s event processing model. Limitation in parallelizing the various operators is still a bottleneck for us.
We have evaluated other streaming alternatives, and stream processing with Flink seems suitable for solving most of our challenges. We plan to move out of Samza over time to implement a long-term solution for these challenges.
Changing the stack in a single go is impossible for a large organization like MoEngage. We have internally introduced Flink-based streaming PAAS for our new jobs. This implementation utilizes Kubernetes as an orchestrator. This will also help move away from Yarn-based job deployments and bring service containers and streaming jobs on the same orchestration layer. But it will be a while before we leave entirely big Samza jobs. Until then, we will still have to maintain and operate some of the legacy implementations.