


Customer Segmentation Analysis: Methods and Metrics
Most brands think they understand their customers, until they actually sit down to do a proper customer segmentation analysis.
That’s when patterns start to appear, and gaps too. You begin to see which customers buy once and disappear, which ones quietly return again and again, and which groups respond to completely different messages.
But the challenge is, a customer segmentation strategy isn’t as simple as sorting by age or location anymore. Many teams already have that kind of data, but can’t quite turn it into something that changes how they act. They still run campaigns on averages, not on meaningful clusters. For instance, two customers might spend the same amount but for very different reasons, and if you miss that, you miss the chance to market your brand right.
So how do you go from raw data to real understanding? How do you make segmentation analysis worthwhile? That’s what we’re going to unpack in this blog post.
What is Customer Segmentation Analysis?
Customer segmentation analysis is the process of dividing a customer base into smaller groups based on shared characteristics, such as purchase behavior, and analyzing those segments to gain a deeper understanding of them. It helps brands tailor strategies to the specific traits of each group.
It’s also considered a way for marketing teams to see behavioral patterns that aren’t always visible in top-level reports and to plan communication that feels more relevant.
Most brands already keep track of demographics and sales, but this goes deeper. The real work begins when you examine customer behavior over time, including how often customers return, which channels they respond to, and the types of products or services that spark their interest.
Sometimes the patterns are clear; other times, they’re messy and take digging.
A good segmentation customer analysis usually looks at:
- Purchase frequency and timing
- Engagement across campaigns or channels
- Customer lifetime value (CLV) or retention trends
- Motivations inferred from actions, not assumptions
When these pieces come together, the data starts showing actual groups you can work with, not just numbers on a dashboard. It helps marketers and product teams focus their decisions, test ideas on specific audiences, and make changes that feel grounded in real customer behavior.
The picture keeps shifting, of course, as customers change and new data comes in.
Why is customer segmentation analysis important?
Without proper segmentation, it’s easy to assume all customers behave the same. On paper, they may appear similar, sharing the same region or product line, but in reality, their habits and reasons for buying can be quite different.
Customer segmentation analysis helps make those differences visible, allowing teams to focus their attention where it matters most: on customers who are more likely to respond to messages, stay longer on the app or website, or bring higher value.
When brands skip this, things start to feel scattered. Marketing automation campaigns miss the mark, resources are directed to the wrong audiences, and engagement declines.
A good segmentation study often shows which customers bring the most growth, which ones are quietly slipping away, and which groups might increase spending with the right kind of message.
A few things that customer segmentation analysis makes easier are:
- Audience targeting becomes sharper and campaigns work better.
- Budgets go to the segments that actually perform.
- Retention and loyalty improve because communication feels more relevant.
- Product and pricing teams get clearer signals on what to adjust.
- Messaging stays consistent across every channel.
It’s not a one-time task, though. Segmentation continues to evolve with your customers, and eventually, it begins to do more than simply sort data. It turns information into empathy. It reminds teams that behind every click or purchase is a person making a choice for a reason. The closer you get to that reason, the stronger your marketing becomes.
RFM Analysis for Customer Segmentation
One reliable method for conducting customer segmentation analysis is RFM analysis, a technique used to categorize customers based on their purchasing behavior. It helps marketers to quantify loyalty and value through real actions rather than assumptions.
The method primarily analyzes three key traits: the frequency of their interactions, the level of their engagement, and the amount they spend.
Here’s a breakdown of the traits:
- Recency (R): How long it’s been since a customer last made a purchase or engaged with your brand. Customers who’ve interacted recently with your brand are more likely to respond to new campaigns or offers.
- Frequency (F): How often a customer buys from or engages with your brand. Frequent customers tend to show stronger brand affinity and are prime candidates for loyalty or upsell programs.
- Monetary (M): How much a customer spends over a defined period. High spenders usually contribute the most to overall revenue and deserve focused customer retention efforts.
The reason RFM analysis for customer segmentation works so well is that it’s rooted in real behavior, not general demographics or guesswork. It enables marketing teams to identify loyal customers, lapsed ones, and potential high-value segments in minutes, then take action accordingly.
Brands that use RFM-based customer segmentation analytics can personalize messages, optimize campaign timing, and ultimately boost engagement without increasing spending.
How to Conduct Customer Segmentation Analysis
Wondering how to do customer segmentation analysis that actually leads to smarter targeting and real results? Let’s break it down step by step.

Step 1: Start with market and industry research
Before touching the data, take a step back. What’s happening in your market right now? Who’s gaining ground, and where are customer habits shifting? This first pass provides your analysis with direction, rather than dumping you into a spreadsheet with no sense of purpose.
Begin by researching industry trends, examining what competitors are offering, how customer preferences are evolving, and which new channels are gaining traction. Then look inward. Pull a year’s worth (or more) of your own performance data and start identifying broad patterns: who’s buying, how often, and through which touchpoints.
Ask yourself:
- What’s changed about your customer base in the last 12 months?
- Can you diagnose customer churn? Or are there patterns in repeat purchases?
- Which customer groups generate the most revenue?
This helps you set a purpose: whether your customer segmentation analysis focuses on retention, new acquisition, or campaign optimization.
Without this clarity, everything else becomes a matter of guesswork.
Step 2: Choose the type of segmentation you’ll apply
Before you start pulling data, stop and decide what kind of segmentation actually fits your business. This one decision shapes everything that follows. It decides what customer engagement metrics you’ll track, how you’ll read them, and what kind of insights you’ll be able to use later.
Think of it like setting a filter for your whole analysis. Each type of segmentation shows customers from a different angle, and most of the time, you don’t need every single one. Choose one or two that really match your goal and stick with them.
Here’s a quick rundown of the most common types of customer segmentation you’ll come across:
1. Demographic or socioeconomic segmentation
This looks at who your customers are, such as age, gender, education, income, job, or family setup.
- Use when: You want to understand who’s most likely to buy your product or service.
- Data to gather: CRM profiles, surveys, loyalty programs, and account sign-ups.
2. Behavioral segmentation
This customer segmentation model focuses on what customers do. That is, how often they make purchases, what they browse, where they click, and how they interact with campaigns.
- Use when: You want to see patterns in actions or predict what someone might do next.
- Data to gather: Purchase frequency, browsing behavior, engagement logs, and event data.
3. Geographic segmentation
Sometimes, where customers live or shop changes everything, from climate and city size to delivery zones or cultural preferences.
- Use when: Where customers live affects what they buy or how you deliver.
- Data to collect: Shipping addresses, IP data, and store-level sales records.
4. Technographic segmentation
This approach works best for digital or B2C SaaS products, where the type of device or platform is a key consideration.
- Use when: You sell digital or B2C SaaS products, and device type or platform matters.
- Data to collect: Browser type, device data, app usage, and preferred channels.
5. Psychographic segmentation
This customer segmentation model digs into why people buy, including values, opinions, lifestyle choices, and personality traits.
- Use when: You’re working on brand tone or creative strategy.
- Data to collect: Customer on-site surveys, interviews, social sentiment, and preference data.
6. Needs-based segmentation
Here, you group customers by what they’re trying to solve or achieve.
- Use when: You need to align product features with customer motivations.
- Data to collect: Feedback forms, feature usage data, and customer service logs.
7. Value-Based segmentation (including RFM Analysis)
This one is about business value. It categorizes customers based on the revenue or engagement they generate.
- Use when: You want to prioritize resources or personalize them by potential ROI.
- Data to collect: Recency, frequency, total spend, and lifetime value.
Once you’ve picked your customer segmentation types, you’ll know what to collect and what to ignore. Choosing this in advance saves you time and confusion later. It keeps your segmentation sharp and tied to insights that can actually move the needle.
Step 3: Collect and organize the right data
Now that you’ve decided what kind of segmentation you’re running, the next job is getting the data in shape. This is where many projects fall apart, not because the plan is wrong, but because the data underneath it is messy or incomplete.
Start by listing every place your data lives. That could be your CRM, analytics platform, loyalty system, email marketing software, or transactional database. Note what each source gives you and how often it updates. Doing this early helps you see where information overlaps or where you’re missing key signals altogether.
Next, pull that data together in one place. If you can, automate it. Customer Data Platforms (CDPs) or data pipelines can save you from endless CSV exports and mismatched IDs.
Once it’s all in, begin cleaning:
- Remove duplicates so every customer has a single record.
- Fix missing or incorrect fields before they skew your analysis.
- Standardize formats like names, dates, currencies, and time zones.
- Align identifiers so transactions, emails, and behaviors all connect back to one profile.
The goal is for every customer to have one complete, accurate record. Even small inconsistencies, such as two versions of the same person, can skew your analysis.
When the data looks clean, merge it into a unified view of each customer. This is what lets you connect customer behavior across channels and moments. For example, linking an in-store purchase with an online cart gives a much clearer picture of intent.
If you’re using a cross-channel marketing automation platform like MoEngage, this stage becomes smoother. It automatically collects and connects behavioral, transactional, and engagement data in one place. That unified view makes your customer segmentation analytics faster and more dependable.
After your data is centralized, step back and review it with a critical eye. You might notice signals you’ve never tracked before, like referral sources, churn triggers, and in-app actions. Catching those early gives you a clearer picture before you start grouping customers.
As Aziz Vahora, Senior Director of Data Engineering at Poshmark, put it at The Customer Engagement Summit:
Data without context is dangerous. You can mistake noise for signal and pivot too fast. Clean data grounds you in reality.
That’s the truth most teams overlook. Clean, unified data doesn’t sound exciting, but it’s what holds your entire analysis together. So, take the time to remove duplicates, fix mismatched fields, and align formats. It’s tedious work, yes, but it’s what makes your insights credible and your segmentation worth trusting.
Step 4: Analyze and identify meaningful segments
Once your data is organized, it’s time to dig in and see what it reveals. This is where patterns begin to appear and customers start to form into distinct groups.
Start by asking questions like these:
- Which customers share similar spending habits or interests?
- Are there groups that buy often but spend less, or those who spend heavily but visit rarely?
- Who is most at risk of churning?
Begin simple. Use filters, pivot tables, or visual dashboards to explore patterns in your data. As you identify trends, transition to more advanced tools for customer segmentation analytics that can automatically cluster similar customers based on attributes such as lifecycle stage, product preference, or total revenue.
If you’re using RFM analysis for customer segmentation, this is where you assign scores for Recency, Frequency, and Monetary value. Give each metric a rating, such as 1 to 5, to identify which customers are most loyal, which are inactive, and which fall somewhere in between.
Take your time. Sometimes, what appears to be a strong pattern turns out to be too small or inconsistent to act upon. Adjust and test until the segments start to make sense in real terms.
Once you’re confident, label your segments clearly. Use practical names like “Frequent Buyers,” “Price-Sensitive Shoppers,” or “Lapsed Loyalists.” Then attach measurable criteria to each one so you can track changes over time.
That’s when segmentation stops being theory and starts becoming strategy.
Step 5: Build, test, and refine strategies for each segment
Now, you translate customer segmentation data analysis into action. This is where segmentation creates real marketing impact.
How to apply it:
- Design campaigns tailored to each segment, with distinct messaging, channels, and timing.
- Send re-engagement emails to those with low recency.
- Build loyalty programs for high-frequency customers.
- Offer VIP perks to those with strong monetary value.
- Automate delivery using your customer engagement tool. Platforms like MoEngage enable you to set triggers and flows that adapt in real-time based on customer behavior.
- Track results closely. Are conversion rates rising? Is churn dropping?
Then refine. Customer segmentation analysis is an evolving task because customer behavior shifts, market trends change, and what worked six months ago might not work tomorrow. The best marketing teams review and re-cluster data quarterly to stay ahead.
If you’re new to this, start small. Try one framework like RFM and build from there. Once you see the changes that occur when segments are treated differently, expanding your customer segmentation analytics approach feels more natural than technical.
The more cycles you run, the sharper your instincts get, and that’s where segmentation starts paying off in real ways.
5 Essential Customer Segmentation KPIs and Metrics to Measure Performance
Running a customer segmentation analysis is just one part of the work. Knowing whether it’s actually delivering results is another.
Once you’ve built and activated your segments, you need proof that they’re responding the way you expected. That’s where the right customer segmentation KPIs come in. They turn segmentation from theory into something measurable and alive.
Below are some of the key customer segmentation metrics teams usually monitor. Each metric tells a different side of the story, and together they show whether your segmentation is holding up or drifting off track.
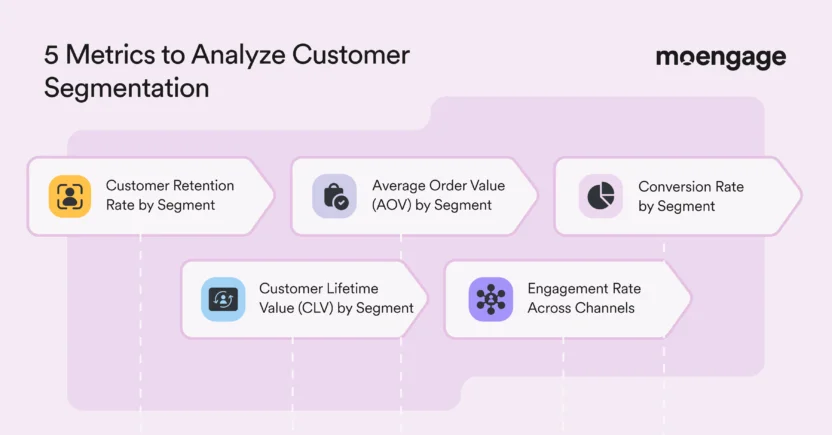
1. Customer Retention Rate by Segment
This one’s straightforward. It measures how many customers in a segment remain loyal over a specified period.
When retention is strong within a group, it usually means your targeting and personalized communication make sense for them. When it falls, it’s often a sign that the message or offer no longer fits. Sometimes it’s timing, sometimes value.
Effective customer segmentation analytics help identify these drops before they escalate into churn.
2. Average Order Value (AOV) by Segment
AOV tracks how much customers in a segment spend on each purchase. It shows which segments bring in the most revenue and how their spending patterns differ. Monitoring this metric helps you identify groups worth a premium offer or a loyalty push.
For example, if your customer segmentation using RFM analysis shows customers with high spending but low frequency, that’s a signal. They may buy big but rarely. That’s a group worth nudging more often.
3. Conversion Rate by Segment
The conversion rate by segment is simple on the surface, but it reveals a great deal. It tells you how many customers in a segment take the desired action – buy, subscribe, register, or whatever the goal is.
When conversion rates stay low, it doesn’t always mean the segment is wrong; sometimes the offer just doesn’t align with where they are in their customer purchase journey. Customer segmentation analysis helps trace that back so marketing teams can adjust timing, creative, or even the channel mix.
4. Customer Lifetime Value (CLV) by Segment
CLV by segment comparison examines how much revenue a customer is expected to generate throughout their relationship with your brand.
Segments with higher CLV usually deserve more retention and loyalty focus. Those who are lower might need extra support early on to stay engaged.
Analyzing CLV by segment also tells you whether your customer segmentation analytics are identifying the right priorities or missing something important.
5. Engagement Rate Across Channels
This metric ties everything together. It examines how customers interact across channels, including opening emails, visiting the site, using the app, and clicking links. When engagement declines, it’s usually the first sign of customer fatigue or ineffective targeting. It’s a sign to implement customer engagement strategies right away.
Pairing this data with RFM analysis for customer segmentation helps you identify which active customers are starting to drift, allowing you to reconnect before they are lost.
None of these numbers works in isolation. They change as customer habits change, and sometimes the patterns take a while to settle.
Segmentation isn’t something you set up and walk away from. It’s a cycle of watching, learning, and adjusting. Sometimes, the data confirms what you thought; other times, it forces you to rethink the entire setup. That’s how it’s supposed to go.

Customer Segmentation Analysis Best Practices: Closing Thoughts
A strong customer segmentation analysis is part science, part instinct. The data shows you what customers do; experience helps you decide what to do next. Keep your segments dynamic, review them often, and let real behavior (not assumptions) guide your strategy.
If you want to go beyond spreadsheets and automate segmentation, personalization, and engagement in one place, explore MoEngage’s customer segmentation and analytics solution.
Ready to see how your own customer segments behave in real-time? Book a demo and experience how MoEngage can bring your segmentation strategy to life.


