


Understanding Bayesian A/B Testing to Analyze Experiment Results

Reading Time: 6 minutes
Experimentation is the key
In marketing and business intelligence, A/B testing is a term used for a randomized experiment to arrive at the optimal choice. Marketers today deal with several choices when it comes to running offers, discounts and even while writing marketing messaging such as email headlines and push notifications. So, instead of relying on intuition to select the best ‘choice’, using data to solve the problem of ‘choices’ can make things simpler and make a marketers’ life easier. These ‘Controlled marketing experiments’ can help improve campaign success.
In the case of marketing automation platforms like MoEngage, experiments are customer campaigns (push notifications, emails) created on an underlying segment (a segment is a set of users exhibiting similar behavior). Target users for the campaign are chosen randomly from the ‘segment’ according to a percentage specified while creating a campaign. If the randomization procedure is correct, we can attribute any difference in outcomes (for example, conversion rate) between the two or multiple groups to the change we are testing without having to account for other sources of variation affecting users behavior.
Analyzing A/B Test Results
Analyzing the results of the test has been the difficult part. Most of the marketers are stuck with drawing a business decision out of results provided by A/B testing tools.
Suppose you ran a test with two variations and you observe the following ‘click-through rates’:-
A : Impressions 50 Clicks 20 CTR 40%
B : Impressions 50 Clicks 25 CTR 50%
One cannot directly conclude that B is the winning variation. It is true that the underlying CTR is not known as we are trying to infer the CTR by carrying out the experiment over a sample. The performance difference we have observed might be merely due to chance rather than because of changes we are testing.
For example, it is entirely possible to obtain different heads/tails ratios between two good coins if we only conduct a limited number of throws. In the same manner, it is possible for us to see a change between the A & B even though in truth the underlying user behavior is the same.
Classical Approach
To understand results of A/B Test we come across terms like “significance,” “p-value” and “confidence interval.” Many A/B testing tools take this classical significance testing approach. You create a null hypothesis that all variations are same and then by running the experiment you try and find evidence to reject the null hypothesis.
The problem with classical significance testing setup:-
- Null hypothesis tests and p-values are hard to understand and hard to explain. There are arbitrary thresholds (0.05?), and the results are binary – you can either reject the null hypothesis or fail to reject the null hypothesis.
- P-value tells only how often you see current results purely by chance. It is often misunderstood as a probability of better performance. Confidence intervals also do not directly answer 95% probability of revenue/CTR/CVR in a range.
Bayesian Testing
To overcome these shortcomings of classical significance testing we have adopted a Bayesian framework. Instead of concentrating on mathematics and proving scientific hypothesis a Bayesian setup can answer the direct questions to fasten the business decision. The analysis is easier to understand as well as to communicate to non-technical audiences. Let’s highlight some terminology that we will see in results.
Beta Distribution
In a Bayesian framework CTR/CVR is thought in terms of a probability distribution which represents our belief based on the sample size. In the above example, ‘Variation B’ has a CTR of 50% inferred over a sample size of 50. This is modeled using Beta distribution as shown below:
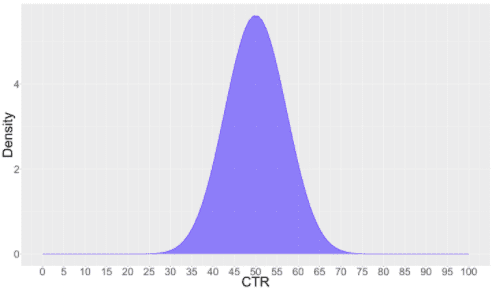
95% Credible Interval
The spread of the curve represents how precisely the experiment has measured the CTR. Peak at about 0.5 (50%) represent it is the most probable value and other values on both side have some chance of being true CTR. 95% Credible interval represents range in which CTR might fall with probability 0.95.
For Variation B this is calculated as (37, 63). More wider this interval more is the uncertainty. As sample size grows this spread squeezes.
Chance of beating
It represents how likely it is that a variation beats other variation or all other variations. For our 2 variate example we again represent belief in CTR of both variations using probability distributions.
A (in Blue) : Impressions 50 Clicks 20 CTR 40% Credible Interval: (28, 54)
B (in Orange) : Impressions 50 Clicks 25 CTR 50% Credible Interval: (37, 63)
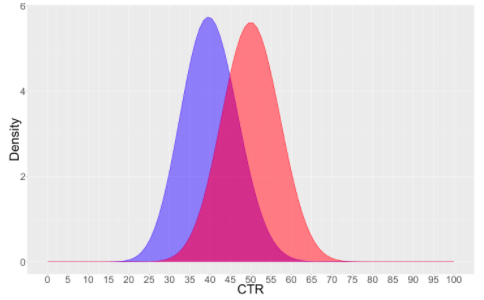
We cannot assume that B is better. Means are quite separate apart, but there is some overlap between distributions. The credible interval above also highlights this overlap region. To quantify this uncertainty, we calculate the probability of one variation beating another i.e., if you randomly draw a sample for Variation A and for Variation B, what are the chances that the sample from B would have a higher CTR than that of A.
Chance of B beating A = 84 %
Chance of beating all
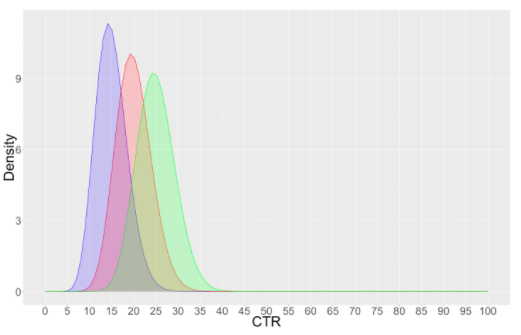
Suppose we have more than 2 variation
A : Impressions 100 Clicks 15 CTR 15%
B : Impressions 100 Clicks 20 CTR 20%
C : Impressions 100 Clicks 25 CTR 25%
Similar to 2 variates case we can calculate:-
Chance of A beating B & C = 2 %
Chance of B beating A & C = 19 %
Chance of C beating A & B = 78 %
| Variates | Impressions> | Clicks | CTR | 95% Credible Interval | Chance of beating all |
| A | 100 | 15 | 15% | (9.33, 23.31) | 2% |
| B | 100 | 20 | 20% | (13.36, 28.91) | 19% |
| C | 100 | 25 | 25% | (17.56, 34.33) | 78% |
What this means for your campaigns
For campaigns with one variation and control
In campaigns where you have 1 variation along with Control Group, if the chances of Variation 1 beating control exceeds 75%, it is established that your campaign communication is helpful in driving your primary conversion goal. We, hence, recommend you remove Control Group and reach out to all users to maximize the campaign coverage and impact.
You can remove them from your running active campaigns by just editing them and setting the Control Group percentage as zero. For single occurrence General Push, you can use this learning for future campaigns of similar nature.

You can see Chances to beat control in your Variation Performance table:
![]()
For campaigns with multiple variations
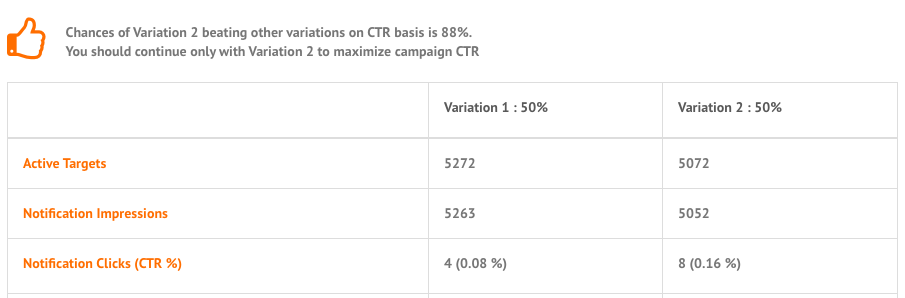
With multiple variations, if the chances of any variation beating all others exceed 75%, it is established that a particular variation is performing better than all the others. We, hence, recommend you to continue only with that variation so that you can maximize campaign impact by sending the most effective message variation.
You can remove other variations from your running active campaigns by just editing and setting other variation percentage as zero. For single occurrence General Push, you can use this learning for future campaigns of similar nature. e.g. for below variation performance, we recommend you to continue with Variation 2 to maximize your campaign CTRs.

A sample campaign may look something like this:>
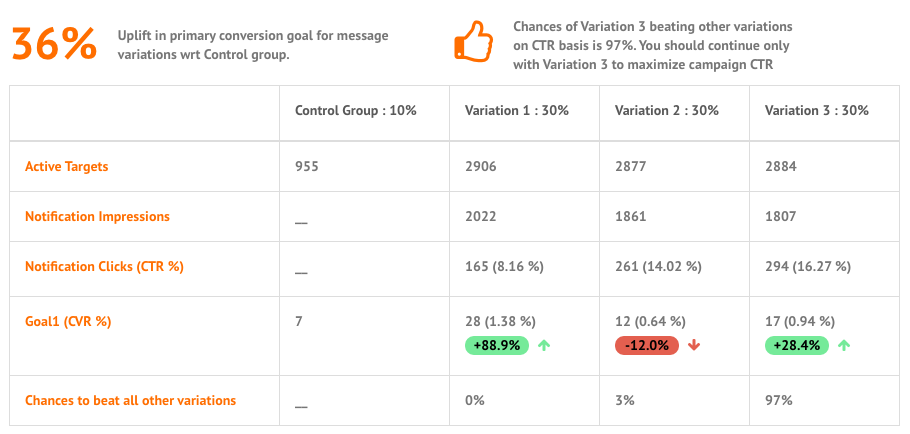
You might have a question that though Variation 1 has high CVR but we are still recommending to continue with Variation 3? It is because we believe that a message copy contributes to increasing/decreasing your message CTR. Conversions are dependent on a lot many other factors as well. We hence consider a variation to be winning over other variations only if it has a higher CTR.
Here’s what you can read next: |


