


Push Notification Delivery Calculator
Learn how to avoid low Push Notification delivery rates that hurt your conversions in a few clicks

With Push Amplification™ Plus
0%
Push Notification delivery rate
0
Reachable users
Without Push Amplification™ Plus
0%
Push Notification delivery rate
0
Reachable users
0%

Projected uplift in Push Notification Delivery Rates with Push Amplification™ Plus that increases mobile customer reachability
Learn how mobile customer reachability and Push Notification delivery rates vary with multiple internal and external factors.
Personalization
Personalization
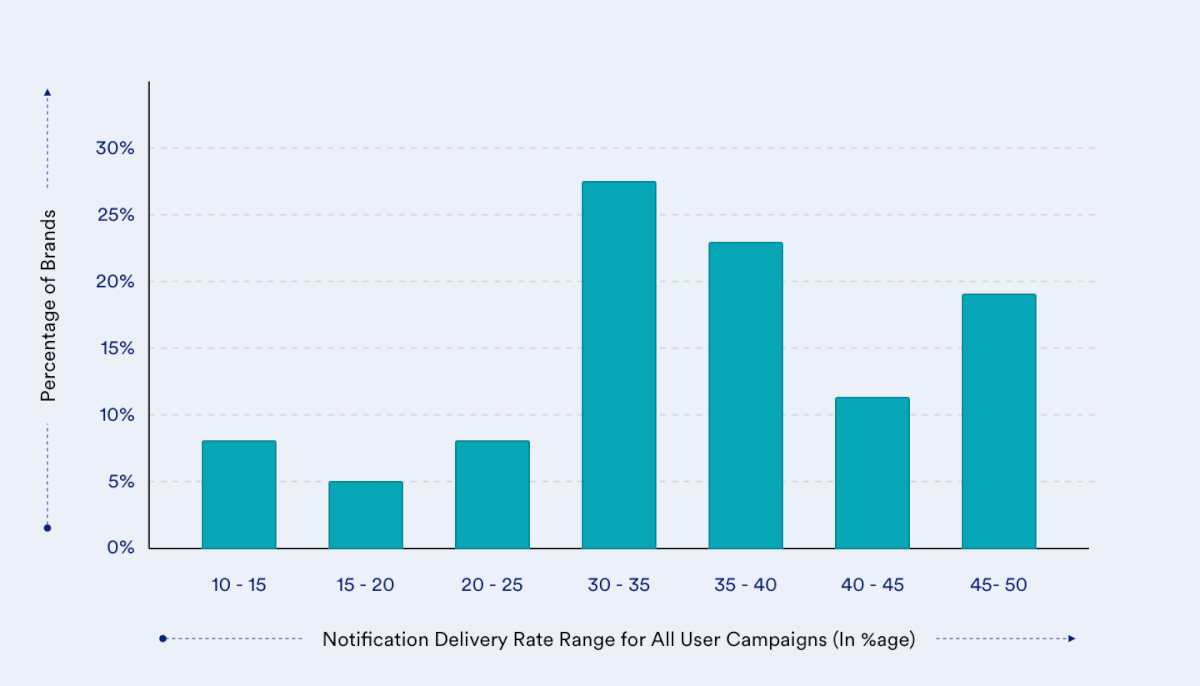
The success of Push Notifications depends on the personalization and relevancy of the message. The graph below shows that Push Notification Delivery Rates are less than 50% for non-personalized campaigns.
-
Frequency of App Usage
Frequency of App Usage
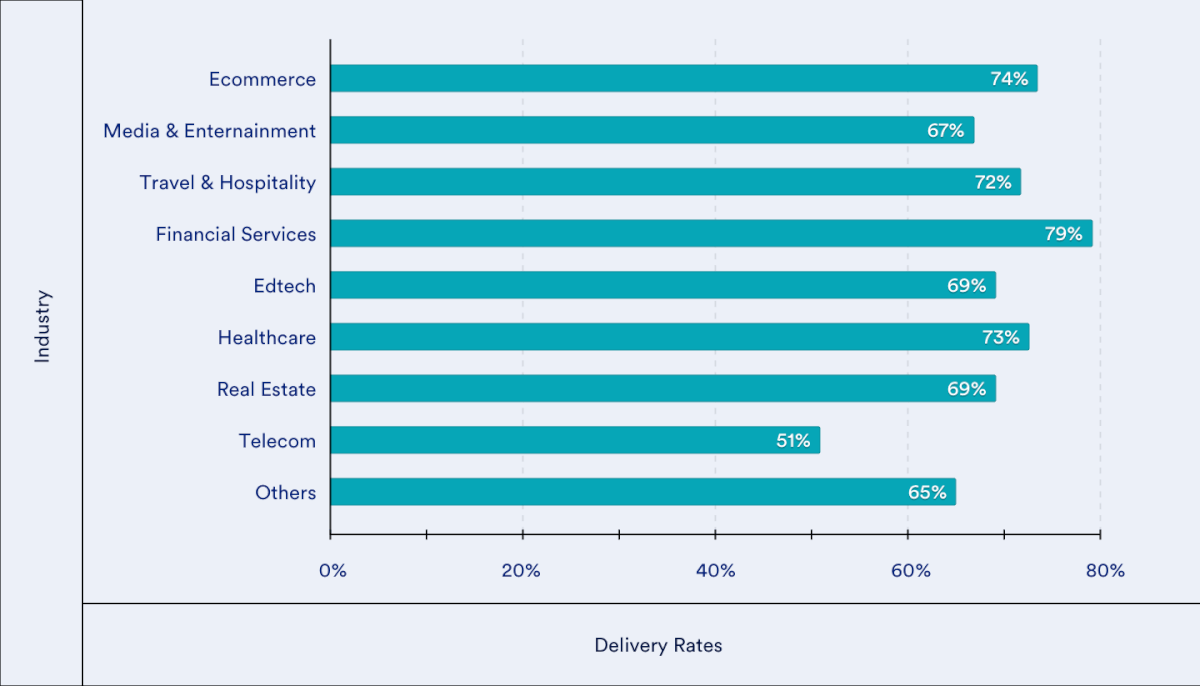
Push Notification Delivery rates depend on the app type and frequency of usage. For example, in the graph below, the delivery rates for Shopping apps are higher than Telecom because they are used more frequently.
-
Recency of App Activity
Recency of App Activity
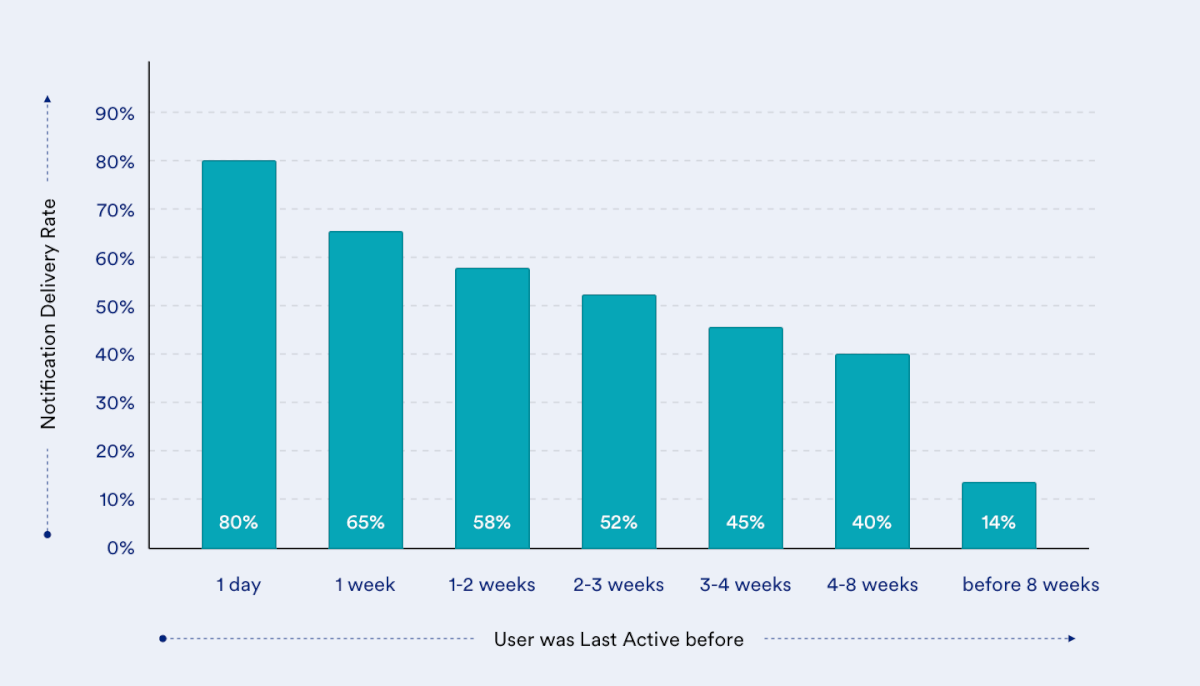
There’s a direct correlation between app activity and Push Notification Deliverability. In the graph below, Delivery Rates reach up to 80% for mobile apps where the most recent activity was less than 24 hours ago.
-
Notification Interactions
Notification Interactions
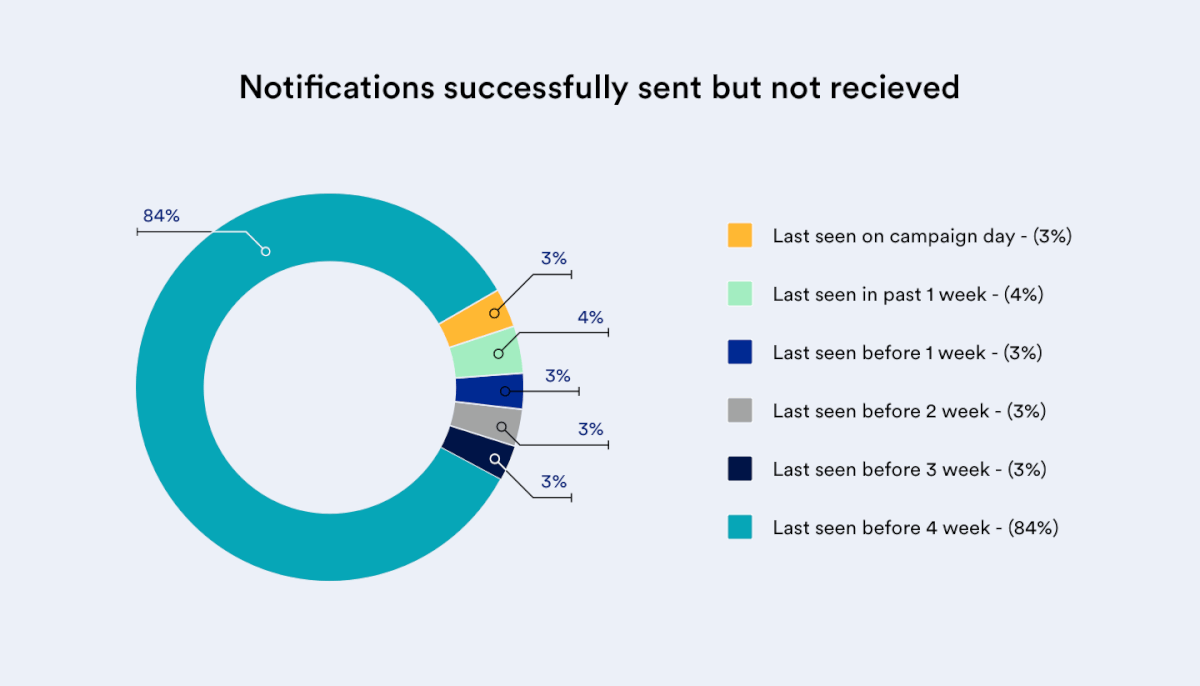
As the time between interactions on Push Notifications increases, Delivery Rates decrease. In the chart, 84% of customers did not receive Push Notifications because they did not click on the previous ones for 4 weeks.
-
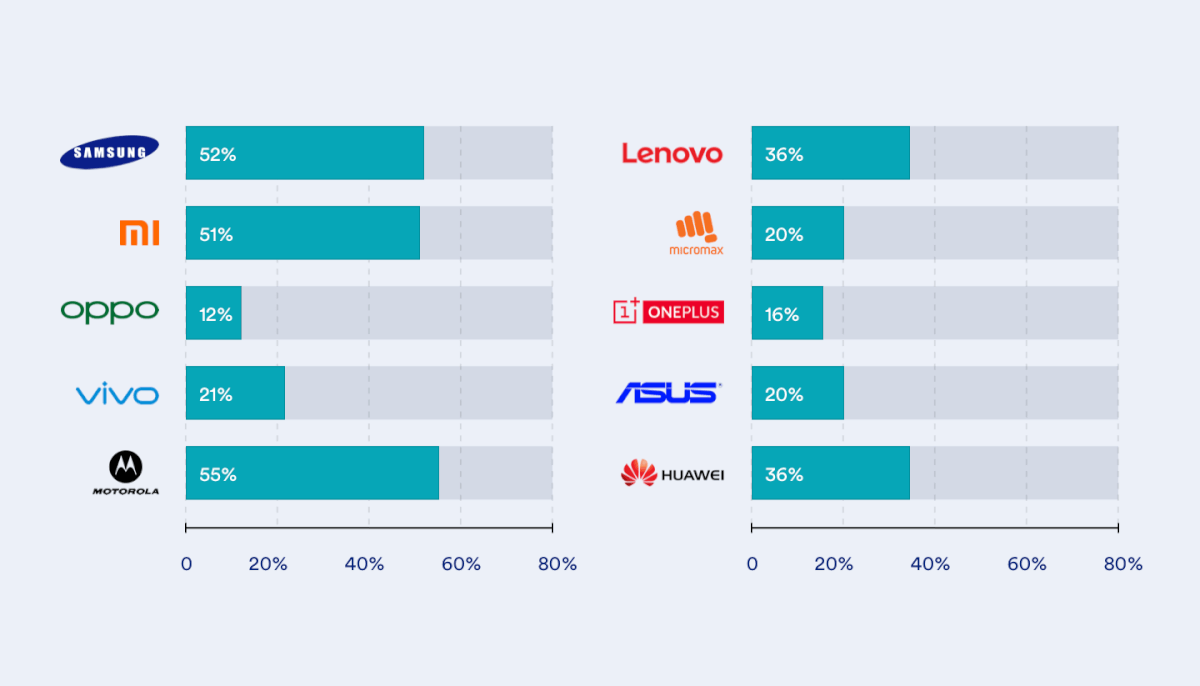
Device and OEM
Device and OEM
Chinese OEMs have OS-level customizations that restrict background app activity to optimize battery and device performance. This results in poor Push Notification Delivery Rates on such Devices and OEMs.
-
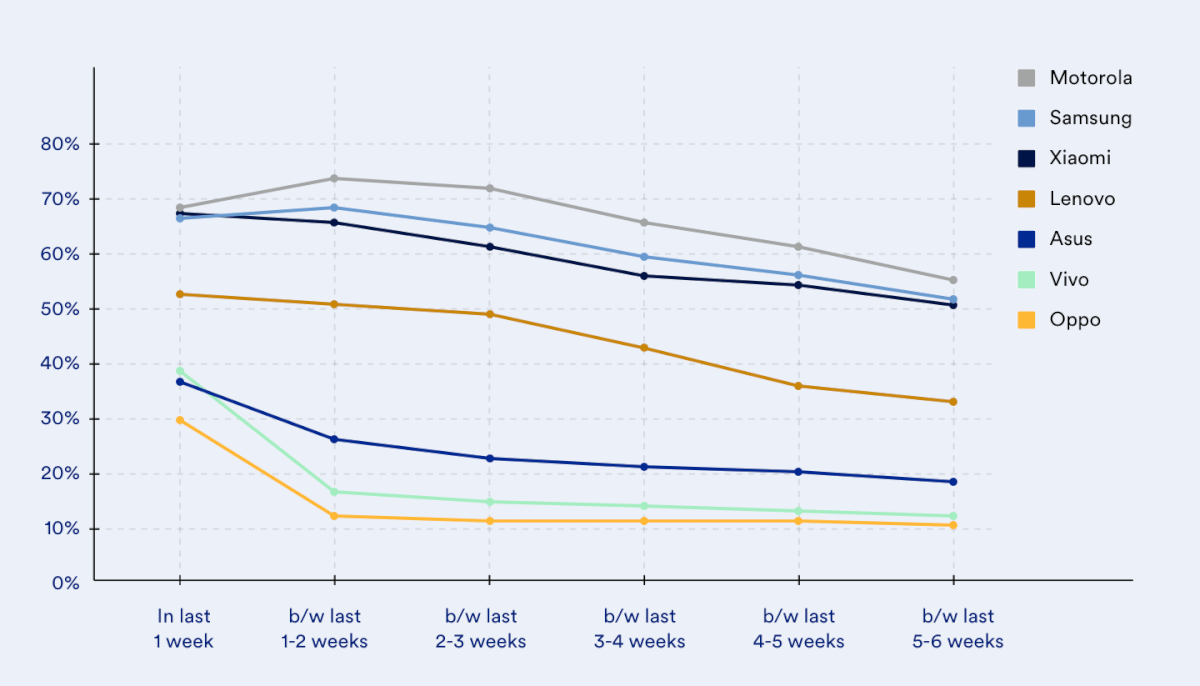
Device and App Activity
Device and App Activity
There is a direct correlation between mobile devices and app activity. For all device models, we consistently found that the Delivery Rates drastically drop as app inactivity increases.
-
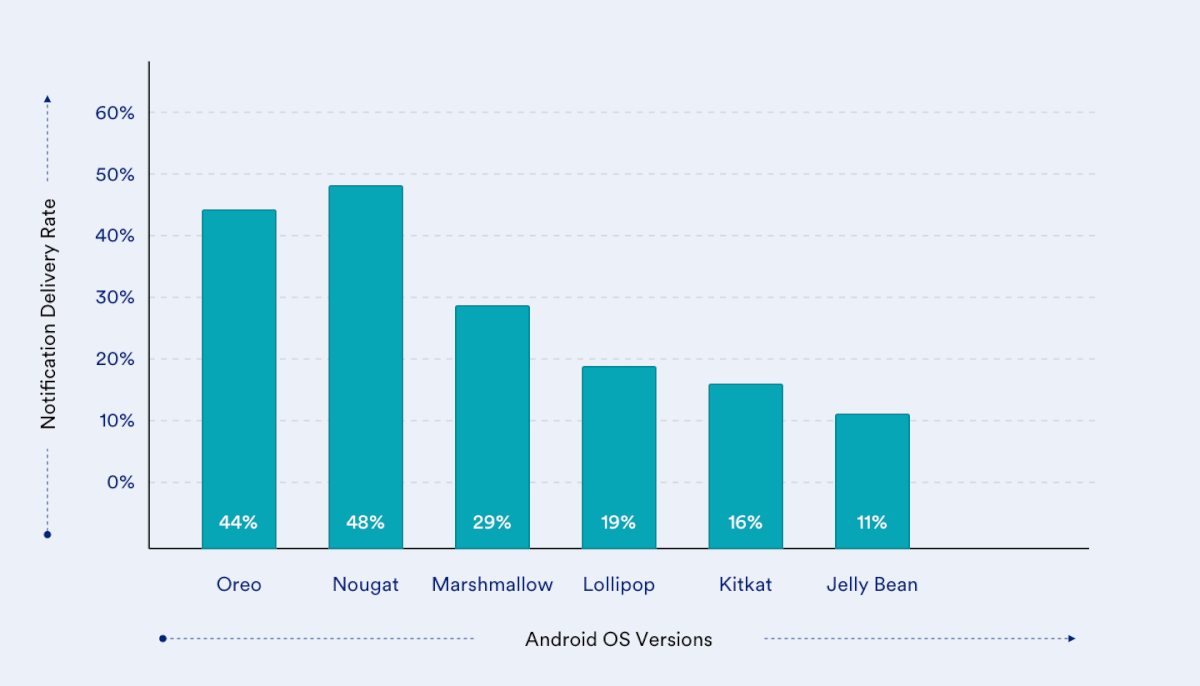
Android OS version
Android OS version
Older OS versions of Android like Lolipop, Kitkat, and Jellybean were found to have lower Delivery Rates while new versions have better Push Notification Deliverability.
-
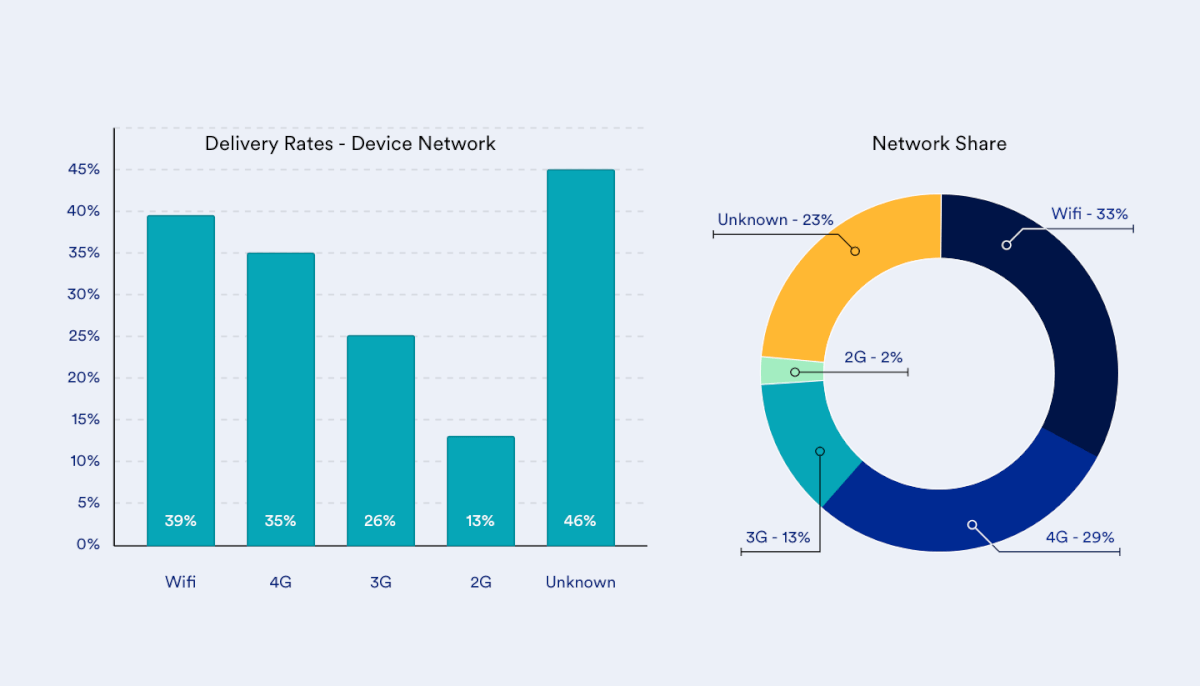
Internet Connection Type
Internet Connection Type
There is a correlation between network latency and Push Notification Delivery Rates. Because WiFi and 4G connections have a lower latency, Push Notification Deliverability is higher than 2G and 3G connections.
-
What Top Brands Say About MoEngage

MoEngage has been a great partner to have for BigBasket on several fronts. We've grown exponentially since we onboarded MoEngage, and they have been able to scale with us with ease. Product innovation throughout the years, as well as the impeccable support from the Customer Success team, have been truly commendable!

Flexibility in segmentation and advanced analytics features of the MoEngage platform has helped us to understand customer behavior in a much better way. Based on the past behavior of customers we are able to retain them on our platform.

At OYO, we are committed towards delivering an unparalleled hotel booking experience to our guests and MoEngage is the right partner who can help us get there with their differentiated offering. We have witnessed improvement in delivery rates, made possible by MoEngage’s proprietary technology, Push Amplification™.

MoEngage played a key role in achieving significant growth in CRM. It’s omni-channel and analytics suite was not only helpful in CRM but for the overall organization. Apart from the exhaustive list of features, their account management is one of the best in industry.

MoEngage’s state-of-the-art dashboard, rich analytics with behavioral insights, and formidable customer support have helped us in our growth. With a powerful insights-led CEP like MoEngage, we aim to bridge the gap between the local aggregators and commission agents in India to promote healthy, long-term relationships.

MoEngage has helped us identify various user journeys and allowed us to build an effective omnichannel communication strategy. This overall strategy helped us quickly scale our conversations by focusing on effective engagement and personalization using their segmentation and engagement features.

What Top Brands Say About MoEngage
MoEngage has been a great partner to have for BigBasket on several fronts. We've grown exponentially since we onboarded MoEngage, and they have been able to scale with us with ease. Product innovation throughout the years, as well as the impeccable support from the Customer Success team, have been truly commendable!
We've been able to adopt AI technology and encourage customers to adopt healthy saving habits and make better financial decisions. We've improved customer journey mapping thus providing a seamless experience. We are also offering easy solutions to be closer to our customers, resulting in a 2x boost in customer engagement.

At OYO, we are committed towards delivering an unparalleled hotel booking experience to our guests and MoEngage is the right partner who can help us get there with their differentiated offering. We have witnessed improvement in delivery rates, made possible by MoEngage’s proprietary technology, Push Amplification™.
Constant engagement and personalization are critical for customer retention and conversions. MoEngage helps us achieve both in an effective manner. The platform helps us improve customer experience significantly.

Ahamove was able to deploy in-app, banner and email campaigns with ease. This, in turn, increased our traffic and engagement, ultimately leading to a significant increase in the conversion rate of our campaigns.

MoEngage’s predictive AI removes the need to hire an additional resource to implement an algorithm to send communications in the best channel or time. MoEngage also allows us to send time-sensitive and critical campaigns at specific times. We’re able to send promotions tailored for each person, which resulted in a 41% increase in conversions.

What Top Brands Say About MoEngage
MoEngage has been a great partner to have for BigBasket on several fronts. We've grown exponentially since we onboarded MoEngage, and they have been able to scale with us with ease. Product innovation throughout the years, as well as the impeccable support from the Customer Success team, have been truly commendable!
Flexibility in segmentation and advanced analytics features of the MoEngage platform has helped us to understand customer behavior in a much better way. Based on the past behavior of customers we are able to retain them on our platform.
At OYO, we are committed towards delivering an unparalleled hotel booking experience to our guests and MoEngage is the right partner who can help us get there with their differentiated offering. We have witnessed improvement in delivery rates, made possible by MoEngage’s proprietary technology, Push Amplification™.
We have partnered with MoEngage over the past three years to leverage ‘Sherpa’ which is an intelligent customer engagement platform. This application has enabled Mashreq Neo to better understand customer behavior thereby allowing us to make proactive decisions through the use of artificial intelligence.

MoEngage played a key role in achieving significant growth in CRM. It’s omni-channel and analytics suite was not only helpful in CRM but for the overall organization. Apart from the exhaustive list of features, their account management is one of the best in industry.
MoEngage Dynamic Emails helped us create personalized re-targeting emails, within minutes targeting towards cart and browse abandoners. These emails typically help us recover up to 10% of abandoning users.
What Top Brands Say About MoEngage
MoEngage has been a great partner to have for BigBasket on several fronts. We've grown exponentially since we onboarded MoEngage, and they have been able to scale with us with ease. Product innovation throughout the years, as well as the impeccable support from the Customer Success team, have been truly commendable!
Flexibility in segmentation and advanced analytics features of the MoEngage platform has helped us to understand customer behavior in a much better way. Based on the past behavior of customers we are able to retain them on our platform.
At OYO, we are committed towards delivering an unparalleled hotel booking experience to our guests and MoEngage is the right partner who can help us get there with their differentiated offering. We have witnessed improvement in delivery rates, made possible by MoEngage’s proprietary technology, Push Amplification™.
We have partnered with MoEngage over the past three years to leverage ‘Sherpa’ which is an intelligent customer engagement platform. This application has enabled Mashreq Neo to better understand customer behavior thereby allowing us to make proactive decisions through the use of artificial intelligence.
MoEngage played a key role in achieving significant growth in CRM. It’s omni-channel and analytics suite was not only helpful in CRM but for the overall organization. Apart from the exhaustive list of features, their account management is one of the best in industry.
MoEngage Dynamic Emails helped us create personalized re-targeting emails, within minutes targeting towards cart and browse abandoners. These emails typically help us recover up to 10% of abandoning users.
What Top Brands Say About MoEngage
MoEngage has been a great partner to have for BigBasket on several fronts. We've grown exponentially since we onboarded MoEngage, and they have been able to scale with us with ease. Product innovation throughout the years, as well as the impeccable support from the Customer Success team, have been truly commendable!
Flexibility in segmentation and advanced analytics features of the MoEngage platform has helped us to understand customer behavior in a much better way. Based on the past behavior of customers we are able to retain them on our platform.
At OYO, we are committed towards delivering an unparalleled hotel booking experience to our guests and MoEngage is the right partner who can help us get there with their differentiated offering. We have witnessed improvement in delivery rates, made possible by MoEngage’s proprietary technology, Push Amplification™.
Constant engagement and personalization are critical for customer retention and conversions. MoEngage helps us achieve both in an effective manner. The platform helps us improve customer experience significantly.
What Top Brands Say About MoEngage
I would definitely recommend MoEngage to others, and I have on separate occasions. MoEngage has helped us in transitioning from EngageFT and allowed us to speed up product launch while we were nearing our sales cycle.

New user retention is the first true litmus test for any SaaS company. MoEngage’s customer engagement tools helped us exceed industry benchmarks for new customer retention. It enabled us to keep track of our new users by designing engagement flows that were laser-focused on our main goals of increasing engagement and retention.

We have partnered with MoEngage over the past three years to leverage ‘Sherpa’ which is an intelligent customer engagement platform. This application has enabled Mashreq Neo to better understand customer behavior thereby allowing us to make proactive decisions through the use of artificial intelligence.
We wanted a unified solution for communicating with app customers. MoEngage provided us with the best solution. It’s an easy platform to use, and the team is very responsive to any support required.

What Top Brands Say About MoEngage
I would definitely recommend MoEngage to others, and I have on separate occasions. MoEngage has helped us in transitioning from EngageFT and allowed us to speed up product launch while we were nearing our sales cycle.
New user retention is the first true litmus test for any SaaS company. MoEngage’s customer engagement tools helped us exceed industry benchmarks for new customer retention. It enabled us to keep track of our new users by designing engagement flows that were laser-focused on our main goals of increasing engagement and retention.
We have partnered with MoEngage over the past three years to leverage ‘Sherpa’ which is an intelligent customer engagement platform. This application has enabled Mashreq Neo to better understand customer behavior thereby allowing us to make proactive decisions through the use of artificial intelligence.
We wanted a unified solution for communicating with app customers. MoEngage provided us with the best solution. It’s an easy platform to use, and the team is very responsive to any support required.
Frequently Asked Questions
What is Push Amplification™?
Even though you may not achieve 100% delivery rates, you can still improve your existing delivery rates with Push Amplification™ tools like MoEngage. Push Amplification™ detects the failure in notification delivery and acts as a fallback to the FCM, thereby delivering the notification to customers. This amplifies the reach and improves overall delivery rates by up to 40%.
Why do you need Push Amplification™?
Not all Push Notifications that are sent reach the end customers. While cloud messaging platforms accept all the notifications, it fails to send them to customer devices that are inactive or not connected to the internet. The notifications that are successfully sent to FCM are thus not delivered to the end customers. This happens because factors like OEM restrictions and network issues cut off some customer's device from FCM service.
What are the benefits of using Push Amplification™?
MoEngage Push Amplification™ helps marketers solve the push delivery issue and reach more potential customer devices that are cut off from FCM. With Push Amplification™, brands can improve their push delivery rates by 40%, thereby reaching more app customers and driving more conversions.
What are Push Notifications?
Push Notifications are short pop-ups like messages sent by apps to mobile devices that host the apps. Companies use mobile Push Notification to send targeted, relevant messages based on specific customer behavior.
How do marketers use mobile Push Notifications?
Mobile push notification are a great way to drive customer engagement. Push notification can be used to meet a variety of customer engagement needs on an app like transactional alerts, offers, etc.
How are Push Notifications delivered to mobile customers?
All mobile devices have push tokens. A Push token is a unique identifier issued by cloud messaging platforms such as the Apple Push Notification Service (APNS) and Firebase Cloud Messaging (FCM) that enables marketers to communicate with app customers. To deliver Push Notifications to app customers, marketers launch the campaign using marketing partner tools like MoEngage. The marketer's campaign is then sent to cloud messaging platforms such as FCM, and APNS. These messaging platforms deliver the notification from the marketing partner to the end customer's device.
How do you measure the Push Notification Delivery Rates?
Delivery Rates for Push Notification are measured as the ratio of impressions to the number of messages successfully sent. Here, successfully sent is the total count of notifications accepted by FCM/APNS and impressions are the total number of customer devices that received the notification.
